
Chapter 6
Liquid–Solid Systems
Abstract
This chapter concerns the case where the continuous phase is a liquid. The most obvious difference is that in liquid–solid systems the difference in densities between the phases is much lower than in a gas–solid system, so that the particle settling velocity is also much reduced. In practice, suspensions of solid particles in liquids are divided into “settling” and “nonsettling.” Roughly speaking, particles above about 100 μm in size in water show noticeable settling behavior, while those below this size will remain in suspension quite easily. An example of a “nonsettling” system is a pharmaceutical oral suspension of a nonsoluble drug, where the particles are typically in the size range 5–50 μm. From the settling velocity Eqs (4.10) and (4.11), it is apparent that the tendency toward settling is reduced by (1) decreasing the particle size and (2) increasing the liquid viscosity. Even so, bottles of such products often carry the instruction “shake before use!” Other products which are sold as suspensions of particles in a continuous liquid phase include paint, ink, abrasive cleaning products, and foods. If the particle size is below about 1 μm, the dispersion is known as colloidal.
Keywords
Agglomeration; Colloidal; Liquid–solid systems; Pastes; Rheology; SuspensionsChapter 5 is concerned with multiphase systems where the continuous phase is a gas; this chapter concerns the case where the continuous phase is a liquid. The most obvious difference is that in liquid–solid systems the difference in densities between the phases is much lower than in a gas–solid system, so that the particle settling velocity is also much reduced. In practice, suspensions of solid particles in liquids are divided into “settling” and “nonsettling.” Roughly speaking, particles above about 100 μm in size in water show noticeable settling behavior, while those below this size will remain in suspension quite easily. An example of a “nonsettling” system is a pharmaceutical oral suspension of a nonsoluble drug, where the particles are typically in the size range 5–50 μm. From the settling velocity equations (section 4.3), it is apparent that the tendency toward settling is reduced by (1) decreasing the particle size and (2) increasing the liquid viscosity. Even so, bottles of such products often carry the instruction “shake before use”! Other products which are sold as suspensions of particles in a continuous liquid phase include paint, ink, abrasive cleaning products, and foods. If the particle size is below about 1 μm, the dispersion is known as colloidal.
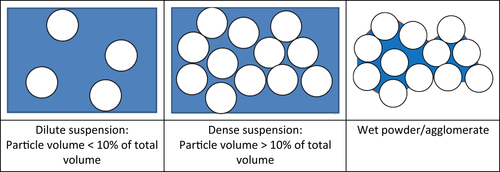
The behavior of liquid–solid systems depends very much on the ratio of phase volumes, as shown in Fig. 6.1. The phase volume, ϕ, is the fraction of the total volume occupied by the phase in question. On the left is shown a dilute suspension, with a solid-phase volume less than 10%, for which the flow properties are dominated by the liquid phase. In the center is a dense suspension, where the particles are approaching a dense packing. In this case the flow properties are strongly influenced by the presence of the solids and the interactions between them. On the right is a loose aggregate of particles with liquid in the pore spaces between them. Each of these situations is considered in more detail below.
As the particle size is reduced, not only is settling less evident, but surface forces between the particles increase due to electrostatic interactions, van der Waals' forces, and steric interactions between adsorbed molecules. At the same time, the random movement of the particles due to molecular impacts (Brownian diffusion) increases. The combination of these effects can lead to particle aggregation, which can cause settling and phase separation. These issues and the surface chemistry associated with them are considered in detail by Shaw (1992).
6.1. Rheology of Suspensions
Rheology is the study of flow; rheology of suspensions is of great importance in the development of suspension products, which are usually designed to flow in particular ways. For example, rheology is an important contributor to “mouth feel” in food and drink products.
Introduction of particles allows the rheological behavior to be manipulated to give the desired product properties. For example, paint needs to flow well at high shear rates (under the brush) but be resistant to flow when applied (not running or dripping). Suspensions which are to be pumped or sprayed need to have low viscosity under shear.
It is to be expected that the addition of particles to the liquid will have a fluid mechanics effect, in general causing an increase in viscosity. However, if the particles carry charge, which is invariably the case in colloidal systems, they can form structures ranging from aggregated flocs, which can trap some of the continuous phase within them, to gel-like materials which behave in an elastic way and can immobilize the system at low shear rates.
Figure 6.2 shows a liquid, with and without suspended particles, in simple shear.

Viscosity is the constant of proportionality between the force per unit area (the shear stress) and the resulting velocity gradient in the direction perpendicular to the flow direction (the shear rate):
![]() (6.1)
(6.1)
where τ = F/A is the shear stress, η is the fluid viscosity, and  (=v/h) is the shear rate, where v is the velocity at height h. Here A is the surface on which the shear force F is acting and h is the height of the fluid element being sheared.
If the fluid obeys this linear relationship, then it is termed Newtonian, which means that its viscosity is independent of shear rate; water is the best-known example. Newtonian liquids show no variation in viscosity with time of shearing, and when shearing stops, the shear stress returns immediately to zero.
In general, adding particles to a Newtonian liquid increases its viscosity, but it may also cause it to behave in a non-Newtonian way, showing viscosity which depends on shear rate, time-dependent behavior, or even the occurrence of an apparent yield stress.
Figure 6.2 also shows the shear of a suspension, which was studied by Einstein (see Barnes et al., 1989), who showed theoretically that the addition of particles increased the viscosity according to
![]() (6.2)
(6.2)
where η is the viscosity of the suspension, ηs is the viscosity of the suspension liquid, and ϕ is the volume fraction of the solid phase, as before. The derivation of this equation considers the particles as isolated spheres, and so the result is only valid at small phase volumes, ϕ < 10%. At higher phase volumes, results of the form η = ηs(1 + aϕ + bϕ2 +…) are available, but these are of limited applicability.
Clearly, there is a maximum solid-phase volume which corresponds to the maximum packing fraction ϕm. This is readily calculable for equally sized spheres.
| Arrangement | Maximum Packing Fraction |
| Simple cubic | 0.52 |
| Body-centered cubic | 0.68 |
| Face-centered cubic/hexagonal close packed | 0.74 |
Other approaches to the problem of predicting the viscosity of suspensions, such as averaging techniques, result in equations such as the widely used Krieger and Dougherty expression:
![]() (6.3)
(6.3)
where [η] is the (dimensionless) “intrinsic viscosity,” which takes values between 2.5 and about 10, depending on particle size, size distribution, and shape. In practice, ϕm and [η] are fitted to experimental results, as shown by Barnes et al. (1989). At low ϕ, Eq. (6.3) gives results equivalent to Eq. (6.2).
So far we have considered only Newtonian liquids and suspensions, i.e., those for which the viscosity is independent of shear rate, as shown in Fig. 6.3(a).
More generally, suspensions show a range of non-Newtonian behavior, in which the viscosity is dependent on shear rate, as in Fig. 6.3(c) and (d) and Fig. 6.4, and/or shows a yield stress, as in Fig. 6.3(b). Nonlinear behavior such as that shown in Fig. 6.3(c) and (d) is often characterized as that of a “power law” fluid:
![]() (6.4)
(6.4)


If the suspension shows both a yield stress and power-law type behavior, it may obey the widely used Herschel–Bulkley equation:
![]() (6.5)
(6.5)
In pipe flow, both Bingham and Herschel–Bulkley fluids show a region of plug flow near the centerline of the pipe and high strain rate near the wall.
The same suspension can show both shear-thinning and shear-thickening behavior. Typically, the former is associated with alignment of the particles into shear bands or two-dimensional structures which slide easily over one another, while the latter occurs when such structures are disrupted at higher shear rates. Suspension rheology becomes extremely sensitive to shear rate, particle size, and particle shape at values of solid-phase volume around 0.5, and such suspensions can show a “critical shear rate” at which the viscosity increases by as much as two orders of magnitude (Barnes et al., 1989). This jump in viscosity can be reduced by widening the particle size distribution.
An additional complication in rheology of suspensions is time-dependent behavior. For example, thixotropy is the time-dependent reduction in viscosity on shearing, caused by breakdown in the microstructure and normally followed by full or partial recovery of properties. Many clays, such as bentonite, show this behavior.
If one extreme of suspension behavior is Newtonian liquidlike behavior, the other is solidlike linear-elastic behavior, associated with Hooke's law:
![]() (6.6)
(6.6)
where G is the shear modulus (independent of the stress and time constant) and γ is the shear strain. Suspensions can show this form of behavior if they are strongly cross-linked into a solid gel structure. More commonly, gels show a combination of liquidlike and solidlike behavior known as viscoelasticity. For a viscoelastic material which is held at constant strain, the shear stress relaxes over time. This kind of behavior can be investigated in an oscillatory shear device and the material response characterized in terms of both magnitude and phase.
Figure 6.5 shows an example of how the behavior of a suspension can be manipulated from predominantly viscous to highly elastic by making a small change in composition.

Figure 6.5 Transition from weakly elastic, predominantly viscous to highly elastic, gel-like behavior (Willenbacher and Georgieva, 2013). The effect is produced by adding 0.5% wt of water to a suspension of hydrophobically modified CaCO3 (diameter = 800 nm, ϕ = 0.11) in diisononyl phthalate. The water forms capillary bridges between the particles.
6.2. Pastes
Pastes are highly filled suspensions with a solid-phase volume approaching the maximum packing fraction. Apart from well-known domestic examples such as toothpaste and some food products, pastes represent a very important stage in a number of manufacturing processes, particularly for extruded products such as catalysts, foods, pharmaceuticals, and ceramics. Pastes can be divided into “stiff” and “soft” (Wilson and Rough, 2012), according to the relative magnitude of the two terms on the right-hand side of Eq. (6.5): if τy is larger, the paste is “stiff” and shows predominantly plastic behavior, as in many ceramic pastes, which are required to maintain their shape after extrusion while firing into a final form. An example of a “soft” paste is molten chocolate, which shows plastic behavior at comparatively low temperatures.
Just as in the tabletting process (Chapter 10), wall slip is a common feature of paste extrusion, so that paste may move in plug flow with deformation only at the wall.
The most commonly applied method of characterizing pastes is due to Benbow and Bridgwater (1993) and makes use of the simple flow geometry shown in Fig. 6.6. The essential idea behind this simple experimental approach is that the overall extrusion pressure, Pex, is made up of the sum of P1, the pressure required to achieve the deformation required at the die entry, and P2, the pressure required to push the paste plug along the die land:
![]() (6.7)
(6.7)
Equation (6.7) assumes homogeneous deformation of a perfect plastic undergoing a change in cross-sectional area from πD02 to πD2 (Fig. 6.7), where σY is the uniaxial bulk yield stress of the paste and τW is the wall shear stress in the die land.
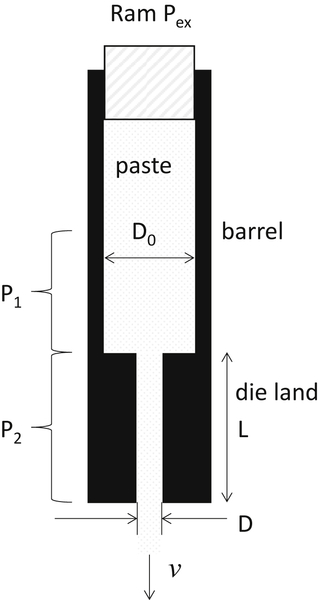
Figure 6.6 Schematic of Benbow and Bridgwater ram extruder configuration; the ram forces material from the barrel (diameter D0) through the die land of diameter D and length L, at a mean extrudate velocity, v.
In general, both σY and τW can be functions of the strain rate, so can be written in terms of the extrusion velocity, v:
![]() (6.8)
(6.8)
and
![]() (6.9)
(6.9)
A series of experiments is then carried out in which v and L/D are varied, from which the four (if m = n = 1) or six fitting parameters are obtained. This approach has been used successfully for a wide range of paste materials. Its usefulness and comparison with more rigorous analyses are considered by Wilson and Rough (2012).
Two particular problems associated with paste extrusion should be mentioned: post-extrusion fracture and liquid-phase migration. Just as tablets ejected from dies show stress relaxation which can lead to fracture, paste extrudates leaving the die land can show similar behavior, including the distinctive circumferential fracture shown in Fig. 6.8.
Liquid-phase migration occurs when the pore pressure in the liquid causes it to move relative to the solids, so causing local differences in phase volume; low liquid content gives rise to increased bulk yield stress and can cause blockages and poor product quality. Liquid-phase migration depends on the permeability of the solids phase and the properties of the liquid, as described in Section 5.2, and therefore puts limits on the paste formulation. Prediction is difficult, however, because of consolidation of the solid during extrusion.

Figure 6.7 Flow visualization of a microcrystalline cellulose/water paste extruding (top to bottom) through a semicylindrical die: streak photograph of streamlines (left); fluid dynamics simulation assuming Bingham plastic behavior with Navier-type wall slip: streamlines (right). Courtesy of Matthew Bryan, Sarah Rough and Ian Wilson, University of Cambridge.

Figure 6.8 Circumferential fracture of paste extrudate (Russell et al., 2006).
6.3. Agglomeration
Many commonly used products such as foods, beverages, and pharmaceuticals are sold as aggregated or agglomerated structures, or pass through such a form in their manufacture, and there are many products of the chemical industry, such as catalysts and solid fuel pellets, which are similarly manufactured. A common method consists of mixing the fine constituent powder(s) mechanically or by means of fluidization, for example, while spraying a liquid binder into or onto the agitated powder bed. This is known as wet agglomeration, as distinct from dry processes such as roll pressing (Wu et al., 2010). Examples of wet agglomeration devices are shown in Fig. 6.9.
Although the devices used for agglomeration vary in design, the processes which occur within them have some similarity. Figure 6.10 shows these processes schematically: (i) wetting and nucleation, (ii) consolidation and coalescence, and (iii) attrition and breakage. These are not usually sequential but occur simultaneously, especially in batch agglomerators.
As the binder liquid is sprayed onto the powder bed, a process of nucleation of potential agglomerates occurs. This is a rapid process which requires only capillary action. Unlike nucleation in crystallization, there is no energy barrier to be overcome. Although fine sprays are often used, in practice the liquid is never uniformly distributed, the nonuniformity becoming more pronounced with increasing scale of operation. It is normal to form a bimodal agglomerate size distribution at this stage, which may persist throughout the process, as shown in Fig. 6.11.
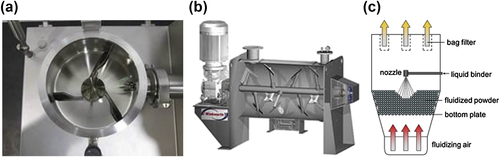
Figure 6.9 Common types of batch industrial agglomeration devices: from left to right—a high-shear mixer-granulator, a ploughshare mixer, and a fluidized bed granulator. [Images reproduced with permission (all rights reserved): (a) Surplus Solutions, LLC, http://www.ssllc.com/; (b) Winkworth Machinery Ltd., http://www.mixer.co.uk; (c) Fries et al., 2013].

Figure 6.10 Processes occurring in agglomeration (Iveson et al., 2001).

Figure 6.11 Agglomerate size and liquid distributions at different times after liquid addition in a high-shear mixer-granulator (4 μm solid, liquid/solid ratio = 0.17) (Knight et al., 1998).
The size of the nuclei depends on the size of the sprayed liquid drops, if this is the method of addition. If the liquid is poured into the mixer rather than sprayed, then the size of the nuclei depends on the mixing intensity.
This initial nuclei formation is considered further by Litster et al. (2001), for a spray of droplets of size d, of total volumetric flow rate V′, arriving at a surface being renewed at a rate A′ per square meter per second, as shown in Fig. 6.12.
The number of drops per unit time, n′, is given by:
![]() (6.10)
(6.10)
and the cross-sectional area per drop, a, is πd2/4, so that the new area covered by drops per unit time is given by
![]() (6.11)
(6.11)

It is then possible to write a dimensionless spray flux (the wetted area per unit time/area of powder renewed per unit time):
![]() (6.12)
(6.12)
Litster et al. (2001) demonstrated experimentally a clear dependence of the nucleated agglomerate number on the dimensionless spray flux, as shown schematically in Fig. 6.13.
The most important parameter in wet agglomeration processes is saturation, S, which is defined as the volume of voids filled with liquid divided by the total volume of voids. The total void volume depends on the packing of the particles, which can change over time. In general, therefore, saturation increases not only with the amount of liquid added but also as the agglomerates consolidate in response to the agitating action. Figure 6.14 shows agglomerates with saturations from zero (loose powder) through partially saturated (weak agglomerate) to fully saturated (paste-like). Note that if the agglomerate is surface-wet, the saturation may exceed 1. The picture is further complicated by the fact that drying may occur simultaneously or sequentially with liquid addition.

Figure 6.13 Dependence of agglomerate number on dimensionless spray flux. After Litster et al. (2001).
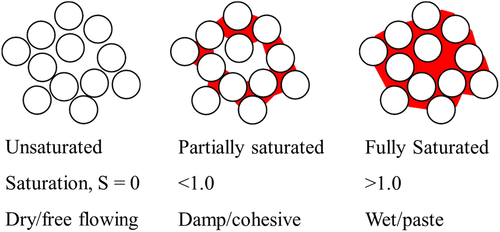
Figure 6.15 shows the consolidation process occurring during agitation and mixing. As mentioned above, consolidation reduces the pore volume and so increases the saturation. It also removes air-filled pores. Visually, very little is seen as the process continues until the surface of the initially-formed agglomerates becomes wet, which may occur quite suddenly. When the surface becomes wet, the initially-formed small agglomerates may aggregate with each other, and rapid size enlargement then occurs. This effect is usually much more marked with fine powders (below about 10 μm), because the initial void fraction of such fine powders in the dry state is usually high (∼0.8), as shown in Fig. 6.16. This makes it difficult to control agglomeration processes for fine powders, and changing the liquid-to-solid ratio around the saturation point can have a rapid effect on growth, as shown in Fig. 6.17. All of these phenomena will be familiar to those who are used to mixing liquids into powders in a domestic setting—in making pastry or mixing cement, for example.
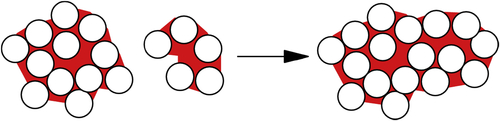
The problem of modeling the outcome of collisions between wet agglomerates (as in Fig. 6.18) has been considered by many researchers, because this is the key to constructing a mathematical model for agglomeration processes. Collision between a particle and a wet surface is considered in Chapter 8. However, the approach developed there applies in the case of elastic particles which show no plastic deformation, so that all of the energy dissipated in collision is taken up in viscous dissipation in the liquid layer. The case shown in Fig. 6.18 is clearly more complex, since energy can be dissipated here in plastic deformation of the agglomerates, accompanied by liquid migration, friction between the constituent particles and possibly breaking of liquid bridges. A different but related approach was therefore developed by Iveson, Litster, and coworkers (Iveson and Litster, 1998; Iveson et al., 2001). They defined a deformation number,


Figure 6.16 Change in porosity of agglomerates during mixing, wet and dry, as a function of initial particle size (Knight, 2004).

Figure 6.17 Change in mean size of agglomerates with time, for two initial particle sizes (large = ∼50 μm; small = ∼5 μm) (Knight, 2004).
![]() (6.13)
(6.13)
where ρ is the agglomerate density, U is a characteristic collision velocity, and Y is a dynamic yield stress for the agglomerates. This approach treats the impacts as fully plastic. They were able to measure Y by a compression method, concluding that it depends on the binder liquid viscosity, the liquid surface tension (with low viscosity binders), and the constituent particle size. As the deformation number is increased, the extent of breakage also increases, until a critical value of De, above which “crumb” is formed instead of granules.
Using these concepts, Iveson et al. (2001) presented a regime map for wet agglomeration processes, as shown in Fig. 6.19. Considering first the limits to behavior, small proportions of added liquid will result in nucleation only, and if the deformation number is large (strong agitation), a free-flowing powder is still seen. At the other extreme, if the proportion of liquid is high (saturation near or above 100%) a paste or slurry results. Between these two extremes, various forms of growth are possible, unless the deformation number exceeds a critical value, in which case agglomerates are destroyed and crumb results. Approaching 100% saturation, growth is very rapid, as discussed earlier.

Figure 6.19 Agglomeration regime diagram (Iveson et al., 2001).
This diagram is clearly approximate in nature and there are difficulties in assigning numerical values to the components of the deformation number. However, it gives a useful conceptual framework for understanding wet agglomeration processes.
..................Content has been hidden....................
You can't read the all page of ebook, please click here login for view all page.