
Creating a Subtotal Report
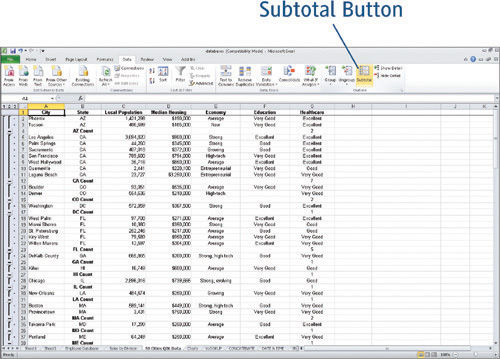
ASIDE FROM PUTTING YOUR LIST in some logical, useful order, what good does sorting do you? Well, it sets your list up to become a Subtotal Report, a handy, informative tool that turns those sorted groups into calculated sections of a report like the one shown in Figure 7-11, based on the sort completed in Figure 7-10, grouping the cities by state and their healthcare rating.
Figure 7-11. Your sorted groups become useful sections of an informative Subtotal Report.
To make this report, you need to have gone through the multiple-field sort steps in the previous section of this chapter, using the Sort command and dialog box. A subtotal report can be made by a single-field sort, but only if the sort creates groups—sorting the cities list by state, for example, or by one of the ratings. Sorting by city, local population, or median housing will not create groups to be subtotaled.
Tip
Creating multiple-field sort with the Sort dialog box is the more effective way to prepare for a Subtotal Report, but it’s not the only way. You can also make your own groups, as discussed in the last sections of this chapter, beginning with “Creating Manual Groups from Sorted Rows.”
The term “Subtotal” is key to understanding what a Subtotal Report is. As shown in Figure 7-11, there are calculations performed on the sort-generated groups, such as counting (for non-numeric fields), or creating a sum or average for numeric fields. The numeric field need not be one you sorted on, however, as shown in Figure 7-12, where the Local Population is averaged by state.

Once you’ve sorted your list—let’s go with the sorting shown in Figure 7-10, at the end of the multiple-field sort process—follow these steps to create your Subtotal Report:
Tip
Don’t select your database or any series of rows within it before beginning this procedure. To do so risks confusing Excel as to the beginning and end of your list. Just click in any cell within the data, and you’re ready to get started.
1. | ||
2. | In the resulting Subtotal dialog box (shown in Figure 7-13), you will begin choosing which fields to subtotal. Figure 7-13. Pick your subtotal fields—typically those you sorted by before starting the report—and decide which calculation to perform.
| |
3. | Click the At Each Change In drop-down menu, and see a list of all your fields, as shown in Figure 7-14. Figure 7-14. Pick the field that represents the first-level grouping within your sorted list. State is the best choice here.
| |
4. | Click the Use Function drop-down menu to choose what calculation you want performed on the field you’ll choose in the Add Subtotals To list (see next step). A wide variety of accounting, statistical, and analytical functions are offered, as shown in Figure 7-15. Figure 7-15. Using the Local Population field, choose Average, to see the average home values in each state.
| |
5. | Pick the field to apply the calculation to. For example, if you’re going to average the housing values in the cities in each state, choose Average from the function list, and click to place a checkmark next to Local Population from the Add Subtotal to list. | |
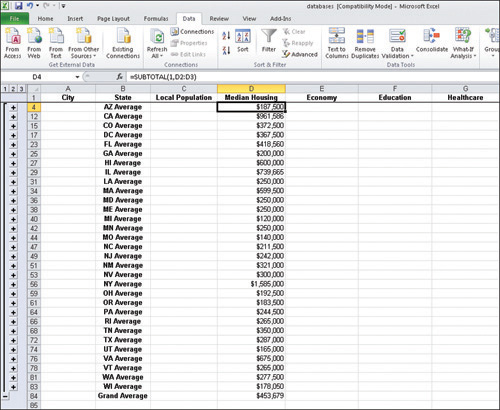
6. | As this is the first subtotal you’re creating, there’s no need to adjust the remaining options in the dialog box (these are discussed in the next section, where you add levels to the initial report). Click OK to create the report, shown in Figure 7-16. Figure 7-16. Subtotal reports are best built one level at a time. Here’s the first subtotal for the Cities list, averaging housing values by state.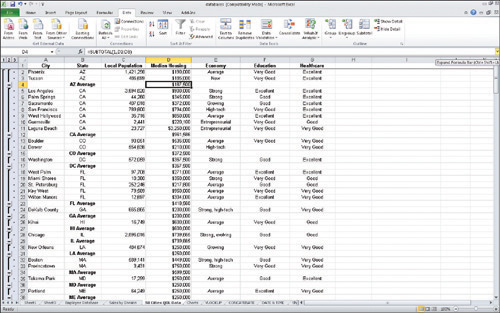
|
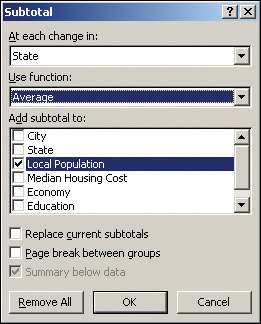
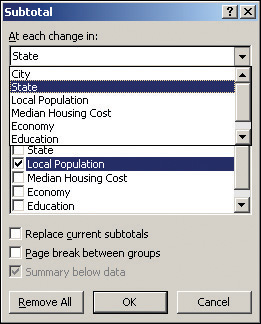
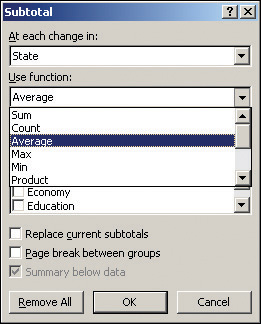
Figure 7-17. Only care about the bottom line? Collapse your report to show just—and only—that.
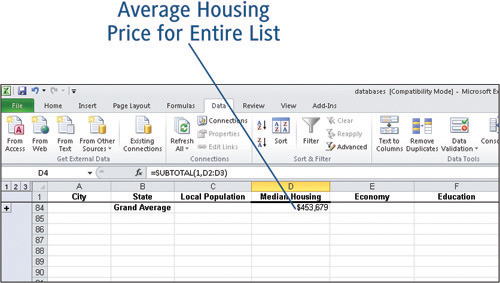
Figure 7-18. Remove the detail, but show more than just the grand total by clicking the 2 button, to show all the groups’ subtotals.
Now, this needn’t be the end of your subtotaling fun. As stated, this is just the first level, and you can add more subtotaled levels to the report. Follow these steps to count the number of cities per state.
1. | With any cell in the list/report active, call up the Subtotal dialog box again by clicking the Subtotal button on the Data tab (Outline group). |
2. | Pick, as needed, a new field that represents a group created by your sort. If, for example, you sorted by both state and healthcare, you could choose healthcare for this second level of sorting. |
3. | |
4. | Pick the field to count. Let’s pick city this time, to count the cities in within each state. |
5. | Remove the checkmark next to Replace Current Subtotals. This will allow your first level subtotaling to remain in the report. |
6. | Click OK. The second level of the report is added to the first, as shown in Figure 7-19. Figure 7-19. Now you have subtotals on two fields—an average of housing prices, and a count of cities with particular healthcare ratings.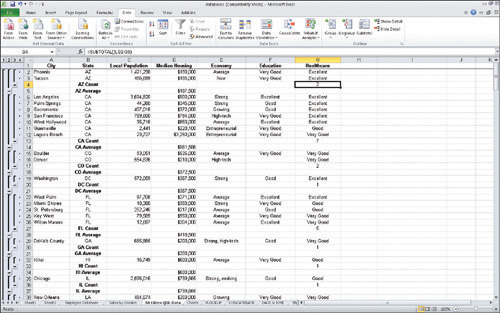
|
Depending on the complexity and depth of your list—the number of fields by which you can group your data, basically—you may want to create Subtotal reports with more than two levels of subtotaling going on. You can continue to add levels, choosing fields and selecting functions, until you achieve the level of detail you’re looking for.
Tip
To remove your subtotal report—taking your list back to its sorted, pre-report state, simply open the Subtotal dialog box and click the Remove All button. The numbered columns on the left are gone, as are the calculations.