
33. Metrics
Growth and profit are a product of how people work together.
—RICARDO SEMLER
Games often require a huge capital investment. Investors who put up resources to finance a game will want to know the odds of getting their money back. One way to attempt to predict this is to create a profit and loss statement, or P&L. The P&L lists all the costs and various projections of the revenues for the project to give investors an idea of the potential profit. This statement usually takes the form of a spreadsheet.
Profit and Loss
Table 33.1 is a spreadsheet for a hypothetical mobile racing game that would have a retail cost of $2. Revenue estimates are based on three scenarios: a worst-case scenario, an average scenario, and a best-case scenario. These numbers are not pulled from thin air. The sales numbers in Table 33.1 were pulled from similar games with similar business models in the genre.
Table 33.1 Basic Profit and Loss

Note
A number of different services used to estimate game sales pop up and close down with regularity. VGChartz estimates retail console sales. SteamSpy helps estimate users of the PC game sales platform Steam. AppData counts daily active users of Facebook games. App Annie is a source for information about mobile games. However, do your own due diligence, because most of these services make only estimates.
Of course, the developer does not see all of the $2 when a user buys the game. In this case, the platform holder will take 30 percent of revenues. At the time of this writing, Apple and Google Play both take 30 percent of revenues for hosting a game on their store. If you plan on publishing on Apple’s App Store or the Google Play store, then you have to agree to pay them to use the platform. Similar costs exist with other platform holders, such as Sony, Microsoft, and Nintendo. Multiplying sales by price and then subtracting the amount paid directly to the platform holder leaves you with the total revenue for the game. In the example, total revenue can range from $7000 to $700,000.
Next, you look at costs. It may be tempting to give a range of possible values for this because these too are future estimates. However, in order to have an easier analysis, you want to have only one independent variable, so keep the costs static across estimates unless the number of units sold greatly affects costs. Additionally, you should run analyses with differing cost estimates.
Staff costs are generally the highest cost for video-game production. A common estimate for the value of a man-month is $10,000. This, of course, varies wildly by role and location and is likely an underestimate. An artist in Romania will likely have a different cost than a tools programmer in Silicon Valley. Nonetheless, $10,000 per man-month is a widely used heuristic. Remember that staff costs include not just salary, but any health benefits, insurance, payroll taxes, seat licenses, and other perks that require the developer to pay on a per-person basis.
Note
A man-month is a measurement of one staff member working for one month.
The example in Table 33.1 estimates a project of 96 man-months. This is a very small project.
Production costs include all the fixed costs of running the studio during the project. The provided example assumes that the studio has no physical office and instead just needs to pay for normal business filing and legal expenses.
Many novice game makers believe that all you have to do to assure financial success is make a “good” game (whatever that is), tell reviewers, and set up some social media accounts. Unfortunately, the odds of stumbling into a financial success seem larger than they actually are because of availability bias. We are able to rattle off the names of games that were done by a small team with little to no resources only to become huge hits, but we are unable to name many from the much larger proportion of games that had the same level of polish and preparation and died on the shelf.
It is naive to think that you can release a game with no marketing budget because hundreds of iOS games are released every day.1 Numerous services claim to be able to boost an app into the high-visibility realm of the top charts, allowing organic growth to drive further purchases. One such service costs $96,000, so I have used that estimate, despite doubts of its current efficacy.2
1 “App Store Metrics.” (n.d.). Retrieved June 25, 2019, from www.pocketgamer.biz/metrics/appstore/submissions.
2 Koetsier, J. (2013, June 4). “How $96,000 Can Buy You a Top 10 Ranking in the U.S. App Store.” Retrieved June 25, 2019, from http://venturebeat.com/2013/06/04/how-96000-can-buy-you-a-top-10-ranking-in-the-u-s-app-store.
Various services can help you estimate the cost of user acquisition. Fiksu in February 2015 estimated the cost of acquiring users who open an app three or more times to be $2.80 per user.3 When factoring out the loyalty of users, Fiksu estimated that the cost of acquiring a user was $1.28 on iOS and $1.51 on Android. Research firm SuperData estimated the cost of an iOS user to be $2.30.4 If the number of games released per player willing to pay for them continues to rise at such a high rate, expect the cost of user acquisition to continue to rise.
3 Fiksu Resources. (n.d.). Retrieved June 25, 2019, from www.fiksu.com/resources/fiksu-indexes.
4 “Brace Yourself for the Mobile User Acquisition Bloodbath This Holiday Season.” (2013, November 25). Retrieved June 25, 2019, from www.superdataresearch.com/blog/user-acquisition-bloodbath.
In the example, costs sum to $1,060,000. Even in the best-case scenario, the game generates a loss.
Metrics
Games that exist as a service rather than as a boxed copy have the ability to change on the fly through live updating via the internet. This connectivity allows designers to better understand how real players are using their game in the wild to better educate themselves on what design decisions to make. Metrics are measurements of real player behavior generated by the game and analyzed by the designers. Metrics can measure any behavior of interest. Particularly useful metrics are often referred to as KPIs, or key performance indicators.
Metrics can be broken down into four types depending on what they help to measure. Acquisition metrics help you understand what brings players to your game. Engagement metrics help you understand what happens while players are in your game. Retention metrics help you understand when and how players leave your game. Monetization metrics help you understand how players spend money in games with microtransactions.
Acquisition
If a game cannot make more money from a user (on average) than it costs to acquire that user, then the project will lose money as it gains users. Some social and online games try to escape the costs of user acquisition by increasing the virality of their game. Virality is accurately named because it’s a measure of how well a game spreads to new users and because this term brings with it the connotation of sickness and disease. Early measures of virality were based on how FarmVille used its players’ Facebook feeds to spam messages about lonely cows. New players who had not heard of FarmVille clicked into the game to see what this new thing was that was clogging up their news feeds. Due to the copycat nature of social game development, others quickly followed, and Facebook had to change its rules for how messages were automatically generated and shared on players’ news feeds.
Virality is simply a factor of how many new users each user brings in. One formula for virality (k) is written as follows:
k = i * c
The virality factor is k. The number of invitations each user sends is i. The conversion rate of those invitations into new players is c. If k > 1, then the game is growing by depending completely on users spreading the game on their own. For example, if the average user sends 100 FarmVille invites to his feed and 3 percent of those invites turn into actual players, then k is 3. The first player (patient zero) sends out 100 invites and three of them turn into new players. Those three players send out 100 invites each and they recruit, in total, nine new players. Those nine players send 900 invites and recruit 27 new players. And so on.
Obviously, this cannot continue forever. More accurate measurements of virality are much more complicated and take into account the time it takes to complete a cycle of invitations, the effect of multiple cycles of invitations, and the rate at which players disappear.
It used to be a common technique for a studio to buy its way into the top sales charts by spending large amounts on early customer acquisition. The idea was to spend a lot of money early, and then rely on a k > 1 to acquire users over time.
This technique is no longer popular because it’s not as foolproof as it once was considered to be. k is determined in retrospect and is constantly evolving. In theory, a game or app with k > 1 should do nothing but try to ensure continued virality and rake in additional users. Unfortunately for modern designers, they cannot use epidemiological models and call it a day. Game designers still need to consider design, community, marketing, and economics in order to succeed. Virality is a side effect, not a component, of effective game design.
Engagement
Many analytics packages for digital games are available that allow teams to better understand the behavior of players. Often, the software provides what are called “hooks” to the analytics package that can be inserted into code to send data to the analytics software. Teams can then use that data to answer questions about their game.
Designers have a wide range of data sources for measuring engagement, since nearly every mechanic in a game can be measured for use. Often, this is looked at at a higher level, measuring the number of play sessions a user engages in, the average number of play sessions per user, and the length of the sessions themselves.
Economies can be extremely difficult to affect, and so with dynamic systems, basing decisions on data is much more important than simply using gut feel.
When developing Sudoku Together, the team at Sky Parlor Studios was interested in knowing whether the coins that players collect in the games are spent or hoarded. If the coins were hoarded, then it might mean that players did not see anything in the store worth buying. Or it might mean that they were saving up for something expensive. If the coins were spent, then it might mean that the cheap items were too inexpensive or that players did not believe they could ever afford the expensive items. Nonetheless, they had nowhere to start without collecting data.
Figure 33.1 is a chart generated by the analytics package Swrve. It shows on a day-to-day basis how many coins were given to players and how many were spent. The area between the curves shows how much was hoarded that day. If players did not spend the coins, the spend line would be fairly flat. If this continued to increase over time, the team would know there was some kind of problem. However, the data showed fairly normal usage. When the amount of coins given spiked, so too did the amount of coins spent, indicating that users would likely spend coins as they were received right away rather than saving them. These conclusions warranted the collection of other data, but decisions were based on this data rather than on gut feelings or sampled interviews.
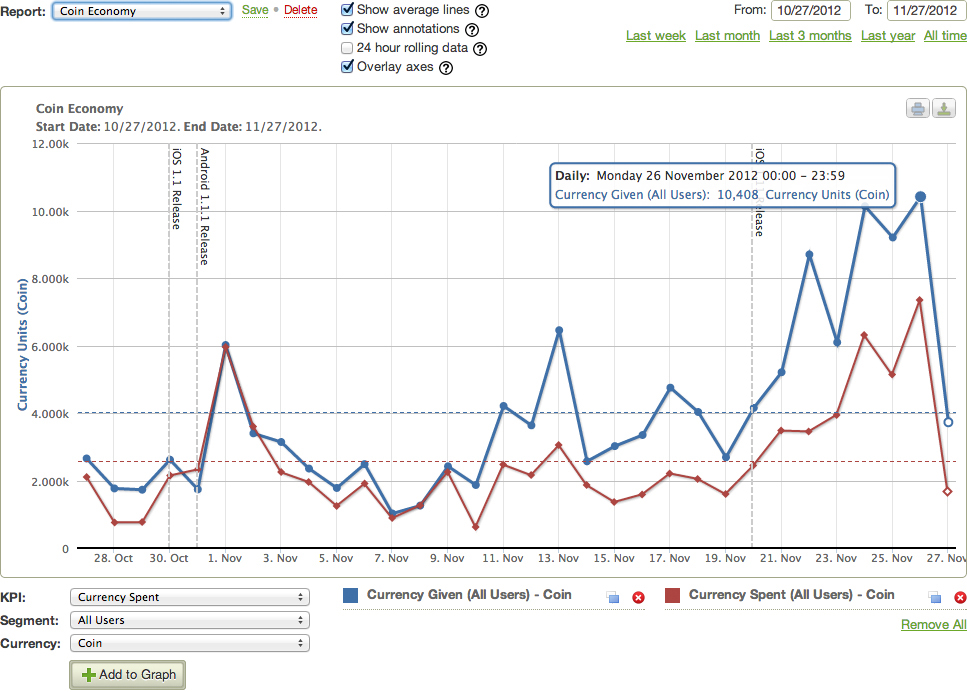
Figure 33.1 This Swrve output shows metrics of an in-game economy.
It is important to understand how players use the systems of your game. In the MMO Gaia Online, players could generate from a bunch of basic activities gold with which they could buy in-game items. These items were limited by the game and prices were bid by users. Prices over time fluctuated based on the size of the player base. The player base peaked in 2010, and one in-game item, the Emo Bag, had an in-game price of 700,000. When the player base receded, the price of the Emo Bag dropped to 590,000 in 2011 and 310,000 in 2012, as would be expected with fewer players bidding for the resource.
In August 2013, the game’s developers added an item that could be bought for real money: Flynn’s Booty. This item generated in-game gold for players and was very popular, so the amount of gold in the economy spiked up, but the number of goods that gold could be spent on remained constant. Basic economics teaches us that limited supply with increased demand causes prices to rise. In just a month, the price of the Emo Bag rose to 600,000. A month later, it was 900,000.
To keep up with the spiking prices, the developers increased the amount of gold that items like Flynn’s Booty could generate, which only fed back into the problem. By March 2014, the price of the Emo Bag was 40,000,000. By August 2014, the price of the Emo Bag was 11,000,000,000.
The developers tried to stem the inflation increasing the sinks of the currency via marketplace taxes and large gold sink events, but to no avail.
Like Gaia Online’s hyperinflation, deflation is also bad for an economy. Consider the market for solar panels. Panels continue to get cheaper and cheaper. If I know solar panels will be 20 percent cheaper if I wait a year, then why make the investment now? I’d only do so if every other investment I could make would do worse than losing 20 percent. Keeping my money in a mattress would be a better investment than anything that would lose real purchasing power.
While large inflation can be bad and negative inflation can be bad, zero inflation can be bad as well. If the inflation rate were zero, I could hold onto my money forever and it would be guaranteed to hold its value. A small positive inflation forces me to get rid of my slowly devaluing cash, exchanging it for goods and services that make for a functioning economy.
Understanding where and how money is generated, spent, and lost is important to keeping a game’s economy of resources functional. Imagine a candy bar that goes from $1 now to $50,000 next year and what impact that would have on every transaction tangential to it.
Retention
Retention measures how many players “stick around.” For a given time period, a game’s retention is the percentage of users who started that time period and who remain players at the end of the time period. Take a long tutorial for example. It has 11 steps: Users select a name for their character, then a race, then a class/job, such as warrior or wizard. They learn how to fight, how to cast spells, and the differences between realms. Then they are asked to send invites to their friends. After that, they learn about crafting, read and sign the EULA, and sign up for the email newsletter—and then finally they begin the game. Let’s say 10,000 users start the process and, through metric collection, the number of users is counted at every step, as reflected in Figure 33.2.
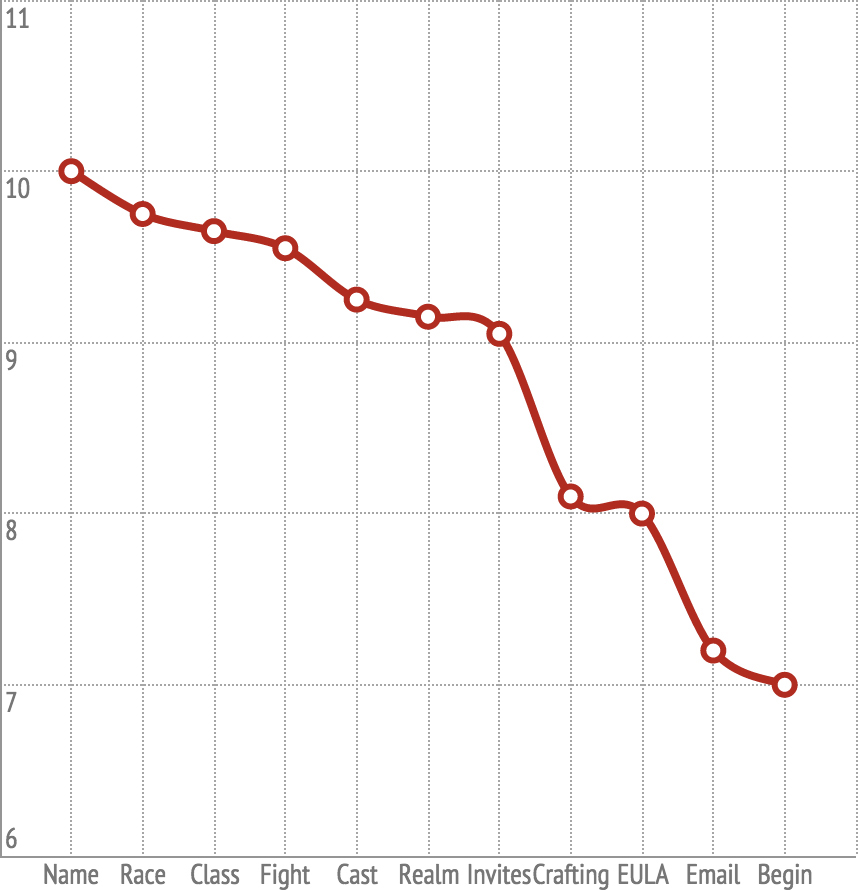
Figure 33.2 Retention over a tutorial’s steps.
Approximately 7000 of the original 10,000 users make it to the end of the process. Overall, the tutorial process has a retention rate of 70 percent. But if we look at each step in isolation, the retention for each step can be determined. You divide the number of users in step n+1 by the number of users in step n to get the retention from step n to step n+1.
In Figure 33.3, the view of retention by step shows a huge dip in retention during the invitation step and the EULA step, with smaller dips in the naming and fighting steps. Using this information, the team can come up with ideas to make these steps more palatable. Something is causing users to abandon the game at the points where the retention rate dips.
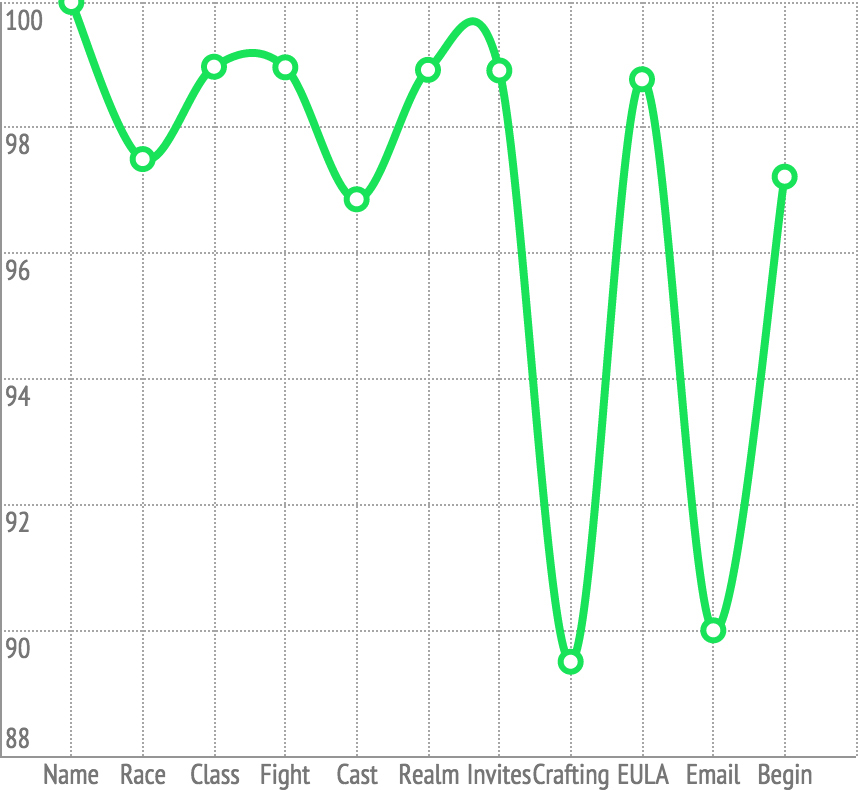
Figure 33.3 Retention rate by step.
Retention generally dips fairly regularly over time as users get satiated with a game and drop off. However, any sudden dips are usually the result of a bad experience for the player. Sometimes those bad experiences are necessary, such as losing a first battle against a difficult boss. Sometimes these bad experiences are the result of confusing text or unnecessary mechanics. By collecting this information, the design team can better understand what works and does not work with players. Players who do not stick around are not likely to give you any money.
Another popularly used term is churn. Churn is simply the opposite of retention. Where retention measures how many users stay over a given period of time, churn measures how many users give up over a given period of time. If retention is 70 percent, then churn is 30 percent.
Users are often measured over two spans of time: monthly and daily. Monthly active users, or MAU, are those who sign in to the game at any time during a given month. Daily active users (DAU) are those who sign in on any given day. Looking at the ratio between these values tells a story about player retention. If tons of players show up on day 1 and get bored and leave before day 30, then dividing the DAU/MAU on day 30 will result in a low number. For instance, say I had 100,000 users over the month, but only 1000 remained by day 30; my DAU/MAU would be 1 percent. A perfect game where players never leave would have a MAU/DAU of 100 percent because every player in the MAU would be represented in the DAU. DAU/MAU is an imprecise measurement because there is no way to retroactively count a new user in the MAU and there is no way to flag a MAU as having quit the game for good.
Monetization
The advent of the free-to-play (F2P) business model has ushered in some new terminology useful for making estimates on these kinds of games. First, a user for a free-to-play game may spend no money or may spend a lot of money, so you cannot use users as a way to estimate revenue as you could with a fixed-price game.
The conversion rate is the percentage of players who spend money in a game. If a game has 100,000 users and 97,000 users never spend any money at all, then the game’s conversion rate is 3 percent. Various sources indicate that a 1 percent to 5 percent conversion rate is reasonable.5 A free-to-play game can still be successful even if there are 99 freeloaders for every paying customer.
5 Purchese, R. (2014, April 22). “Don’t Be Surprised That Just 2.2% of F2P Players Spend Money.” Retrieved June 25, 2019, from www.eurogamer.net/articles/2014-04-22-dont-be-surprised-that-just-2-2-per-cent-of-f2p-players-spend-money.
The conversion rate tells you how many players have paid, but it does not break down how much they paid. ARPPU is an acronym for “average revenue per paying user.” It’s the average amount that each converted player has paid. You can calculate this by taking total revenue and dividing it by the number of paying players. ARPU is another commonly used (and confused) metric that divides total revenue by total players to get an “average revenue per user” (Table 33.2).
Table 33.2 Calculating Revenue

Naturally, you will not know your total revenue because that is what you are trying to estimate. However, you can estimate the ARPPU by giving an honest guess as to what the average player will spend money on within the game.
Note that paying users do not spend equal amounts. The derogatory terminology that the industry uses for high-paying players is “whales.” I’ll use that term here for familiarity despite its obvious distastefulness.
Spending in F2P games is Pareto-distributed, which means that a small percentage of the players spend a large amount of the total revenue in the game. One report from analytics firm Swrve found that only 1.5 percent of users converted into paying customers and that the average spend per month was $15.27 (ARPPU). However, only the top 0.45 percent of players ever paid more than the average. The top decile of paying users (1 in approximately 700 users) paid an average of $77.70 and resulted in over 50 percent of the average game’s total revenue. These are the “whales.”
I recommend the following shot in the dark as a reasonable model for estimating F2P sales. It models the general shape of F2P spending, but the reality will necessarily be different as project and market changes shift behaviors. Let X be some small amount of user spending for the platform, like $2 or $3:
• Top Spenders: 0.2% of users, $20X/user
• Medium Spenders: 0.5% of users, $5X/user
• Low Spenders: 0.7% of users, $X/user
• Non-Spenders: 98.6% of users, $0/user
Cash Flow
As games become active services, the game business has to deal more and more with the problem of cash flow. Cash flow is the liquidity of a business, or more specifically in this setting, the ability of a business to pay its employees. Cash flow issues have caused many game studios to close their doors.
Cash flow is a simple concept. Take the cash on hand. Add to it any cash coming in and subtract any cash going out.
Here is an example. Say a team has released a game through a publisher. That publisher promises to pay out revenues within 60 days (January revenues are paid in March; February revenues are paid in April). This 60-day gap is common in royalty payments and is sometimes as long as 90 or 120 days.
The game takes off better than expected and the team has to continually buy more and more servers to handle the increased player loads. The company has to spend $100,000 a month on their staff. Every 100,000 users requires them to buy increased server space and spend on other overhead, which costs them an additional $1 per user. The users pay, on average, $2 per user each month after the publisher’s cut. The first month the game launches with 100,000 users and doubles every month thereafter. The company starts off with a nice cushion of $2 million in cash.
On the surface, this looks like a reasonably profitable game. Players pay $2/user/month. The costs are $1 per user for server costs and then $100,000 split over the number of users. Since the first month starts with 100,000 users, the team should break even the first month and then grow from there, making $100,000 in February and $300,000 in March (Table 33.3).
Table 33.3 Good-looking P&L

Now consider the game from a cash flow perspective. The team starts out with $2 million in January. The team has to pay out the costs for their staff and the ever-increasing server costs as they scale up, yet the team does not get the payoff for that increase for two months. You might think that it should be okay since the game is profitable and the team has $2 million in the bank. However, take a look at Table 33.4.
Table 33.4 Cash Flow Crisis

In just five months, the team’s cash cushion is exhausted. They will have to find a way to finance more money or they simply will not make payroll. Even though the game is growing and the business model is profitable, the company faces insolvency. This is the danger of ignoring cash flow.
Summary
• Develop profit and loss statements based on a range of different estimates for uncertain values.
• Games now use a variety of metrics to inform designers how to change a game while it is live.
• In free-to-play games, the majority of the money is generally spent by a small proportion of the total players.
• By measuring the number of players who reach a specific step in a game’s progression, a game team can identify what steps or features are hampering retention.
• Do not ignore cash flow. When you get paid can be as important as how much you get paid.