
Think about a time when you were in the audience at a presentation and the graphics didn’t work. What was the problem? These are the most common answers my business clients give:
“The graphics were cluttered.”
“There was too much on the slide.”
“The slide looked like an eye chart.”
“The slide was a Data Dump.”
Now flip the lens and take the point of view of an Audience Advocate. What’s the effect on you? Odds are that it’s another case of the dreaded MEGO syndrome: the same cause and effect as when a story is unloaded on you as a Data Dump.
The main reason this happens is that presenters fail to distinguish between a document and a presentation. They treat a presentation as a document. This is the Presentation-as-Document Syndrome, in which the presenter uses the graphics as both a display and as a record, as both show and tell. As you read in the Foreword, this is the vestigial legacy of the ancient origins of presentations, the flip chart.
Annual reports, filled with dense text and highly detailed tables, charts, and graphs
Strategic plans, filled with dense text and highly detailed tables, charts, and graphs
Market analyses, filled with dense text and highly detailed tables, charts, and graphs
Meeting notes, filled with dense text and highly detailed tables, charts, and graphs
See the pattern? All these types of documents are necessary and important in their place, but business documents are not presentations.
So the true problem with presentation graphics is that, all too often, presenters take a flood of data, those dense text and highly detailed tables, charts, and graphs, and simply reproduce them, with little or no modification, for their presentation graphics.
This Presentation-as-Document Syndrome represents one of the most common problems that plagues presentations. Presenters have become so accustomed to relying on graphics, especially Microsoft PowerPoint slides, that they often think of the presentation as a mere accompaniment to those aids. In fact, many people act as if the presentation is completely dispensable. They’ll say, “I can’t attend your presentation next week. But it doesn’t matter. Just send me your slides!” Or they sometimes say, “Send me your slides in advance.” The PowerPoint slides then are treated as handouts.
What’s more, presenters frequently provide the handouts to their audience before the presentation. The audience then reads the handout, sees the slide, and hears the presenter read what is on the slide. This is known as “triple delivery,” an assault on the audience’s senses that leads to that lethal MEGO. Using slides as handouts is but one manifestation of the Presentation-as-Document Syndrome. There are three others.
Use the slides as notes to help the presenter remember what to say.
Cram a plethora of details on the slides, as if to demonstrate legitimacy.
Fill the slides with enough information so that anyone else in the company using the same slides will maintain the uniformity of the message.
But the name of my company is not:
It is Power Presentations.
A presentation is a pure play. It must serve only one purpose. Remember the words of Dan Warmenhoven, the CEO of Network Appliance, in the Opening Gambit of his IPO road show: “Do one thing and one thing well.” If a presentation tries to serve two or more purposes, it dilutes both purposes. The presentation itself is neither fish nor fowl.
A presentation is a presentation and only a presentation . . . never a document. After all, Microsoft provides Word for documents and PowerPoint for presentations. And never the twain shall meet.
If you do need a document of your presentation, Microsoft PowerPoint provides the Notes Page view, as represented in Figure 6.1. The top of the Notes Page contains only what your audience sees projected on the screen. The bottom provides the additional material for the handouts.
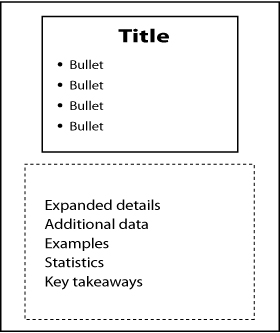
Be sure to distribute the handouts only after the presentation. If you distribute them before or during the presentation, your audience members will flip through them as you speak, and they won’t listen to what you have to say.
If you’re asked to provide a copy of your presentation for a conference so that the slides can be printed in book form, use PowerPoint’s Notes Page view. That way, you’ll maintain the integrity of your slides as purely presentation material.
If you’re asked to provide a copy of the presentation in advance, as so often happens, especially in the venture capital and financial sector, politely offer to provide a business plan or executive summary . . . as a document. And create that document with Microsoft Word, not PowerPoint.
An extension of the Presentation-as-Document Syndrome is what happens to the audience when the screen lights up with a slide filled with dense text and highly detailed tables, charts, and graphs. The focus of the audience immediately, and involuntarily, goes to the graphics, and they start to read. When they start reading, they stop listening. The graphics then become the center of attention, and the presenter becomes subordinate to the slide show, serving, at best, as a voice-over narrator and, at worst, as a ventriloquist.
This problem is compounded as the presenter becomes a reader, too. The reading often fails to rise above the level of a verbatim recitation. Reciting the slides verbatim is patronizing to the audience. They think to themselves: “I’m not a child! I can read it myself!” The results are a failure to connect, a failure to communicate, and, most likely, a failure to persuade.
An even worse variant is when the presenter rambles, talking about subjects that have nothing to do with the slide. This disparity jams the audience’s eyes and ears, producing confusion and annoyance. It’s like crossing a DVD player’s video and audio cables, producing a scrambled image and static.
How, then, should you approach effective slide design? View graphics the way my clients at Microsoft view them. The Executive Presentations Team is the specialized unit at Microsoft charged with producing the slides and graphics necessary to support the senior executives at major presentation events for the company. It was formerly headed by Jon Bromberg, an alumnus of the New York theater world. After 11 years with Microsoft, Jon has now retired, but during his tenure he was the director of events, in charge of a huge operation with state-of-the-art production and graphics capabilities.
Despite all those technical bells and whistles, the Executive Presentations Team refers to PowerPoint, Microsoft’s own product, as speaker support. The slides or other graphics are there to support the presenter, not the other way around.
This is the very same model that we see every evening on the television news broadcasts. We see the anchor: Charles Gibson, Brian Williams, or Anderson Cooper, giving us information they interpret for us. Yes, they use graphics, but their graphics play a supporting role. The images often consist of little more than a simple picture and a word or two to headline the story that the anchor is presenting: a photograph of the Capitol building and the words “Tax Proposal,” or a picture of a medicine bottle and the words “Prescription Drugs.” Gibson, Williams, or Cooper is always center stage.
It so happens that my cousin, Joel Goldberg, has worked for more than 25 years as a graphic artist at ABC News. Using elaborate electronic tools, Joel often spends an hour getting the appearance of a single image or word exactly right, with highlights, tints, dimension, shadowing, and other tricks of his trade. That image or word may appear on the screen behind Charles Gibson for just a few seconds before vanishing forever. While I’m sure that Joel is paid well for his talents, it is Charles Gibson who pulls down a much larger salary for the gravitas he brings to the news.
This Presenter Focus/Graphics Support relationship is the only effective model for a presentation. The presentation cannot serve as a document unless it is complete in itself, in which case the audience wouldn’t need the presenter. They could sit in silence and read the slides to themselves. On the other hand, if the graphics constitute a partial document, they cannot stand alone, and they serve only to distract attention from the presenter.
Instead, when the presenter interprets for the audience and the graphics provide support, the presenter can lead the audience to a conclusion. When this happens, the presenter manages the audience’s minds, creating the subliminal takeaway: Effective Management.
The audience also takes away a visual reinforcement of the presenter’s message. As an ancient Chinese proverb tells us:
I hear and I forget;
I see and I remember;
I do and I understand.
To make all these things happen, we need a guiding principle. That principle is Less Is More. These words have been attributed to one of the foremost architects and designers of the 20th century, Ludwig Mies van der Rohe (1886–1969), the father of the minimalist school. Mies directed the influential Bauhaus School of Design in Germany in the 1930s and then came to the United States, where he designed such sleek, classic structures as the bronze-and-glass Seagram Building in New York City.
Mies’ famous Less Is More dictum became the guiding principle for many of the greatest designers of the past hundred years. Less Is More should be your guiding principle when you are creating your presentation graphics.
It is mine. It is mine after years of working in television, with access to the vast capabilities of professional graphic artists like my cousin Joel, who operate in multimillion-dollar electronic control rooms known as “paint boxes.” It is mine after 20 years of working with evolving generations of computer-based graphics programs, culminating in the latest version of Microsoft’s PowerPoint, whose capabilities approach those of the professional paint boxes. These powerful tools notwithstanding, when designing graphics, I rely on the wisdom of Less Is More, and its corollary, When in doubt, leave it out.
An important benefit of a slide designed with this minimalist approach is that it serves as an instant prompt for the presenter: a visual mnemonic.
In addition to Presenter Focus and Less Is More, the two essential concepts for powerful graphics design, there is a third vital element in the equation: the audience and how they take in what they see. This is Perception Psychology.
Let’s begin by analyzing how the human eye moves.
You’re familiar with the illuminated initial letter that appears in fine manuscripts or in handsomely printed books. It always appears in the upper-left corner of the page, where a new book or a new chapter begins. Magazines and newspapers also often use an enlarged initial letter to start articles. That’s because in Western culture, countries like the U.S., France, Spain, Italy, and Germany, languages are always printed from left to right and top to bottom. As a result, a Western reader’s eyes are conditioned to move to the upper-left corner to start a new passage.
This movement is not innate; it is culturally determined and learned. In the Middle East, books begin at the back and are read from right to left. Therefore, the eyes of those readers are conditioned to begin at the upper-right corner of a page.
Think of this tendency for our eyes to jump to the upper-left corner of a page as the conditioned carriage return, since the movement recalls the repeated movement of the carriage on an old-fashioned typewriter.
When people read print in a book, magazine, or newspaper, their eyes make the conditioned carriage return with every new page. In a presentation, this movement occurs with every new slide.
There is one major difference, however. When your eyes shuttle across a page in a book or magazine, they move only five to eight inches at a time. In a presentation, when they have to leap across a large screen in a conference room or auditorium, they move anywhere from two feet to 20 feet, depending on the size of the screen.
Therefore, every time you click to a new graphic on the screen, your audience’s eyes are driven by two powerful and contradictory forces: First, because of a lifetime of conditioning, they jump to the upper-left corner. Then their eyes suddenly become aware that there is more information on the screen, and so now their eyes must make another move to take in the rest of the information. This next move is more powerful than the first. Their eyes sweep to the right in a completely involuntary action. This is the reflexive cross sweep, illustrated in Figure 6.2.
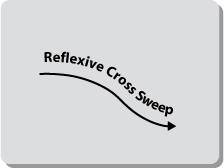
Unlike the learned move of the conditioned carriage return, the left-to-right movement of the reflexive cross sweep is involuntary. Sometimes the move is down and to the right, and sometimes it is up and to the right. Most painters organize their pictures based on eye movement down and to the right. That is why, more often than not, artists sign their canvases in the lower-right corner.
Businesspeople also intuitively follow the reflexive move to the right. But they are also accustomed to taking the high road, following the desired growth pattern of revenue and profits symbolized by the hockey stick (see Figure 6.3).

Whether up and to the right (as in business) or down and to the right (as in art), this involuntary left-to-right movement is deeply embedded in our nature.
No one has ever fully explained why these reflexive movements occur. In his 1954 book, Art and Visual Perception: A Psychology of the Creative Eye, Rudolf Arnheim, a Gestalt psychologist and a scholar of art and cinema, offered several theories, ranging from the plausible to the fanciful. The plausible: Because the majority of humans are right-handed, there is a natural tendency toward greater awareness of objects on the right side of the visual field. The fanciful: Early homo sapiens were so impressed by the movement of the sun from left to right that they favored this form of movement
All these theories notwithstanding, the innate predisposition of the human eye to move from left to right is irresistible. You can feel it yourself as you scan this very page or any of the illustrations in this book.
Television and cinema directors incorporate this preference in how they direct their subjects and cameras. Next time you watch a well-directed movie or television drama, notice how the characters move across the screen. Most often, the sympathetic characters, the heroes and heroines with whom the audience identifies, move from the left side of the screen toward the right, flowing with the natural movement of the eye. By contrast, the unsympathetic characters, the villains whom the audience dislikes, move from right to left, fighting the eye’s natural flow.
Even when the characters are stationary, the movement of the camera can convey the same feelings: A pan right is smooth; a pan left drags. Very subtly, these differences fuel the audience’s emotional reaction to the drama, helping them to think and feel the way the actors, director, and writer intended.
Director Sam Mendes used these techniques to powerful effect in the Tom Hanks/Paul Newman film, The Road to Perdition. In the opening scene, we see a city street in the Depression era crowded with pedestrians, most of them moving from left to right. Then a young boy on a bicycle enters, pedaling from right to left, against the grain. The boy is Tom Hanks’ son, whose difficulties form the central part of the story. From the outset, these powerful cinematic dynamics set the foreboding tone for the rest of the film.
In the theatre, directors incorporate the same approach with actors on the stage: protagonists move toward the right, and antagonists move toward the left.
It all goes back to how we first learned to absorb information as children: reading text. By understanding Perception Psychology and applying it properly, you can control the effect of your graphics on your audience. And in presentations, you want that effect to be positive.
By understanding Perception Psychology and applying it properly, you can control the effect of your graphics on your audience.
In a presentation, when a new image flashes on the screen, your audience’s eyes will make two instant moves: one to the left to start the slide (the conditioned carriage return), and one to the right to take in all the information (the reflexive cross sweep). The move to the right will either up or down.
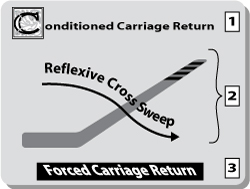
However, if, in the design of your graphics, you’ve put excess data on the screen, your audience cannot take in the entire image in two moves. They’re forced to make another move, and perhaps more than one. This third move, along with any subsequent moves they must make, will be hard work, backwards and against the grain. This third trip, back and to the left, is a forced carriage return. You can see all three moves in Figure 6.4.
This again leads us to one of the most important practical applications of the Less Is More dictum: Don’t make me think! That refrain asks you not to make your audience work to understand your ideas. The same refrain applies to the work your audience must do to absorb your graphics. Therefore, design all your slides to Minimize the Eye Sweeps of your audience. For every graphic, keep the number of times their eyes must go back and forth across the screen to an absolute minimum. Make it easy for your audience, and they will make it easy for you. Think of the alternative!
Thus, the overarching principles of powerful and effective graphics are
Presenter Focus
Less Is More
Minimize Eye Sweeps
Keep these principles uppermost in your mind and apply them to all your graphic design elements.
All the bells and whistles in all the graphics programs available for business presentations boil down to just four basic design elements:
|
|
• |
Pictorial. Photographs, sketches, maps, icons, logos, screen shots, or clip art. |
|
|
• |
Relational. Tables, matrices, hierarchies, and organizational charts. (Think of a relational chart as an image that captures a set of relationships, connections, or links in visual form.) |
|
|
• |
Text. Text comes in two flavors: bullets and sentences. |
|
|
• |
Numeric. Numbers expressed in bar charts, pie charts, area charts, line charts, histograms, and other, more specialized types of graphs. |


When you choose either a pictorial or a relational graphic, you achieve Less Is More by default. A picture is worth a thousand words. And a table or chart, by definition, organizes multiple diverse elements, turning more into less. So both pictorial and relational graphics promptly fulfill Mies van der Rohe’s principle.
However, much business information can’t be captured in a picture or a table. As a result, most presentations bulk up with text and numeric graphics. This is where the trouble begins. In the first place, presenters end up using more, not less, on the screen, thereby losing effectiveness. What’s worse, they fall prey to the Presentation-as-Document Syndrome.
A presentation is a presentation and only a presentation. The primary role of graphics is to support the presenter and to give the presenter the opportunity to add value above and beyond what is projected on the screen.
Graphics also help the audience remember your content. Remember the Chinese proverb: “I see and I remember.”
In the next chapter, you’ll learn how to create effective text graphics; and in the one after that, you’ll learn how to create effective numeric graphics. The emphasis in both of these chapters will be on how to achieve Less Is More, thereby conveying your visual information in a clear, crisp, and powerful form.