
40. The Graphics Spectrum
Lives of Quiet Desperation
In 1845, the American author, philosopher, and naturalist Henry David Thoreau felt the need to get away from it all. He sequestered himself at an idyllic lake in the Berkshire Mountains for two years and wrote Walden; Or, Life in the Woods in which he famously observed, “The mass of men lead lives of quiet desperation.”1
Mr. Thoreau’s words are applicable to businesspeople today who lead lives of not-so-quiet desperation every time they have to make a presentation. Of all the many reasons for their desperation—time pressure, workload, and the fear of failure—perhaps the most pressing of all is the self-imposed practice of using their PowerPoint slides as not only the presentation graphics, but also as speaker notes, send-aheads, and leave-behinds. This multitasking approach produces images of exhaustive detail that serve none of the functions.
This bane of presenters has become a boon for another constituency: professional designers and authors who offer solutions to help businesspeople create simple, expressive, and purely illustrative graphical images. The best of the breed is Garr Reynold’s marvelous book, Presentation Zen, which offers readers design concepts based on the principles of Japanese minimalism.
These polar opposites of the graphics spectrum leave a large underserved area in the middle consisting of presenters who want to break away from those exhaustive slides but find Mr. Reynold’s Zen ideal too far a reach for them. At one end of the spectrum, some presenters protest, “But I’m not an artist!” (More about that in Chapter 43.) At the other end, others protest, “We don’t have the time to do that!”
For that large majority, here is a simple set of guidelines for the two most basic types of garden variety graphics used in presentations today: bullet slides, as in Figure 40.1, and bar charts, in Figure 40.2.
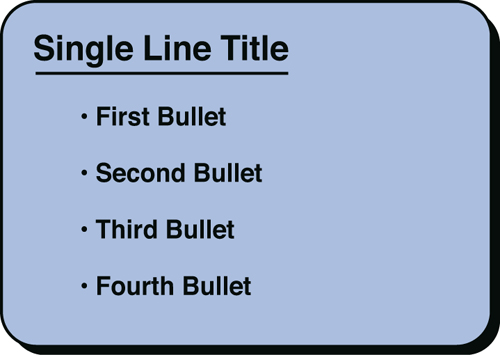
Figure 40.1. Effective bullet slide
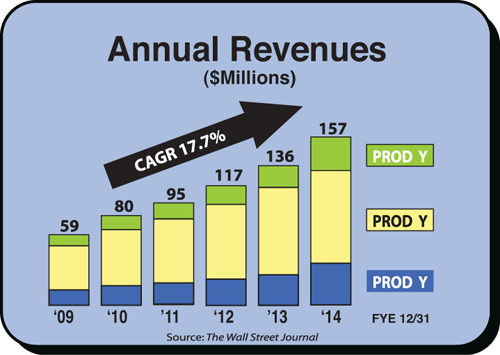
Figure 40.2. Effective bar chart
The guiding principles of this simple but effective bullet slide can be summarized in four bullets:
• Consider every line as a headline and not a sentence.
• Avoid word wrap by restricting every item to one line.
• Start each line with the same grammatical part of speech: verbs, nouns, and modifiers, etc.
• Keep all the elements related, creating pattern recognition.
The guiding principles of this simple but effective bar chart can be summarized in four bullets:
• Omit the Y-axis and place the numbers directly on the bars.
• Represent the legend in legible font size.
• Use large, color-coded labels.
• Make it easy for your audience by minimizing their search.
Or to paraphrase the last bullet in terms that Mr. Thoreau would appreciate, help your audience to lead lives free of desperation.