
WHAT'S IN THIS CHAPTER?
Debugging an application is one of the more challenging tasks developers have to tackle, but correct use of the Visual Studio 2010 debugging windows will help you analyze the state of the application and determine the cause of any bugs. This chapter examines the numerous windows available in Visual Studio 2010 to support you in building and debugging applications.
The most important window for debugging purposes is the code window. With the capability to set breakpoints and step through code, this window is the starting point for almost all debugging activities. Figure 39-1 shows a simple snippet of code with both a breakpoint and the current execution point visible.
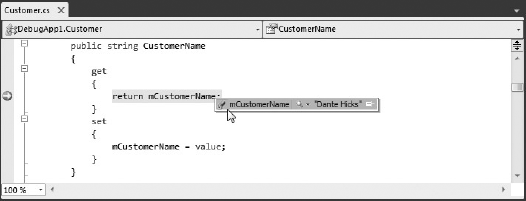
The first stage in debugging an application is usually to identify the area that is causing the error by setting a breakpoint and gradually stepping through the code. Setting breakpoints and working with the current execution point are covered in more detail in the next chapter. Although you can't see the color in Figure 39-1, breakpoints are marked in the code window with a red dot in the margin of the page and red highlighting of the code itself.
When a breakpoint is encountered, the current execution point is marked with a yellow arrow in the margin and the actual code is also highlighted in yellow. As discussed in the next chapter, this marker can be dragged forward and backward to control the order of execution. However, this should be done sparingly because it modifies the behavior of the application.
After hitting a breakpoint, the application is paused, or is in Break mode. In this mode, you can retrieve information about current variables simply by hovering your mouse over the variable name. Figure 39-1 shows that the value of the mCustomerName variable is currently "Dante Hicks." This debugging tooltip is commonly referred to as a Data Tip, and can be used to view not only the values of simple types, such as strings and integers, but also to drill down and inspect more complex object types, such as those made up of multiple nested classes.
In Chapter 41 you learn how the layout of this DataTip can be customized using type proxies and type visualizers.
When debugging a complex issue, it is possible to set numerous breakpoints to isolate the problem. Unfortunately, this has two side effects. One, the execution of the application is hampered, because you have to continually press F5 to resume execution. Two, and more significantly, the execution of the application is slowed considerably by the presence of conditional breakpoints, which enable you to specify an expression that is executed to determine if the application should be paused. The more complex the breakpoint conditions are, the slower the application will run. Because these breakpoints can be scattered through multiple source files, it becomes difficult to locate and remove breakpoints that are no longer required.
The Breakpoints window, shown in Figure 39-2, is accessible via Debug
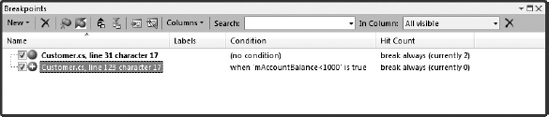
Figure 39-2 shows two currently active breakpoints in the Customer.cs file. The first is a regular breakpoint with no conditions. The second has a condition whereby the application will break only if the mAccountBalance variable has a value less than 1000. This condition is also in bold, because the application is currently in Break mode at that breakpoint.
The Breakpoints window, like most other debugging windows, is made up of two regions: the toolbar and the breakpoint list. Several new functions have been added to the toolbar in Visual Studio 2010, including search, and import and export of breakpoints. These functions are explained further in Chapter 40.
Each item in the breakpoint list is represented by a checkbox that indicates whether the breakpoint is enabled, an icon and breakpoint descriptor, and any number of columns that show properties of the breakpoint. The columns can be adjusted using the Columns drop-down from the toolbar. You can set additional breakpoint properties by right-clicking the appropriate breakpoint.
One of the first debugging windows you will encounter when you run your application for the first time is the Output window. By default, the Output window appears every time you build your application, and shows the build progress. Figure 39-3 shows the successful build of a sample solution. The final line of the Output window indicates a summary of the build, which in this case indicates three successfully built projects. In the output there is also a summary of the warnings and errors encountered during the build. In this case there were no errors, but there were three warnings. Although the Output window can be useful if for some reason the build fails unexpectedly, most of the time the errors and warnings are reported in the Error List.

The Output window has a secondary role as the standard output while the application is running. The drop-down on the left of the toolbar can be used to toggle between output sources. Figure 39-3 shows the output of the build, but as you perform other activities in Visual Studio additional entries are created in the drop-down list. For example, when you run your application in Debug mode, Visual Studio creates an entry called Debug, which displays any messages that either the run time or your code has emitted using Debug.Write or Debug.WriteLine. Likewise, a Refactor entry is created to show the results of any recent refactoring operation that was performed.
Note
The output from external tools such as .bat and .com files is normally displayed in the Command window. The output from these tools can also be displayed in the Output window by setting the Use Output Window option in the Tools
The other icons on the toolbar, in order from left to right, enable you to navigate to the source of a build message, go to the previous message, go to the next message, clear the window contents, and toggle word wrapping for the Output window.
Quite often when you are writing code or debugging your application, you will want to evaluate a simple expression either to test a bit of functionality or to remind yourself of how something works. This is where the Immediate window (Debug
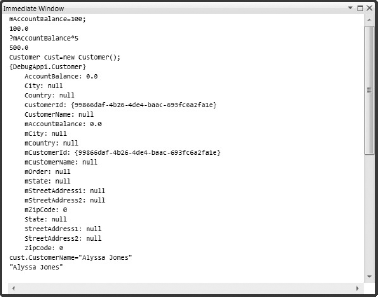
Figure 39-4 shows a new Customer object being created in a C# project within the Immediate window. Within a Visual Basic project you can't do explicit variable declaration (for example, Dim x as Integer). Instead it is done implicitly using the assignment operator.
One of the more useful features of the Immediate window is that it can be used while you are writing code. When you create new objects in the Immediate window at design time, it invokes the constructor and creates an instance of that object without running the rest of your application.
If you invoke a method or property that contains an active breakpoint, Visual Studio changes to Debug mode and breaks at the breakpoint. This is especially useful if you are working on a particular method that you want to test without running the entire application.
The Immediate window supports a limited form of IntelliSense, and you can use the arrow keys to track back through the history of previous commands executed.
Note
IntelliSense is only supported in the Immediate window when running in Debug mode, not during design-time debugging.
The Immediate window also enables you to execute Visual Studio commands. To submit a command, you must enter a greater than symbol (>) at the start of the line. There is an extremely large set of commands available; in fact, almost any action that can be performed within Visual Studio is accessible as a command. Fortunately, IntelliSense makes navigating this list of available commands a little more manageable.
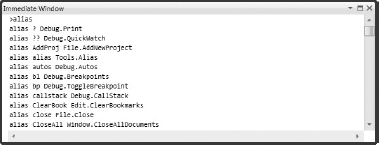
There is also a set of almost 100 predefined aliases for commands. One of the more well-known aliases is "?", which is a shortcut for the Debug.Print command that prints out the value of a variable. You can see the full list of predefined aliases by entering >alias, as shown in Figure 39-5.
Earlier in this chapter you saw how DataTips can be used in the code window to examine the content of a variable by hovering the mouse over a variable name. When the structure of the object is more complex it becomes difficult to navigate the values using just the DataTip. Visual Studio 2010 has a series of Watch windows that can be used to display variables, providing an easy-to-use interface for drilling down into the structure.
The QuickWatch window (Debug
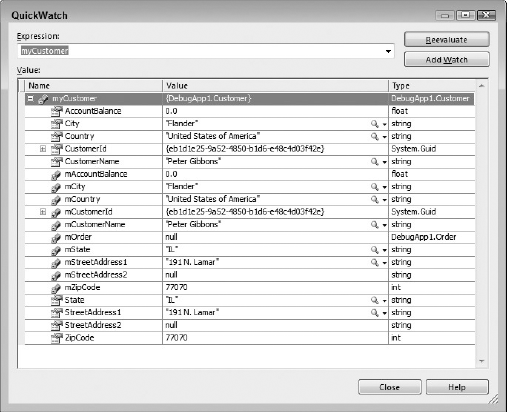
The layout of the Value tree in the QuickWatch window is similar to the DataTip. Each row shows the variable name, the current value, and the type of object. The value of the variable can be adjusted by typing in the Value column.
Use the Add Watch button to add the current expression to one of the Watch windows. These are variables to be continuously watched.
Unlike the QuickWatch window, which is modal and shows a variable value at a particular execution point, the Watch windows can be used to monitor a variable value as you step through your code. Although there are four Watch windows, a single window is sufficient in most cases. Having four separate windows means that you can have different sets of variables in the different windows, which might be useful if you are working through a more complex issue that involves multiple classes.
Figure 39-7 shows an Order and Customer class in a Watch window (Debug
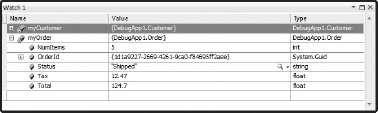
Additional variables to be watched can be added either by typing into the Name column on an empty line or by right-clicking the variable in the code window and selecting Add Watch from the context menu.
In addition to inspecting the contents of variables during a debugging session, it is essential that you carefully evaluate the logic of your code to ensure that everything is executed in the order that you expect. Visual Studio 2010 has a group of debugger windows that show exactly what was loaded and being executed at the time you paused the program execution. This allows you to better understand the runtime behavior of your source code and quickly track down logic errors.
As applications grow in complexity, it is quite common for the execution path to become difficult to follow. The use of deep inheritance trees and interfaces can often obscure the execution path. This is where the call stack is useful. Each path of execution must have a finite number of entries on the stack (unless a cyclic pattern emerges, in which case a stack overflow is inevitable). The stack can be viewed using the Call Stack window (Debug
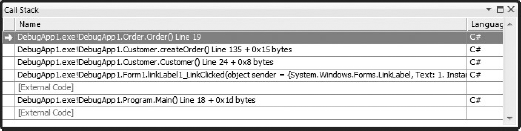
Using the Call Stack window, it is easy to navigate up the execution path to determine from where the current executing method is being called. You can do this by clicking any of the rows in the call stack, known as a stack frame. Other options available from the call stack, using the right-click context menu, enable viewing the disassembler for a particular stack frame, setting breakpoints, and varying what information is displayed.
Most applications make use of multiple threads at some point. In particular for Windows applications, in order for the user interface to always appear responsive, it is important to run time-consuming tasks on a thread separate from the main application. Of course, concurrent execution of threads makes debugging more difficult, especially when the threads are accessing the same classes and methods.
Figure 39-9 shows the Threads window (Debug
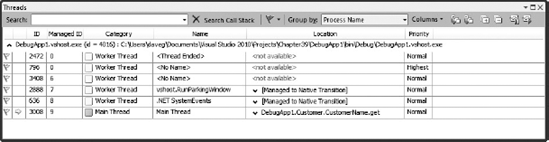
The Threads window shows a yellow arrow next to the thread that is currently being viewed in the code window. To navigate to another thread, simply double-click that thread to bring the current location of that thread into view in the code window and update the call stack to reflect the new thread.
In Break mode, all threads of an application are paused. However, when you are stepping through your code with the debugger, the next statement to be executed may or may not be on the same thread you are interested in. If you are only interested in the execution path of a single thread, and the execution of other threads can be suspended, right-click the thread in the Threads window and select Freeze from the context menu. To resume the suspended thread, select Thaw from the same menu.
Debugging multi-threaded applications is explained further in Chapter 43.
The Modules window (Debug
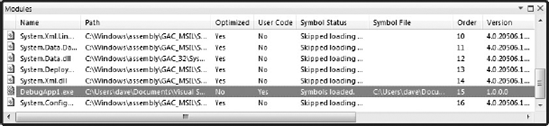
In Figure 39-10 the symbols have been loaded for the DebugApp1.exe application. All the other assemblies have been skipped, because they contain no user code and are optimized. If an appropriate symbol file is available, it is possible to load it for an assembly via the Load Symbols option from the right-click context menu.
Building multi-tier applications can be quite complex, and it is often necessary to have all the tiers running. To do this, Visual Studio 2010 can start multiple projects at the same stage, enabling true end-to-end debugging. Alternatively, you can attach to other processes to debug running applications. Each time Visual Studio attaches to a process, that process is added to the list in the Processes window (Debug
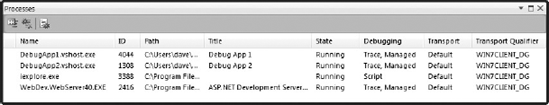
The toolbar at the top of the Processes window enables you to detach or terminate a process that is currently attached, or attach to another process.
The next three windows are typically used for low-level debugging when all other alternatives have been exhausted. Stepping into memory locations, using a disassembler, or looking at registry values requires a lot of background knowledge and patience to analyze and make use of the information that is presented. Only in very rare cases while developing managed code would you be required to perform debugging at such a low level.
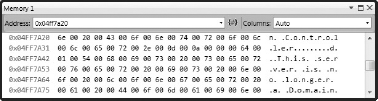
The four Memory windows can be used to view the raw contents of memory at a particular address. Where the Watch, Autos, and Locals windows provide a way of looking at the content of variables, which are stored at specific locations in memory, the Memory window shows you the big picture of what is stored in memory.
Each of the four Memory windows (Debug
Interesting debates arise periodically over the relative performance of two different code blocks. Occasionally this discussion devolves to talking about which MSIL instructions are used, and why one code block is faster because it generates one fewer instruction. Clearly, if you are calling that code block millions of times, disassembly might give your application a significant benefit. However, more often than not, a bit of high-level refactoring saves much more time and involves much less arguing. Figure 39-13 shows the Disassembly window (Debug
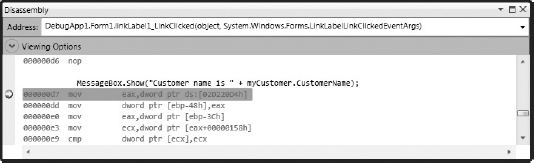
You can see from Figure 39-13 that a breakpoint has been set on the call to the constructor and that the execution point is at this breakpoint. While still in this window you can step through the lines of MSIL and review what instructions are being executed.
One of the more interesting new features in the Ultimate edition of Visual Studio is IntelliTrace. One of the limitations of traditional debuggers is that they only show a snapshot of the state of the application at a single point in time. The IntelliTrace feature of Visual Studio collects information during the debugging session, thereby allowing you to go back to an earlier point and view the application state at that time.
Note
You can think of IntelliTrace as your very own black box flight recorder for debugging.
IntelliTrace has two data collection levels. By default it collects information about diagnostic events only, such as entering Break mode, stepping through code in the debugger, or when an exception is thrown. You can also configure IntelliTrace to collect very detailed information, such as the details of every function call, including the parameters passed to that function and the values that were returned.
The IntelliTrace Events window (Debug
If you have enabled the detailed data collection level, you will be able to use the Autos and Locals windows to inspect the contents of variables that have been collected.
You can change the data collection level or disable it completely from the IntelliTrace tab in the options menu (Tools
Warning
You can expect a reasonable performance impact if you enable the detailed data collection level. You must also ensure that you have enough free disk space to collect this data. The Edit and Continue functionality is also disabled for the detailed level.
IntelliTrace can also debug logs created by the new Visual Studio software test tools, Test and Lab Manager. Chapter 55 provides more information on IntelliTrace.
Nowadays it is almost impossible to purchase a new computer that has a single processor. The trend to many-core CPUs, which has been necessary due to physical limitations that have been reached in CPU architecture, will certainly continue into the future as the primary way for hardware vendors to release faster computers.
Unfortunately, software that has not been written to explicitly run on multiple CPUs will not run faster on a many-core machine. This will be a problem for many users who have been conditioned over the past couple of decades to expect their applications to run faster when they upgrade to newer hardware.
The solution is to ensure that our applications can execute different code paths concurrently on multiple CPUs. The traditional approach is to develop software using multiple threads or processes. Unfortunately, writing and debugging multi-threaded applications is very difficult and error prone, even for an experienced developer.
Microsoft has recognized this issue, and has introduced a number of new features with Visual Studio 2010 and .NET Framework version 4.0 aimed to simplify the act of writing such software. The Task Parallel Library (TPL) is a set of extensions to the .NET Framework to provide this functionality. The TPL includes new language constructs, such as the Parallel.For and Parallel.ForEach loops, and new collections that are specifically designed for concurrent access including ConcurrentDictionary and ConcurrentQueue.
In the new System.Threading.Tasks namespace are several new classes that greatly simplify the effort involved in writing multi-threaded and asynchronous code. The Task class is very similar to a thread; however, it is much more lightweight and therefore performs much better at run time.
Writing parallel applications is only one part of the overall development life cycle — you also need effective tools for debugging parallel applications. To that end Visual Studio 2010 has introduced two new debugging windows — the Parallel Stacks window and the Parallel Tasks window.
You will recall from earlier in the chapter, the Call Stacks window can be used to view the execution path of the current line of code when debugging. One of the limitations of this window is that you can see only a single call stack at a time. To see the call stack of other threads, you must use the Threads window or Debug Location toolbar to switch the debugger to a different thread.
The Parallel Stacks window (Debug
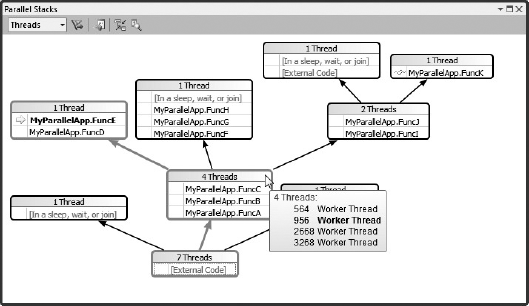
The Parallel Stacks window in Figure 39-16 shows an application that is currently executing seven threads. The call graph is read from bottom to top. The Main thread appears in one box, and four others threads are grouped together in another box. The reason these four threads are grouped is because they share the same call stack (that is, each thread called FuncA, which then called FuncB, which in turn called FuncC). After these threads executed FuncC, their code paths diverged. One thread executed FuncD, which then called FuncE. A different thread executed FuncF, FuncG, and then FuncH. The other two threads executed FuncI, which called FuncJ, and so on. You can see how visualizing all of the call stacks at once provides a much better understanding on the state of the application as a whole and what has led to this state, rather than just the history of an individual thread.
A number of other icons are used on this screen. The execution point of the current thread is shown with a yellow arrow. In Figure 39-16, this is against FuncE in a box on the left-hand side of the diagram. Each box that the current thread has progressed through as part of its execution path is highlighted in blue. The wavy lines (also known as the cloth thread icon) shown against the call to FuncK in the top-right box indicates that this is the current execution point of a non-current thread.
As shown in Figure 39-16, you can hover over the thread count label at the top of each box to see the Thread ID's of the applicable threads. You can also right-click any entry in a call stack to access various functions such as navigating to the applicable line of source code in the code editor or switching the visualization to a different thread.
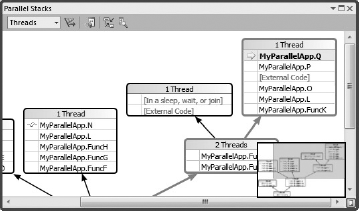
If you are working with an application that uses numerous threads or tasks, or has a very deep call stack, you may find that the Parallel Stacks call graph visualization does not fit in the one window. In this case you can click the icon in the bottom-right corner of the window to display a thumbnail view, which enables you to easily pan around the visualization. You can see this in Figure 39-17.
At the beginning of this section of the chapter we explained the new Task Parallel Library in .NET version 4.0, which includes the Task class found in System.Threading.Tasks and the new Parallel.For loops. The Parallel Tasks window (Debug

The application that has been paused in Figure 39-18 has created four tasks, two of which are running and two of which are in a waiting state. You can click the flag icon to flag one or more tasks for easier tracking.
Note
Parallel.For, Parallel.ForEach, and the Parallel LINQ library (PLINQ) use the System.Threading.Tasks.Task class as part of their underlying implementation.
Visual Studio 2010 has a sophisticated exception handler that provides you with a lot of useful information. Figure 39-19 shows the Exception Assistant dialog that appears when an exception is raised. In addition to providing more information, it also displays a series of actions. The Actions list varies depending on the type of exception being thrown. In this case, the two options are to view details of the exception or copy it to the clipboard.
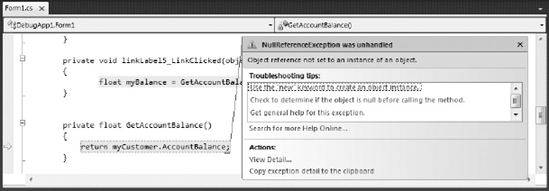
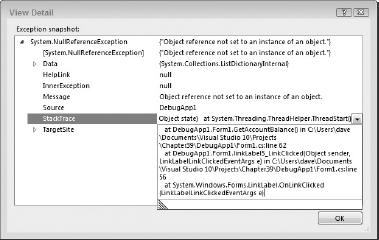
If you select the View Detail action item from the exception, you are presented with a modal dialog that provides a breakdown of the exception that was raised. Figure 39-20 shows the attributes of the exception, including the Stack Trace, which can be viewed in full by clicking the down arrow to the right of the screen.
Of course, at times exceptions are used to control the execution path in an application. For example, some user input may not adhere to a particular formatting constraint, and instead of using a Regular Expression to determine whether it matches, a parse operation has been attempted on the string. When this fails, it raises an exception, which can easily be trapped without stopping the entire application.
By default, all exceptions are trapped by the debugger, because they are assumed to be exceptions to the norm that shouldn't have happened. In special cases, such as invalid user input, it may be important to ignore specific types of exceptions. This can be done via the Exceptions window, accessible from the Debug menu.
Figure 39-21 shows the Exceptions window (Debug
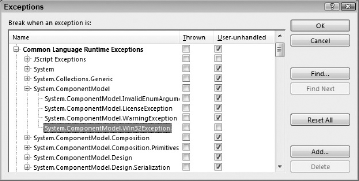
Unfortunately, the Exceptions window doesn't pick up any custom exception types that you may have created, but you can add them manually using the Add button in the lower-right corner of the window. You need to ensure that you provide the full class name, including the namespace; otherwise, the debugger will not break on handled exceptions. Clearly, unhandled exceptions will still cause the application to crash.
As with a lot of the configurable parts within Visual Studio 2010, the information displayed by the Exception Assistant is stored in an XML file (C:Program FilesMicrosoft Visual Studio 10.0Common7IDEExceptionAssistantContent1033DefaultContent.xml). This file can be modified either to alter the assistant information for existing exception types or to add your own custom exception types. If you have your own exception types, it is better practice to create your own XML document. Simply placing it in the same directory as the DefaultContent.xml is sufficient to register it with Visual Studio for the next time your application is debugged. An example XML file is provided in the following code listing:
<?xml version="1.0" encoding="utf-8" ?>
<AssistantContent Version="1.0" xmlns="urn:schemas-microsoft-com:xml-msdata:
exception-assistant-content">
<ContentInfo>
<ContentName>Additional Content</ContentName>
<ContentID>urn:exception-content-microsoft-com:visual-studio-7-default-
content</ContentID>
<ContentFileVersion>1.0</ContentFileVersion>
<ContentAuthor>David Gardner</ContentAuthor>
<ContentComment>My Exception Assistant Content for Visual Studio
</ContentComment>
</ContentInfo>
<Exception>
<Type>DebugApp1.myException</Type>
<Tip HelpID="http://www.professionalvisualstudio.com/MyExceptionHelp.htm">
<Description>Silly error, you should know better...</Description>
</Tip>
</Exception>
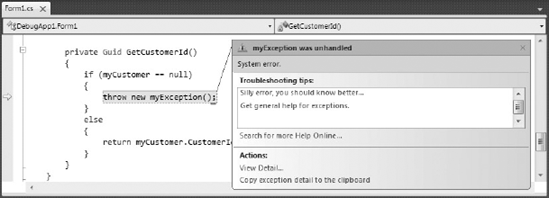
</AssistantContent>This example registers help information for the exception type myException. The HelpID attribute is used to provide a hyperlink for more information about the exception. When this exception is raised, the debugger displays the window shown in Figure 39-22.
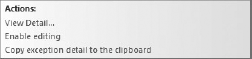
In Figure 39-23, there is an additional item in the Actions list of an exception helper window, which is to enable editing. This is effectively the capability to unwind the execution of the application to just before the exception was raised. In other words, you can effectively debug your application without having to restart your debugging session.
The Enable Editing option appears only if you have configured Visual Studio to break when an exception is thrown, as discussed earlier in this chapter. As with many of the debugging features, both the Exception Assistant and the capability to unwind exceptions can also be disabled via the Debugging tab of the Options window.
Note
An alternative way to unwind the exception is to select the Unwind to This Frame item from the right-click context menu off the Call Stack window after an exception has been raised. This can be useful to check what the state of the application was just before the exception was thrown. You can only unwind an exception if it is handled (that is, contained within a try . . . catch block). You should also ensure that the debugger is set to break when the exception is thrown. You can do this via the Debug
This chapter has described each of the debugging windows in detail so you can optimize your debugging experience. Although the number of windows can seem somewhat overwhelming at first, they each perform an isolated task or provide access to a specific piece of information about the running application. As such, you will easily learn to navigate between them, returning to those that provide the most relevant information for you.
The following chapter provides more detail about how you can customize the debugging information. This includes changing the information displayed in the DataTip and visualizing more complex variable information.