
Adding debugging actions to your code with the
DebugandTraceclassesLearning techniques for debugging applications already running on the local or remote computer
Debugging multi-threaded applications, SQL Server stored procedures, and mixed-mode applications
As you've seen throughout the last several chapters, Visual Studio 2010 comes with a great variety of ways to debug and run through your applications, including catching errors and displaying them to you for action before the code executes too far; a number of techniques for effectively debugging web applications; and other features, such as breakpoints and visualizing errors.
However, there is still more functionality to be found in Visual Studio that you can use to customize your experience with debugging projects, databases, unmanaged code, and even the .NET Framework itself. In this chapter you'll find advanced techniques for debugging your projects regardless of language or technology.
Visual Studio provides several ways to launch applications at the start of a debugging session. For most projects the default start option will be sufficient, which in the case of a Windows executable will launch the program directly. In the case of a web application, Visual Studio opens the default web browser and loads the current page, or navigates to the root path of the web application if there is no active page.
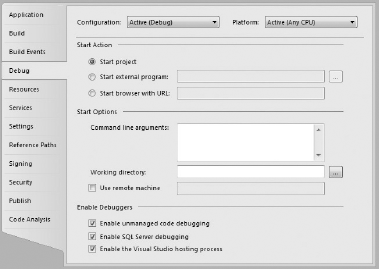
In some scenarios you may want a different action to occur during a debugging session. For example, you may need to always open a specific web page when the web application is started. In these scenarios you can change the start options on the Debug or Web project property page. Figure 43-1 shows the start actions for a Windows Forms project.
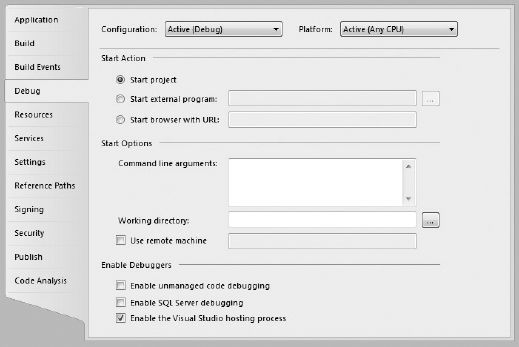
In addition to starting the project directly, you can also choose to start an external program that presumably will subsequently call your project into the execution process. Alternatively, you can choose to launch the default web browser on your system with a specific URL, again with the assumption that the URL will ultimately invoke your project.
Often, applications are built with the capability to exhibit different behavior depending on command-line arguments. If your project is of this variety and you need to test the different configurations, you can use the Command Line Arguments textbox to specify which set of arguments is to be included in the execution of the project. You should enter the command-line arguments in exactly the same way you expect the end user to do so when that user is invoking your application once it has been deployed.
You can override the default directory from which the application should be executed by setting the Working Directory option. This equates to the same setting when you edit a Windows shortcut. In addition, you can also specify a different machine to control the debugging process of the application by activating the Use Remote Machine option. Note that you will need to explicitly specify the remote computer path, because it does not have an associated browse option.
The final section of the Debug page pertains to the different kinds of debugging that will be performed during the execution of your application. By default, the only debugging process active is the debugging of managed code inside the Visual Studio environment, but you can optionally include native unmanaged code or SQL Server stored procedures. These debuggers are discussed later in the chapter.
Note
The configuration and platform settings are available only when you have the Show Advanced Build Configurations setting activated. You can find this in the Projects and Solutions
The start actions for ASP.NET web applications are found on the Web property page for the project, as shown in Figure 43-2. The default is to launch the web site with whichever page is currently open in the code editor or web designer. This can be changed to always use a specific page or URL. The other option is to start an external program or wait for a request from an external application. This is particularly useful when debugging a web service that is invoked by another application.
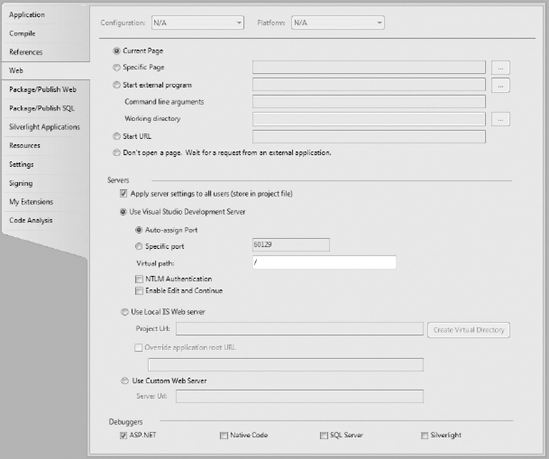
ASP.NET web application projects can also choose from one of three web server options. The built-in Visual Studio Development Server is the most convenient, because it does not require installation or configuration. Unlike IIS, the Visual Studio Development Server supports Edit and Continue. The Custom Web Server option enables you to specify a remote web server to debug against.
Three classes ship with the .NET Framework under the System.Diagnostics namespace that can be used to build debugging support directly into your code — the Debug, Debugger, and Trace classes. When used properly, these classes provide a very powerful way for you to interact with the debugger.
The functionality provided by all three of these classes is exposed through static/shared methods and properties, which makes it easy to add them to your code.
The Debugger class provides programmatic access to certain debugger functions within Visual Studio. For example, the following code snippet checks whether the application is running under a debugger and, if not, launches one and attaches to the process:
- C#
if (!Debugger.IsAttached) { Debugger.Launch(); }- VB
If Not Debugger.IsAttached() Then
    Debugger.Launch()
End If
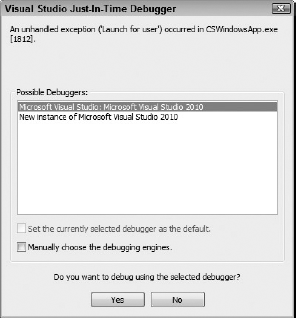
When this code is executed while the application is running normally outside Visual Studio, the program execution pauses, and you are presented with a dialog box similar to the one shown in Figure 43-3. Selecting a New Instance of Visual Studio 2010 loads the application in Visual Studio and continues executing the application in Debug mode.
The Debug and Trace classes are used to output debugging information and trace the execution path of your application. Most of the properties and methods are common across the two classes, which may seem redundant. However, there is a key difference in the way these methods are implemented and the results presented to you.
The Debug class should be used if you only need to output information while running in Debug mode. The Trace class can be used if you want output in both the Debug and Release versions. While you are debugging an application during development, both your tracing and debugging output go to the Output window in Visual Studio. However, in Release mode, any Debug statements will be suppressed by the compiler and not invoked during execution. This ensures that you can include a large amount of debug code in your application without increasing the size or decreasing the performance of your release code.
Note
The ability to use Trace and Debug statements in different build configurations is specified through compiler directives. Within Visual Studio, you can enable or disable these directives from the project properties pages. These settings are found on the Build property page for C# projects, and under the Advanced Compiler Options button on the Compile property page for Visual Basic projects.
The methods that are available to output debug messages in the Debug and Trace classes are listed in Table 43-1.
Table 43.1. Methods for Outputting Debug Messages
METHOD | OUTPUTS |
|---|---|
| The text or string representation and an optional category. |
| The text and an optional category, if the condition specified as an argument evaluates to true. |
| The text followed by a carriage return and an optional category. |
| The text followed by a carriage return and an optional category, if the condition specified as an argument evaluates to true. |
You can also offset the output by increasing or decreasing the indenting through the Indent and Unindent methods.
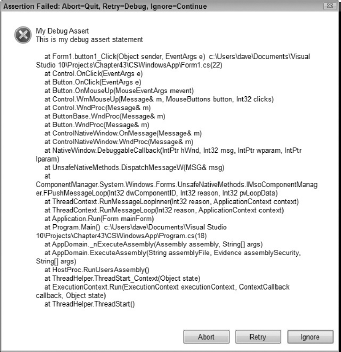
You can use the Assert method on the Debug and Trace classes to create an assertion, which tests a condition that was specified as an argument. If the condition evaluates to true, no action occurs. If the condition evaluates to false, the assertion fails. If you are running in Debug mode, your program pauses execution, and a dialog box is displayed, as shown in Figure 43-4.
Selecting Abort terminates the application execution. Retry breaks at the statement and Ignore continues execution.
While running in Debug mode, all output from the Debug and Trace classes is displayed in the Output window. However, with a Release build all trace output is collected by a listener. A listener is simply an object that receives trace output and writes it to an output device. An output device could be a text file, Windows event log, or some other custom logging repository.
Finally, Trace Switches are available, which allow you to enable, disable, and filter tracing output. Trace Switches can be declaratively enabled within the app.config file for an application.
Sometimes you'll need to debug an application that is running outside Visual Studio. Many reasons exist for why you would want to do this, such as if a defect appears only when an application is executed in production. Fortunately, Visual Studio provides a simple method for attaching and debugging a Windows executable or web application that is actively running.
Attaching to a running Windows process is a fairly straightforward task in Visual Studio. Ideally, you will have the original source code open in Visual Studio, in which case you will be able to debug the process as if you had launched it in Debug mode from Visual Studio.
Note
If you are debugging an executable without access to the source code, the available debugging features are limited. If the executable was built without debug information or symbols, available features are further limited and it is unlikely that you will gain much useful information by debugging it in this way. Therefore, it is recommended that when you perform a release build you should in fact perform two builds: one with and one without debug symbols. The symbols should be archived in a safe location so that they can be accessed if you ever need to attach to a running process or debug a memory dump.
From the Debug menu, use the Attach to Process command. This displays the Attach to Process dialog window (see Figure 43-5), from which you can browse all active processes. Locate the application that you want to debug from the Available Processes list and click the Attach button.
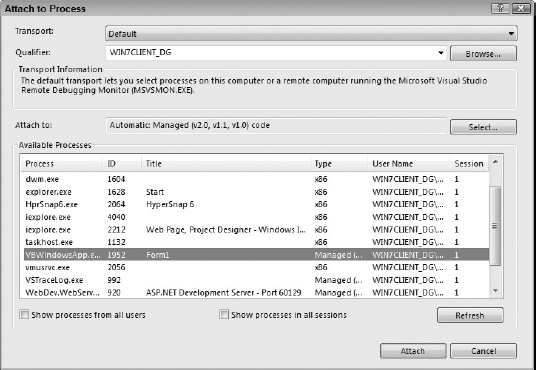
Because attaching to an application requires these manual steps, it is not well suited if you are trying to debug a problem that occurs during startup. Also, if you are debugging an application that does not require any user input and finishes quickly, you may not have time to attach to it. In both these scenarios it would be better to either launch the application in Debug mode from within Visual Studio, or create a custom build with a Debug.Break() statement in the startup code of the application.
Once you've finished debugging an attached process, you should always cleanly detach from the process by selecting Debug
Attaching to an ASP.NET web application is almost as easy as attaching to a Windows application. However, before you attach to a web application, you must ensure that it has debugging enabled by editing the web.config file for the application. Locate the Compilation node within system.web and set the debug attribute to true. The following listing shows a minimal web.config file with the Debug option set, ready for attaching the debugger to the application:
<configuration>
    <appSettings/>
    <connectionStrings/>
    <system.web>
        <compilation debug="true" />
    </system.web>
</configuration>
ASP.NET automatically detects any changes to web.config settings and applies them immediately. Therefore, you don't need to restart the computer or the IIS service for this change to take effect. As discussed in Chapter 42, this change can have an adverse affect on performance, so you should never leave it enabled in production.
Once you have enabled debugging you can attach to the web application. The process you'll need to attach to is the ASP.NET worker process, which will either be the native process within IIS (called w3wp.exe for IIS 6.0 or higher, or aspnet_wp.exe on older versions of IIS) or the built-in Visual Studio 2010 development server WebDev.WebServer.exe.
Note
Because the IIS process normally runs under the ASPNET or NETWORK SERVICE account, you will need to be running Visual Studio with Administrator rights to attach the debugger to it.
To begin debugging, select Attach to Process from the Debug menu in Visual Studio 2010. Select the Show Processes in All Sessions checkbox if you are attaching to ASP.NET under IIS. Locate the ASP.NET worker process from the Available Processes list and click the Attach button. As shown in Figure 43-6, you may be prompted to restart Visual Studio with elevated rights.

Remote debugging enables you to attach to an application that is executing on another machine. This can be useful for those cases where a bug is manifesting itself only on a non-programmer's computer, or if you need to debug a Windows Service or ASP.NET web application that is running on a production server.
Debugging a remote application is no different from debugging a local application. Once you have attached to the remote application you can set breakpoints, watch variables, and step through code. However, before you can attach to a remote process you must ensure that the Remote Debugging Monitor is running on the machine to be debugged.
The Remote Debugging Monitor, msvsmon.exe, is a small executable that is shipped with Visual Studio 2010. By default you will find the 32-bit version installed in the directory C:Program FilesMicrosoft Visual Studio 10.0Common7IDERemote Debuggerx86.
Note
The x64 version of msvsmon.exe is not installed by default with Visual Studio 2010 unless you are running a 64-bit version of Windows. The IA-64 version of msvsmon.exe is available only with Visual Studio Team System.
You can simply copy this folder over to the remote machine and run it locally, or create a share and run it from a UNC path. You can also choose to install the Remote Debugging Monitor on the remote machine by running the setup MSI file that is on the Visual Studio installation DVD media under the Remote Debugger directory.
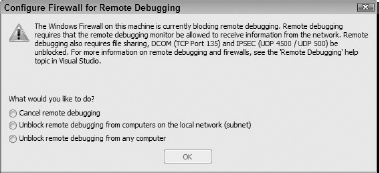
When you launch msvsmon.exe on a remote computer for the first time, it attempts to configure the Windows Firewall to open the network ports necessary to enable remote debugging. In some environments, such as on a Windows Server 2003, it prompts you to make the necessary changes as shown in Figure 43-7. On the Developer's machine, Visual Studio makes the necessary changes to the Windows Firewall to enable it to connect to a remote machine.
Once you have started the Remote Debugging Monitor it simply listens on the network for incoming debugging requests. By default, remote requests must be authenticated, and only users who are Administrators have the necessary permissions to attach and debug applications. These security settings can be changed from the Tools

Warning
If you enable the No Authentication mode, your machine will be vulnerable to any user on the network. A remote user could launch applications on your computer, access data, or perform untold mischievous or destructive actions by using a debugger. You have been warned!
Once you have the Remote Debugging Monitor running on the remote machine, you can attach to an application on that machine through the Debug
One of the more interesting trends that has emerged from Microsoft in recent years is an increased openness and even willingness to embrace open source. The ASP.NET MVC Framework, covered in Chapter 21, is a good example of this, because the source code for this has been released as a buildable Visual Studio project solution.
However, arguably more significant than this has been the release of the source code for a large number of base class libraries in the .NET Framework. Available under the read-only Microsoft Reference License, it enables you to step into and debug the .NET Framework code as part of a debugging session. Though you could always infer the programmer's intent by using Reflector, there is no comparison to browsing the actual source code, including the inline documentation. The really good news is that this documentation is quite comprehensive.
Note
The source code is not available for every assembly that ships as part of the .NET Framework, nor is it available for every version that has been released. For the assemblies that are available, there has often been a delay between when the framework was publicly released and when the source code became available. You can find the list of currently available assemblies at http://referencesource.microsoft.com/netframework.aspx.
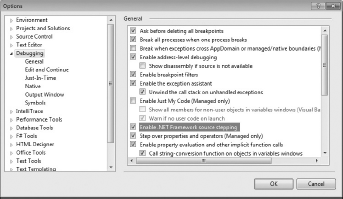
The first step to enabling access to the source code is to configure some Debugger settings. Open the Tools
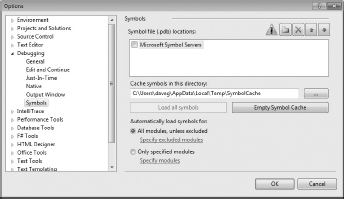
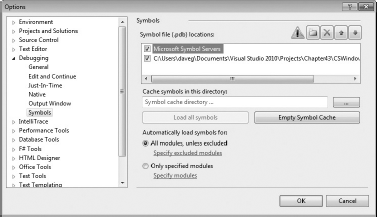
Secondly, navigate to the Symbols category in the Options dialog (see Figure 43-10) and check the symbol cache location that was automatically added. You can modify the cache location if required, but ensure that you have full read/write access to the target directory. If you are configuring these options while running in Debug mode, you also have the option to download the symbols immediately by clicking the Load all symbols button. Otherwise, if you are not running a debug session, the symbols applicable to the current project are downloaded as soon as you click OK.
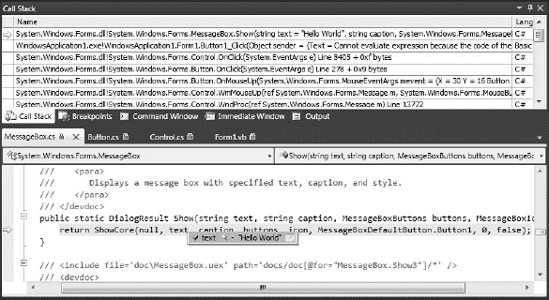
You will now be able to step into and browse the .NET Framework base class libraries during a debugging session. Set a breakpoint in your application code and run in Debug mode. When the breakpoint is hit, open the Call Stack window (Debug
Multi-threaded applications have traditionally been notoriously difficult to debug properly. Seemingly fundamental tasks, such as keeping track of which thread you are currently inspecting and what other threads are currently executing, are some of the reasons why this task is so hard. Fortunately, Visual Studio 2010 has improved the support available for debugging multi-threaded applications.
Chapter 39 discussed the Threads debug window, which lists all the active threads for a particular application. Functionality accessed through this window includes the ability to set a friendly name for a thread. You can also set flags on individual threads, which means that you don't have to spend as much time trying to keep track of thread IDs.
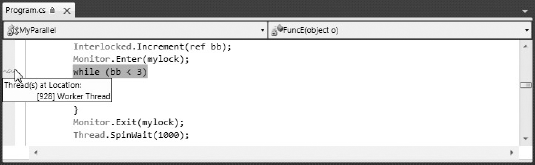
To further improve debugging, you can now identify each thread within the source code editor window. This is enabled from the Threads window by right-clicking any entry and selecting Show Threads in Source. The result of this is shown in Figure 43-12, where a cloth thread icon (consisting of a red and blue wavy line) is displayed in the gutter. The thread icon indicates that a thread, or several threads, is stopped at this location. When you hover over the thread icon, a tooltip is displayed that identifies which threads are stopped here. The thread names listed are the friendly names that have been entered in the Threads window.
Within the Debug Location toolbar, shown in Figure 43-13, you can navigate between threads. When you select a different thread from the Thread drop-down list, the Call Stack is updated with the selected thread's execution path, and the execution point is moved to the current location in the source code. The call graph in the Parallel Stacks window will also be updated to reflect the newly selected current thread.

You can also flag both threads and tasks from the Threads and Parallel Tasks windows. Flagging enables you to keep track of a thread or task within a debugging session, and filter out some of the tasks or threads you are not interested in. In Figure 43-14, we have flagged the first two tasks in the Parallel Tasks window. By selecting the Show Only Flagged option on the toolbar of the Parallel Stacks window, we have filtered the call graph to hide the tasks that we are not interested in.

Though debugging multi-threaded and parallelized applications is still not a trivial task, these features do make it much easier to drill down on specific threads and tasks, and filter out the unimportant information from the Visual Studio debugger windows.
Another very useful feature of the debugging model found in Visual Studio 2010 is the capability to debug stored procedures in SQL Server databases. You'll need to first check the Enable SQL Server Debugging setting in the Debug property page of your project, as shown in Figure 43-15. Once activated, whenever your code encounters a stored procedure, you can debug the procedure code inline with your own code.
You can even include breakpoints within a stored procedure so you can trace through the SQL Server code without halting the application code execution.
Your Windows account must be a member of the sysadmin group on SQL Server in order to debug stored procedures.
A mixed-mode application is any application that combines managed code (Visual Basic, C#, Managed C++, and so on) with native code (typically C++). Debugging a mixed-mode application is not all that different from debugging a pure managed-code application; however, you must first configure the application to support native code debugging. Figure 43-15, in the previous section, shows the unmanaged code debugger enabled, along with the SQL Server debugger.
Mixed-mode debugging has a couple of limitations that you should be aware of. First, it is only available on Windows 2000 or higher operating systems. Also, when debugging a mixed-mode application, you may find that some operations, such as stepping through code, run very slowly. This can be improved by unchecking the option to Enable Property Evaluation and Other Implicit Function Calls in the Debugger option page.
Note
Because native call stacks and managed call stacks are different, the debugger cannot always provide a single complete call stack for mixed code. Though rare, it is possible that there will be some discrepancies in the call stack. You can find more information on this in the MSDN library.
Even with the most well tested of applications, it is inevitable that there will be latent bugs within your code that will show up after the software has been released. Fortunately, it is possible to debug many of the errors on user computers after they have occurred.
Post-mortem debugging involves inspecting a dump of the application's memory that was taken when the error or unexpected behavior occurred. This could be when an unhandled exception is thrown, or if the application enters a hung state, or simply if the application is exhibiting behavior that indicates it may have a memory leak.
In the past you would use tools such as WinDbg with the Son of Strike (SOS) extension to debug memory dumps of .NET applications. However, WinDbg was designed for native code debugging, and even with the additional support provided by SOS it was still difficult to perform tasks such as matching the MSIL back to the source code.
Visual Studio 2010 and .NET Framework 4.0 have introduced new functionality that makes it much easier to debug memory dumps of .NET applications.
Note
Post-mortem debugging, as described here, only works for .NET version 4.0 applications and web sites. It is also much better if your application is compiled in a debug configuration. If not, you will not have access to a lot of very useful information.
You have several ways to generate dump files, including the Windows Task Manager, WinDbg, and Visual Studio itself. On Windows Vista or later operating systems, the simplest method is to right-click the process in the Windows Task Manager and select Create Dump File.
One of the more functional tools for generating dumps is the adplus.vbs script, which is a command-line interface to WinDbg. The adplus script and WinDbg are installed with the Debugging Tools for Windows, which is available from http://www.microsoft.com/whdc/DevTools/Debugging/. You must install the version that matches the processor architecture on the target machine (x86, x64, Itanium).
To generate the dump file, open a command prompt, change directory to the install location of the Debugging Tools, and enter the following command:
adplus -hang -pn processname.exe
This command attaches to the application called processname.exe in non-invasive mode, generates the dump, and then detaches. The application will continue to run after this.
If you are debugging a hung application, an application that is using an excessive amount of memory, or an application that is exhibiting unexpected behavior, you should take one or more memory dumps at the appropriate times. It may involve a degree of trial and error to ensure that you generate a dump that contains useful information.
If you are debugging a specific exception that is being thrown in an application, you will need to use the -c switch to pass in a file that configures adplus to generate a dump file when that exception is thrown.
You can also use Visual Studio 2010 to generate a dump file during a debug session. To do so, pause execution and select Debug
To get the most out of post-mortem debugging you will need to configure Visual Studio to load your symbol files. Symbol files have a PDB extension and are generated as part of a debug build. You will find them in the debug output build directory; there is one for each assembly that was built.
Under Visual Studio select Tools
Now that you have generated your dump file and set up the symbols, you use Visual Studio to begin post-mortem debugging. Select File
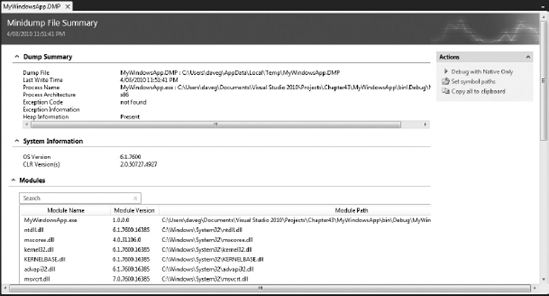
Click the Debug with Mixed link to load the dump and all symbols and begin debugging. This link is only displayed if the dump is from a managed application that targets the .NET Framework 4.0; otherwise you can only use the Debug with Native Only option.
Debugging a dump file is much the same as any other debugging session — you can display the call stack, inspect the contents of variables, and view the threads. The one main limitation is that because you are looking at a snapshot, and not a live application, you cannot step through the source code.
This chapter completes the discussion on debugging your projects and applications, offering details about advanced debugging techniques. Visual Studio 2010 is capable of meeting a wide spectrum of debugging scenarios, such as multi-threaded applications, stored procedures, unmanaged code, and even the .NET Framework itself. These techniques provide you with a set of very effective debugging options for tracking down the issues in your projects regardless of language or technology.