
WHAT'S IN THIS CHAPTER?
Inspecting the contents of your variables usingDataTips
Applying attributes to your classes and member variables to customize the debugger behavior
Creating type proxies and visualizers to represent complex variables and data types in a useful way within the debugger
Other than writing code, debugging is likely the most time-consuming activity when writing an application. If you consider all the time you spend stepping through code, looking at the Watch window to see the value of a variable, or even just running the application looking for any exceptions being raised, you will realize that this is one of the most time-consuming parts of writing software.
Previous chapters have focused on how you can use the various debugging windows to retrieve information about the current status of your application, and how you can set breakpoints and tracepoints to generate debugging information. This chapter goes beyond what is provided out of the box, and looks at how you can customize the debugging experience to reduce the time spent wading through unnecessary lines of code.
Using debugging proxy types and visualizers, you can represent complex variables and data types in a useful way within the debugger. This allows you to filter out unnecessary information and zero in on the most relevant properties of an object, thereby making it easier to determine when your application is not functioning correctly and be able to trace the source of the issue.
You have many ways to inspect the value of variables within Visual Studio while debugging. For many types, the easiest way to inspect a variable is simply hover the mouse over it, which displays the value of the variable in a DataTip. Figure 41-1 shows a DataTip for a string property.
In addition to viewing the value of the variable, you can right-click the DataTip and perform a number of actions. These include copying the value that is being displayed, adding the variable to the Watch window, or even editing the current value of the variable in the case of simple types such as strings or integers.
One new feature of Visual Studio 2010 is the introduction of pinned and floating DataTips. You can think of these as the electronic equivalents of Post-It notes for Visual Studio. To create a pinned DataTip, click the pin icon in the right-hand side of the DataTip. The DataTip will now stay pinned to that line of code in the source file of the code editor and will become visible anytime a debugging session is underway.
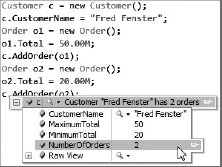
Figure 41-2 shows a Visual Studio workspace with two pinned DataTips for the variables c.CustomerName and o1.Total. A menu will appear when you hover over a pinned DataTip. Clicking the icon with double arrows will display a text input field below the DataTip where you can enter some text. You can also click the pin icon in the menu to covert the pinned DataTip to a floating DataTip. The DataTip for the c variable in Figure 41-2 is a floating DataTip.
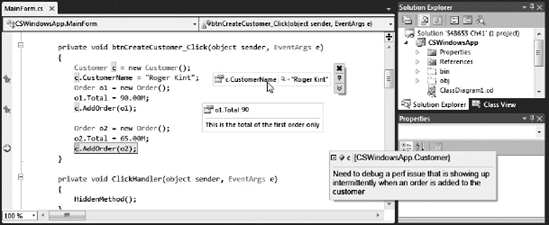
You can drag a pinned DataTip to any line of code in the source file to which it has been pinned, but not anywhere outside of the code editor window. Pinned DataTips will also disappear if you switch to a different source code file. Floating DataTips, on the other hand, are always visible during a debugging session and can be dragged to any location on your monitor.
A blue pin icon will appear in the margin of the code editor for each pinned DataTip. This icon will still be visible once the debug session has finished; you can hover the mouse over it and the DataTip will appear with the value during the last debug session.
You can close an individual pinned or floating DataTip by clicking the x icon, or close all of them by selecting Debug
Finally, DataTips can be imported and exported to an external XML file, which can be useful for backup purposes, or sharing them among developers. This is done by selecting Import DataTips or Export DataTips from the Debug menu.
This section outlines a number of debugging attributes that can be applied to code to affect the way the debugger steps through it. Some of the debugging attributes can also be used to customize the appearance of your types when you hover over them in Break mode.
Note
The debugging attribute classes are contained within the System.Diagnostics namespace. Rather than specify the full namespace for each attribute, the source code examples in this chapter assume that it has been added as an import.
The first attribute you can apply to fields and properties is the DebuggerBrowsable attribute. In .NET Framework 2.0, this attribute was only interpreted by the C# debugger and had no effect when applied to Visual Basic code. This limitation has been removed in newer versions of the .NET Framework. The DebuggerBrowsable attribute takes a single parameter that determines how the member is displayed in the variable tree. In the following code snippet, the field Orders is set to Collapsed:
- C#
public class Customer { [DebuggerBrowsable(DebuggerBrowsableState.Collapsed)] public List<Order> Orders; }- VB
Public Class Customer
   <DebuggerBrowsable(DebuggerBrowsableState.Collapsed)> _
   Public Orders As List(Of Order)
End Class
Figure 41-3 (left) shows the same snippet of code with DebuggerBrowsable initially set to Collapsed (or not specified). Figure 41-3 (center) shows the same snippet with DebuggerBrowsable set to the RootHidden value, where the actual Orders item does not appear, just the contents of the collection. Finally, in Figure 41-3 (right) the Never value is used for DebuggerBrowsable, in which case the Orders member does not appear at all.

When you hover your mouse over a variable while you are in Break mode, the first thing you will see in the tooltip is the type of object you are hovering over. In Figure 41-3, a mouse was initially hovering over the Customer class, followed by the Order class. This information is not particularly useful, because most of the time you have a fairly good idea about the type of object you are dealing with. It would be better for this single line to contain more useful information about the object. This is the case for well-known types, such as strings and integers, where the actual value is displayed.
The DebuggerDisplay attribute can be used to change the single-line representation of the object from the default full class name. This attribute takes a single parameter, which is a string. The format of this string can accept member injections using the String.Format breakout syntax. For example, the attributes applied to the Customer and Order classes might be as follows:
- C#
[DebuggerDisplay("Customer {CustomerName} has {Orders.Count} orders")] public class Customer [DebuggerDisplay("Order made on {DateOrdered} which is worth ${Total}")] public class Order- VB
<DebuggerDisplay("Customer {CustomerName} has {Orders.Count} orders")> _
Public Class Customer

<DebuggerDisplay("Order made on {DateOrdered} which is worth ${Total}")> _
Public Class Order
This would give you the debugger output shown in Figure 41-4, which indicates that customer Michael McManus has one order, which, as you can see from the description, was made on April 4 and is worth $120.
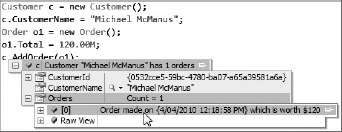
Looking back at the syntax for the DebuggerDisplay attribute, you can see that the output string consists of both static text and field and property information from the object. For example, the CustomerName property for the Customer object is referenced using the {CustomerName} syntax within the static text.
DebuggerHidden
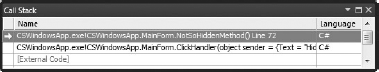
The DebuggerHidden attribute can be added to code that you don't want to step through when debugging. Code marked with this attribute is stepped over and does not support breakpoints. If this code makes a call to another method, the debugger steps into that method. Taking the following code snippet, a breakpoint can be set in both ClickHandler and NotSoHiddenMethod:
- C#
private void ClickHandler(object sender, EventArgs e) { HiddenMethod(); } [DebuggerHidden()] public void HiddenMethod() { Console.WriteLine("Can't set a breakpoint here"); NotSoHiddenMethod(); } public void NotSoHiddenMethod() { Console.WriteLine("Can set a breakpoint here!"); }- VB
Private Sub ClickHandler(ByVal sender As Object, ByVal e As EventArgs)
   HiddenMethod()
End Sub

<DebuggerHidden()> _
Public Sub HiddenMethod()
   Console.WriteLine("Can't set a breakpoint here")
   NotSoHiddenMethod()
End Sub

Public Sub NotSoHiddenMethod()
   Console.WriteLine("Can set a breakpoint here!")
End Sub
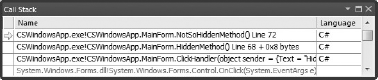
If you step through this code, the debugger goes from the call to HiddenMethod in the ClickHandler method straight to NotSoHiddenMethod. The call stack at this point is shown in Figure 41-5, and you can see that HiddenMethod does not appear in the stack.
As with all of the System.Diagnostic attributes, the CLR will ignore this, so you will still see the method call in the stack trace of any exceptions thrown at run time.
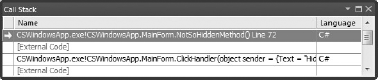
Like the DebuggerHidden attribute, when the DebuggerStepThrough attribute is applied to a piece of code, that code is stepped over when debugging, regardless of whether this code calls other methods.
Similar to the DebuggerHidden attribute, breakpoints cannot be set within a block of code marked with the DebuggerStepThrough attribute. However, if a breakpoint is set within a section of code that is called by that code, the attributed code will be marked as external code in the call stack. This is illustrated in Figure 41-6, which shows the code that was listed in the previous section. However, in this case DebuggerStepThrough has been set on HiddenMethod instead of DebuggerHidden.
Visual Studio 2010 supports the Just My Code option, configurable from the Debugging node in the Options dialog (select Tools
Note
You can also right-click the call stack and select "Show External Code" to reveal any hidden or designer code.
The DebuggerNonUserCode attribute combines the DebuggerHidden and DebuggerStepThrough attributes. In the default Visual Studio configuration, code marked with this attribute appears as external code in the call stack. As was the case with the DebuggerStepThrough attribute, you cannot set breakpoints in blocks of code marked with this attribute. Stepping through code steps into any code called by that block of code in the same way it does for the DebuggerHidden attribute.
DebuggerStepperBoundary is the most obscure of all of the Debugger attributes, because it comes into effect only under specific conditions. It is used to avoid a misleading debugging experience that can occur when a context switch is made on a thread within the boundaries of the DebuggerNonUserCode attribute. It is entirely possible in this scenario that the next user-supplied code module stepped into may not actually relate to the code that was in the process of being debugged. To avoid this invalid debugging behavior, the DebuggerStepperBoundary attribute, when encountered under this scenario, will escape from stepping through code and instead resume normal execution of the code.
So far, you have seen how you can modify the tooltip to show information that is more relevant to debugging your application. However, the attributes discussed so far have been limited in how they control what information is presented in the expanded tree. The DebuggerBrowsable attribute enables you to hide particular members, but there is no way to add more fields. This is where the DebuggerTypeProxy attribute can be used to provide you with complete control over the layout of the tooltip.
The other scenario where a type proxy is useful is where a property of a class changes values within the class. For example, the following snippet from the Customer class tracks the number of times the OrderCount property has been accessed. Whenever the tooltip is accessed, the CountAccessed property is incremented by one:
C#
public class Customer
{
    private int m_CountAccessed;
    public int OrderCount
    {
        get
        {
            m_CountAccessed++;
            return this.Orders.Count;
        }
    }

    public int CountAccessed
    {
        get
        {
            return this.m_CountAccessed;
        }
    }
}
Figure 41-8 illustrates the tooltip you want to be shown for the Customer class. Instead of showing the full list of orders to navigate through, it provides a summary about the number of orders, the maximum and minimum order quantities, and a list of the items on order.
The first line in the tooltip is the same as what you created using the DebuggerDisplay attribute. To generate the rest of the tooltip, you need to create an additional class that will act as a substitute when it comes to presenting this information. You then need to attribute the Customer class with the DebuggerTypeProxy attribute so the debugger knows to use that class instead of the Customer class when displaying the tooltip. The following code snippet shows the CustomerProxy class that has been nested within the Customer class:
C#
[DebuggerDisplay("Customer {CustomerName} has {Orders.Count} orders")]
[DebuggerTypeProxy(typeof(Customer.CustomerProxy))]
public class Customer
{
    private int m_CountAccessed;
    public int OrderCount
    {
        get
        {
            m_CountAccessed++;
            return this.Orders.Count;
        }
    }

    public int CountAccessed
    {
        get
        {
            return this.m_CountAccessed;
        }
    }

    public class CustomerProxy
    {
        public string CustomerName;
        public int NumberOfOrders;
        public decimal MaximumTotal = decimal.MinValue;
        public decimal MinimumTotal = decimal.MaxValue;

        public CustomerProxy(Customer c)
        {
            this.CustomerName = c.m_CustomerName;
            this.NumberOfOrders = c.m_Orders.Count;
            foreach (Order o in c.m_Orders)
            {
                this.MaximumTotal = Math.Max(o.Total, this.MaximumTotal);
                this.MinimumTotal = Math.Min(o.Total, this.MinimumTotal);
            }
        }
    }
}
There are very few reasons why you should create public nested classes, but a type proxy is a good example because it needs to be public so it can be specified in the DebuggerTypeProxy attribute, and it should be nested so it can access private members from the Customer class without using the public accessors.
On occasion, you might want to ignore the proxy type. For example, this might be true if you are consuming a third-party component that has a proxy type defined for it that disguises the underlying data structure. If something is going wrong with the way the component is behaving, you might need to review the internal contents of the component to trace the source of the issue.
In Figure 41-8, you may have noticed at the bottom of the tooltip was a node titled Raw View. Expanding this node displays the debugger tooltip as it is normally shown, without any proxy types or debugger display values.
In addition, you can turn off all type proxies in Visual Studio through the Tools
This part of the chapter looks at a feature in Visual Studio 2010 that can be used to help debug more complex data structures. Two of the most common data types programmers work with are Strings and DataTables. Strings are often much larger than the area that can be displayed within a tooltip, and the structure of the DataTable object is not suitable for displaying in a tooltip, even using a type proxy. In both of these cases, a visualizer has been created that enables the data to be viewed in a sensible format.
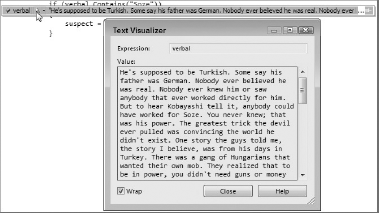
Once a visualizer has been created for a particular type, a magnifying glass icon appears in the first line of the debugger tooltip. Clicking this icon displays the visualizer. Figure 41-9 shows the Text Visualizer dialog that appears.
Before you can start writing a visualizer, you need to add a reference to the Microsoft.VisualStudio.DebuggerVisualizers namespace. To do this, right-click the project in the Solution Explorer and select Add Reference from the context menu. You should also add this namespace as an import to any classes for which you plan to create debugger visualizers.
Note
The version of Microsoft.VisualStudio.DebuggerVisualizers that ships with Visual Studio 2010 is valid only for projects that target version 4.0 of the Microsoft .NET Framework.
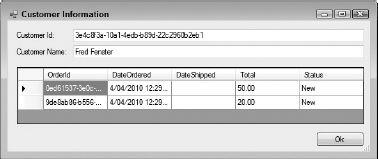
A visualizer is typically made up of two parts: the class that acts as a host for the visualizer and is referenced by the DebuggerVisualizer attribute applied to the class being visualized, and the form that is then used to display, or visualize, the class. Figure 41-10 shows a simple form, CustomerForm, which can be used to represent the customer information. This is just an ordinary Windows Form with a couple of TextBox controls, a DataGridView control, and a Button. The only unique aspect to this form is that it has been marked as Serializable, and its constructor has been changed to accept a Customer object, from which the customer information is extracted and displayed, as shown in the following code:
C#
[Serializable()]
public partial class CustomerForm : Form
{
    public CustomerForm(Customer c)
    {
        InitializeComponent();

        this.txtCustomerId.Text = c.CustomerId.ToString();
        this.txtCustomerName.Text = c.CustomerName;
        this.dgOrders.DataSource = c.Orders;
    }

    private void btnOk_Click(object sender, EventArgs e)
    {
        this.DialogResult = DialogResult.OK;
        this.Close();
    }
}
The next stage is to wire this form up to be used as the visualizer for the Customer class. You do this by creating the nested CustomerVisualizer class, which inherits from the DialogDebuggerVisualizer abstract class, as shown in the following code:
C#
[Serializable()]
[DebuggerDisplay("Customer {CustomerName} has {Orders.Count} orders")]
[DebuggerTypeProxy(typeof(Customer.CustomerProxy))]
[DebuggerVisualizer(typeof(Customer.CustomerVisualizer))]
public class Customer
{
    //...
    public class CustomerVisualizer : DialogDebuggerVisualizer
    {
        protected override void Show(
                            IDialogVisualizerService windowService,
                            IVisualizerObjectProvider objectProvider)
{
Customer c = (Customer)objectProvider.GetObject();
CustomerForm cf = new CustomerForm(c);
windowService.ShowDialog(cf);
}
}
}Unlike the type proxy, which interacts with the actual Customer object being debugged, visualizers need to be able to serialize the class being debugged so the class can be moved from the process being debugged to the process that is doing the debugging, and will subsequently be shown in the visualizer. As such, both the Customer and Order classes need to be marked with the Serializable attribute.
The Show method of the CustomerVisualizer class does three things. To display the Customer object being debugged, first you need to get a reference to this object. You do this via the GetObject method on the ObjectProvider object. Because the communication between the two processes is done via a stream, this method does the heavy lifting associated with deserializing the object so you can work with it.
Next you need to pass the Customer object to a new instance of the CustomerForm. Finally, use the ShowDialog method on the WindowService object to display the form. It is important that you display the form using this object because it will ensure that the form is displayed on the appropriate UI thread.
Lastly, note that the CustomerVisualizer class is referenced in the DebuggerVisualizer attribute, ensuring that the debugger uses this class to load the visualizer for Customer objects.
As a side note, if you write components and want to ship visualizers separately from the components themselves, visualizers can be installed by placing the appropriate assembly into either the C:Program FilesMicrosoft Visual Studio 10.0Common7PackagesDebuggerVisualizers directory (Program Files (x86) on 64-bit Windows), or the DocumentsVisual Studio 2010Visualizers directory.
Thus far, this chapter has covered how to display and visualize objects you are debugging. In earlier chapters, you learned how to modify field and property values on the object being debugged via the data tip. The missing link is being able to edit more complex data objects. The final section in this chapter looks at how to extend your visualizer so you can save changes to the Customer object.
When you created the CustomerVisualizer, you had to retrieve the Customer object from the communication stream using the GetObject method. This essentially gave you a clone of the Customer object being debugged to use with the visualizer. To save any changes you make in the CustomerVisualizer, you need to send the new Customer object back to the process being debugged. You can do this using the ReplaceObject method on the ObjectProvider, which gives you a CustomerVisualizer.
Before you can call the ReplaceObject method you will need to make some changes to pass the modified Customer object back to the visualizer. This has been done by saving the Customer object to an internal variable when it is initially passed into the class, and exposing this variable via a read-only property. This is shown in the following code:
C#
[Serializable()]
public partial class CustomerForm : Form
{
    public CustomerForm(Customer c)
    {
        InitializeComponent();

        this.txtCustomerId.Text = c.CustomerId.ToString();
        this.txtCustomerName.Text = c.CustomerName;
        this.dgOrders.DataSource = c.Orders;

        m_ModifiedCustomer = c;
    }

    private Customer m_ModifiedCustomer;
    public Customer ModifiedCustomer
    {
        get
        {
            m_ModifiedCustomer.CustomerId = new Guid(txtCustomerId.Text);
            m_ModifiedCustomer.CustomerName = txtCustomerName.Text;
            m_ModifiedCustomer.Orders = (List<Order>)dgOrders.DataSource;
            return m_ModifiedCustomer;
        }
    }

    private void btnOk_Click(object sender, EventArgs e)
    {
        this.DialogResult = DialogResult.OK;
        this.Close();
    }
}
You can now easily access the modified Customer object and save the changes back by calling the ReplaceObject method as shown here:
C#
[Serializable()]
[DebuggerDisplay("Customer {CustomerName} has {Orders.Count} orders")]
[DebuggerTypeProxy(GetType(Customer.CustomerProxy))]
[DebuggerVisualizer(GetType(Customer.CustomerVisualizer))]
public class Customer
{
    ...

    public class CustomerVisualizer : DialogDebuggerVisualizer
{
protected override void Show(
IDialogVisualizerService windowService,
IVisualizerObjectProvider objectProvider)
{
Customer c = (Customer)objectProvider.GetObject();
CustomerForm cf = new CustomerForm(c);
if (windowService.ShowDialog(cf) ==
System.Windows.Forms.DialogResult.OK)
objectProvider.ReplaceObject(cf.ModifiedCustomer);
}
}
}Note
An alternate method would be to use data binding for all of the Customer fields on the form with a BindingSource object. This BindingSource object could be exposed with a public modifier, thereby making it accessible from the visualizer class. All that is needed then is to set the Customer object as the DataSource of this BindingSource object by the visualizer class, and it will automatically synchronize changes back to the original Customer object.
Debugging applications is one of the most time-consuming and frustrating activities in the development cycle. In this chapter, you learned how you can take charge of Visual Studio 2010 by customizing the debugging experience.
Using debugging proxy types and visualizers, you can control how information is presented to you while you are debugging your application. This means that you can easily determine when your application is not functioning correctly and be able to trace the source of the issue.