

Allocating Resources to the Project
In this chapter we consider the problem of allocating physical and human resources to projects.* The physical and human resources are granted to and used by the project in order to meet the project's objectives. The amount of resources that can be allocated, of course, depends on the timing of the allocation as well as on the total supply of resources available for allocation. Mainly, resource allocation concerns how we allocate specific, limited resources to specific activities (or projects) when there are competing demands for the same limited resources.
Projects compete with each other for the same resources in two different ways. First, consider a resource that is limited but is not consumed when used, the services of a specific technical specialist for instance. The problem here is which project gets to use the resource first and which must wait. Second, consider a resource that is limited and is consumed when used, a specific chemical reagent for instance. In this case, the second project may have to wait until more of the reagent can be purchased and delivered. In both cases, the project that must wait may suffer a schedule delay that makes it late. Just as projects may compete for resources, different activities of the same project may compete. Two or more concurrent activities might require the same personnel, or equipment, or even work space. One activity will be given priority, and the other(s) must wait.
![]()
In order to manage resources in such a way as to optimize the use of a limited supply, trade-offs must be made. The interaction of project scheduling and resource scheduling is clear, but we will examine several different solutions to the allocation problem. Those include the Critical Path Method (CPM), Goldratt's “critical chain” (1997), and many different priority rules for allocating scarce resources. The primary cause of concern is resource scarcity. If some resources (including time) were not scarce, the resource allocation problem would be concerned solely with profit maximization—a relatively easy problem.
![]()
In Chapter 5 we evaluated project durations solely in terms of time. A project was either on time or not. Now we must also consider when and for what purposes scarce people, equipment, material, and facilities are used. The PM's performance is judged by the skill with which the trade-offs of time, resources, and scope are managed, so the PM must make constant use of cost/benefit analysis. There are countless questions to be answered. “If we come in late on this project, we face a $1,000 per day penalty. How much project slack do we need and what resources at what costs are required to get it?” “If I hire Cheatem Engineering Associates as design consultants, can I improve project performance by 3 percent without extending the project's due date?” “Adding project slack and hiring a consultant require monetary resources that could be used for other things. Are these the best uses for the dollars?”
At times, the PM is asked to take on a project in which there are the usual time, budget, and scope goals, but which also constrain the trade-offs that the PM may wish to make if required to help the project meet its most important goals. For example, some projects are time constrained and must be completed by a fixed time. In such cases, resources (and possibly performance) are variable. Some projects are resource constrained and cannot go over budget or use more than a fixed amount of a specific resource. In these cases, time (and possibly performance) is variable. Occasionally, a senior manager suffers from a case of the micromanagement virus and fixes time, cost, and scope, thereby leaving the PM with no flexibility whatsoever. Such projects are certain to fail unless the micromanager has been profligate with the firm's resources, which is highly unlikely for micromanagers. The fault actually lies with the PM who accepts command of such a project. (For those who are thinking that such a PM may find him- or herself without a job following a refusal of an assignment, we would note the senior manager in question is insuring that the PM will fail. Do you want to work for someone who will not allow you to succeed?)
We will start our tour through the wilds of resource allocation by reconsidering the problem of dealing with a pointy-haired boss who insists that a project be completed in much less time than its expected duration.
6.1 EXPEDITING A PROJECT
The unreasonable boss problem in Chapter 5, Section 5.2 could be used as our example here, but a smaller problem will help avoid unnecessary arithmetic. Our problem is set in a deterministic world rather than in a probabilistic one, for the same reason. (Please remember that in reality all projects are carried out under conditions of uncertainty.) Finally, we must also take note of an assumption usually adopted when activities are scheduled, as we did in Chapter 5. That assumption is that all estimates of task duration, whether deterministic or probabilistic, are based on normal or standard resource loadings.
The Critical Path Method
In traditional PERT/CPM, the rules of “standard practice” apply and the normal task duration estimate is made with the normal or standard-practice resource usage. Then a second estimate, referred to as the crash duration, is made based on the resources required to expedite the task. More resources of the type already used might be added; more workers and shovels if there is a ditch to be dug. On the other hand, the technology used to dig the ditch might be totally altered, utilizing a backhoe or a Ditch Witch®, for example. When making estimates for crashing, it is important to make sure that the resources required to crash the project are, in fact, available. Using a machine to dig the ditch in three hours instead of the 3 days required for a worker with a shovel is dependent on the fact that the machine is available and can be on site when needed. (Of course, the warning about resource availability applies equally to normal resource requirements as well as to crash requirements.) There are times when the PM may expedite activities that have little or no impact on the network's critical time, such as when the resources used must be made available to another project. It is important to remember that when we change technology, we may also be changing the level of risk in carrying out the activity. Finally, we must remind ourselves that some tasks cannot be crashed. One must not assume that because it takes one woman 9 months to carry and bear a child that nine women can accomplish the same result in 1 month.
![]()
Consider the project described in Table 6-1. There is a set of activities, predecessors, normal task duration estimates, crash duration estimates, and estimates for normal cost and crash cost. One crash duration is marked with a single asterisk. For this activity, the task may be carried out in normal time or crashed 1 day at a time. Another activity is marked with a double asterisk. In this case, the duration must be one or the other; it cannot be broken down to 1-day segments. Activities are charged at the “cost per day” (activity slope) increments shown in the last column. A given activity may have only two or three technically feasible durations. If an activity cannot be split into 1-day segments, the cost is as indicated. The “slope” information for non-or-partially segmented activities is normally given in the slope chart. Activity slope is computed as follows:
![]()
When crashing a project, starting with the normal schedule for all project activities, crash selected activities, one at a time, to decrease project duration at the minimum additional cost. To crash a project, follow two simple principles: First, focus on the critical path(s) when trying to shorten the duration of a project. Crashing a non-critical activity will not influence project duration. Second, when shortening a project's duration, select the least expensive way to do it.
Given these guides, consider the network shown in Figure 6-1(a) that was constructed from the data in Table 6-1. It is easier to illustrate the impact of crashing on an activity-on-arrow (AOA) network than on an activity-on-node (AON) network, so we use that approach here. Also, we use dummy activities in this case not to illustrate precedence but to show time durations and slack on the time axis.
As indicated in Table 6-1, activity d can be partially crashed for $30, but it is not on the critical path and will not shorten the project. Activity e involves a technological discontinuity and must take either 3 days to complete at $10 or 1 day at $80. In general, the impact of having such a technological discontinuity is that the best solution for crashing n days might not be part of the best solution for crashing n + 1 days. Rather, it may be best to crash the activity with the technological discontinuity at n + 1 days and not crash another activity that could be crashed for n days. This situation is illustrated in the discussion that follows.
Table 6-1 An Example of a Normal/Crash Project


Figure 6-1 A PERT/CPM example of crashing a project, AOA network.
The network's critical path is a-b-e, the project duration is 8 days, and the normal total cost is $120, as illustrated in the network of Figure 6-1(a). The decision about which activities to crash depends on how much we need to reduce the duration of the project. To reduce the total network duration by 1 day, we must reduce the time required by one of the activities along the critical path. Inspecting Table 6-1 to see which critical activity can be reduced at the least cost, we find it is activity a, which adds $40 to the project's current cost of $120. Activity b could be crashed at an added cost of $60 or we could even crash e 2 days for an additional cost of $70. Of course, crashing e would only shorten the project duration by 1 day because when e is shortened, the path a-d-dummy, 7 days long, becomes the critical path and does not allow the project to be shortened to 6 days. Of the three options, crashing a is the lowest cost and therefore preferable, see Figure 6-1 (b). Notice that crashing a also shortens a-d-dummy and a-c-dummy by 1 day.
Suppose the project must be crashed by 2 days. What are the options? Reconsidering Table 6-1 and Figure 6-1(a), we see that we could crash activity e for 2 days ($70), but path a-d-dummy (7-days' duration) must also be crashed at least 1 day. We choose d ($30/day) because it is cheaper than a ($40). The total cost of crashing is $100, and the total project cost is $120 + $100 = $220. Alternatively, we could crash a and b, also for a cost of $100 ($40 + $60). Arbitrarily, we choose the latter option [Figure 6-1(c)].
Now suppose we wanted to crash the project by 3 days, from the original 8 days down to 5 days. Clearly e must be crashed by 2 days, costing $70, and a or b by a day. We choose a, the cheapest, for an additional $40. This leaves d to be crashed by 1 day for another $30, resulting in a total crashing cost of $140 and a project cost of $120 + $140 = $260 [Figure 6-1(d)]. Note that we did not crash b this time, as we did for 6 days. This is due to the technological discontinuity in activity e.
Last, let us consider crashing the project by 4 days down to a project duration of 4 days. Since we crashed e, the technological discontinuity, to reach a 5-day duration, all the remaining activities can be incrementally crashed. Thus, we can simply inspect Figure 6-1(d) to see what else needs incremental crashing to reduce the project by another day. Notice in Figure 6-1(d) that a-b-e and a-d-dummy are both critical paths. Only b and d can still be crashed so we crash each by 1 day for an additional cost beyond the 5-day schedule of Figure 6-1(d) of $60 + $30 = $90 for a total project cost of $260 + $90 = $350 [Figure 6-1(e)]. Note that c is now critical; therefore, all paths are critical. Since the critical paths a-b-e and a-c are at their full extent of crashing, the project duration cannot be further reduced, even though activity d could be crashed another day. Thus, Figure 6-1(e) is not the all-crash network, although it equals the all-crash time schedule of 4 days.
Whether all this crashing is worthwhile is another matter. On the cost side, Figure 6-2 shows the time/cost relationship of crashing the project. On the benefit side, some projects have penalty clauses that make the parent organization liable for late delivery—and sometimes bonuses for early delivery. Starting at the right (all-normal) side of Figure 6-2, note that it becomes increasingly costly to squeeze additional time out of the project. Charts such as the one shown in Figure 6-2 are useful to the PM in exercising control over project duration and cost. They are particularly helpful in dealing with senior managers who may argue for early project completion dates with little understanding of the costs involved. Similarly, such data are of great benefit when clients plead for early delivery. If the client is willing to pay the cost of crashing, or if the firm is willing to subsidize the client, the PM can afford to listen with a sympathetic ear. (While we advise the PM to ignore overhead costs over which he or she has no control, it should be noted that indirect costs are often altered when a project is crashed.)
One final note on crashing projects. The same method is used when the task durations are probabilistic, that is, using three time estimates. In this case, optimistic, most likely, and pessimistic activity duration estimates are made for the “normal” resource loading and new optimistic, most likely, and pessimistic duration estimates must be made for crash resource loading. The PM should remember that the variance of both the normal and crash activity times largely depends on the technology used to accomplish the activity in question. Thus the variance of the normal activity time may be quite different from the variance of the crash time. The project budget can be determined in exactly the same way. The solution to project duration and resource cost levels can be reached by using the standard analytical method used in the last chapter, or by simulation, also described in Chapter 5.

Figure 6-2 CPM crash cost-duration history.
Fast-Tracking a Project
In addition to crashing a project in order to expedite it, a project may also be fast-tracked. Used primarily in the construction industry, the term refers to an expediting technique in which the design and planning phases of a project are not actually completed before the building phase is started. Usually design and plan are finished before the building is started (referred to as the “waterfall” approach), so letting them overlap reduces project duration—if the fact that design and planning are incomplete does not result in a significant amount of rework and change orders during the building phase.
For many projects in construction, maintenance, and similar areas, a large proportion of the work is routine. In these cases, fast-tracking rarely causes serious problems. The number of change orders in fast-tracked construction projects is not significantly different from that for similar projects that were not fast-tracked (Kurtulus and Narula, 1985).
Project Expediting in Practice
Expediting can occur in three different ways. First, the PM may know ahead of time that this is a time-critical project and will need to take steps to finish the project as early as possible. Second, the PM may get the word during the execution of the project that the due date has had to be moved up. Or finally, something happens during the project to delay some activities so that the due date is going to be missed. In all cases, the sooner the PM knows that the project needs to be expedited, the more opportunities there will be to bring the project in ahead of time, or on time if a delay occurred. Whenever it appears that the project may be later than the stakeholders expected, it is imperative that the stakeholders be informed immediately and kept apprised of the follow-on developments as they occur. We can divide the opportunities for expediting a project into those that occur before the project begins and those that are available once the project is under way.
Opportunities Before the Project Begins First, it is worth noting that most of the time in practice, projects are not planned using the three-time method of estimating (i.e., optimistic, most likely, pessimistic). Instead, PMs simply try to get a reasonably accurate estimate of each activity time from those who will be responsible for the activity or, failing that, estimate the time themselves. Then, after they determine the critical path, they often add a cushion or “buffer” to the critical activities' times in case they turn out to be too optimistic (i.e., short). Next, to account for the possibility that other paths may turn out to be critical instead, a project time contingency, which is noted as such, is added as well.
Also, they may try to identify the “key” activities and deliverables (that is, those that have the biggest effect on the schedule or success) and plan to monitor those especially closely. To be safe, they may even order the long-lead time items early, or arrange for possible airlifting of those items if expediting is later deemed necessary.
Opportunities When the Project Is Underway If the need to expedite occurs once the project is underway, there are many actions PMs may try in order to expedite the project, as follows:
- First, they will focus on the critical path and see if there is any way to shorten it. If they haven't already, they will identify the key activities that would help expedite the project and manage those extremely closely, making sure that they don't use up their activity time cushions/buffers.
- In a similar vein, they may request permission to use some of the contingency time they budgeted for the project.
- They may pull resources from less critical activities, activities with a surplus, or just chronologically later activities, to apply to more critical, earlier activities.
- Similarly, they may move later activity time cushions/buffers up to earlier, more critical activities.
- They may try to shorten, or even skip, certain steps like testing, documentation, or training.
- They may postpone activities that involve non-core team members, or other stakeholders.
- They may move some activities to a post-project phase, such as installation, implementation, or service.
- They may see what activities they can “fast-track” (run in parallel), or even what activities can be done early or ahead of time (e.g., on weekends), which most commonly are those that do not involve the user or other stakeholders.
- They will try various forms of “compression” such as pressuring the team to work harder or faster, or get permission for overtime.
- They may attempt to get additional resources, either money for overtime or additional people to work on the project.
- They may seek permission to reduce the scope of the project, so the critical deliverables can occur on time.

- Finally, for PMs with lots of experience with projects such as these, they may simply choose to wait and see if something comes up later that allows them to make up the time. (Less-experienced or younger PMs are typically too risk averse and have less self-confidence to try this.)
When task durations are estimated, an assumption is made that task resources are set at “normal” levels. This is the “standard practice” assumption. Traditionally, CPM project duration estimates also include a “crash” estimate together with estimates of the crash time and the resources required to shorten the duration of project activities. By selectively choosing which activities to crash and by how much, we can determine the minimum cost for all possible project completion times.
6.2 RESOURCE LOADING
From the first day on the job, the PM is concerned with resource loading. Resource loading refers to the amounts of specific resources that are scheduled for use on specific activities or projects at specific times. It usually takes the form of a list or table. Figure 6-3 is an MSP-generated project plan and Gantt chart of a project aimed at producing a short documentary DVD. Task names, WBS numbers, durations, finish dates, and the resource requirements for each step in the process are shown. (Precedences are not listed, but they are illustrated on the Gantt chart.)
After the project plan was developed, the PM confirmed the availability of each required resource, and obtained schedules for each. MSP allows the PM to create an individual availability calendar for each resource on the project. From these calendars, resource schedules are automatically generated, and Table 6-2 shows the schedules for several of the required resources. (Any resource not shown in Table 6-2 works a 5-day week, 8:00 AM to 5:00 PM with an hour off for lunch, usually 12 PM–1 PM, without exceptions during the period of the project.) Among other things, the PM noted the following:
- The scriptwriter is available to work 6 days per week, and 9 hours per day.
- The editing room has limited availability, 9:30 AM to 3:00 PM each day.
- The client, whose input is required for several activities, will be on vacation between April 13 and April 20.
When the calendars for each resource were entered into MSP's database for the project, the project schedule was recalculated. The revised plan is shown in Figure 6-4. Note that the project completion date has been extended from May 31 to June 11. The client's vacation and the availability of the editing room are major contributors to the extension.
From the project plan, the new schedule, and the list of resources required, a resource-loading table was derived by MSP; see Table 6-3. As we noted earlier, a project's resource loading is a list of the amounts of various specific resources that are scheduled for use on specific activities at specific times during the life of the project. A brief study of the data in Table 6-3 reveals that in the first week of the project [Wednesday through Saturday (March 1–4)] the scriptwriter is overallocated. During the first 6 days of the project this person is scheduled to work 94 hours. That seems a bit much, not allowing time for eating, sleeping, and all of life's other activities. The scriptwriter's first full week is overallocated by 40 hours. The producer's first week is also overallocated at 40 hours. Something must be done, and it will be discussed in the next section.

Figure 6-3 Project plan and Gantt chart for production of a short documentary film (MSP).
Table 6-2 Resource Availability Calendars for Selected Resources for Documentary Film Production (MSP)


Figure 6-4 Gantt chart for DVD project, adjusted for client availability (MSP).
Table 6-3 Resource Loading Chart for DVD Production (MSP)
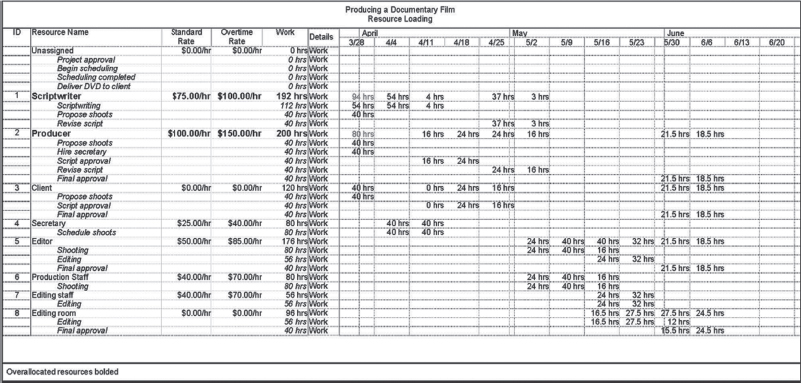
An examination of this table reveals an interesting anomaly in MSP and most other project management software. Unless specified otherwise, MSP assumes that any resource assigned to an activity will work on that activity 100 percent of the time available on the resource calendar. For example, Figure 6-3, WBS 3.2, “Propose shoots” lists the client as a resource (in addition to the producer and scriptwriter). The activity is scheduled to take 5 days. The PM is aware that in all likelihood the client will only be needed to attend one or two meetings (an hour or two each) to approve or amend the shoots proposed by the producer and scriptwriter. Nonetheless, the resource-loading table (Table 6-3) indicates that the client will spend 40 hours (5 days at 8 hours/day) on the activity.
Were this a large project with a large number and variety of resources, it might be necessary to correct this “error.” MSP and other software packages have several ways to do this. The PM could allocate a specific percentage of a resource's time for work on the project, or could restrict the availability of the resource on the calendar, for example. In this case, however, because the client has no cost per hour, and because everyone involved in the project, including the client, understands the nature of the client's work, the matter can be ignored.
Quite apart from problems in scheduling the activities, there are other resource-loading issues that may face the PM. For instance, there are cost and management issues that must be considered. It is easy to overutilize resources, particularly human resources; note the hours required of the scriptwriter and producer during the first days of the project. For hourly workers, overtime work is usually quite expensive. In the case of the scriptwriter, overtime hours are not sufficient, and another writer may be needed for the first 1 or 2 weeks. On the other hand, it is common to find middle managers consistently working 45–60 hours per week—if they have a desire for upward mobility. In the software industry or in architecture, to pick two typical examples, individuals often work 60–80 hours per week or more in order to complete specific projects on time. Because we usually overload our best people, they are the ones most apt to quit and go elsewhere—and they rarely tell us why in their exit interviews. For most senior executives, the workloads are often very heavy—consistently 65–70 or more hours per week. These are the people who are overstressed at the very times they must make momentous decisions.
Such resource-loading documents as Table 6-3 are among management's most frequent requests of the PM, precisely so they can monitor such situations. As we will see in the section on resource leveling, managers sometimes make incorrect assumptions about the capacity of work groups, and the PM must take on an educational role.
The Charismatic VP
The Vice-President and Manager of a division of a large chemical company became aware that a number of projects he had assigned to his subordinates were not being completed on time. Some were finished late, and others were simply unfinished. The VP was tireless, spending 60–80 hours per week at work. He was very well liked, and his people tried hard to please him. If he asked a subordinate if a task could be handled, invariably the answer was “Yes.”
The VP began to suspect that he was overcommitting his subordinates. He suggested this to his people, but most of them insisted that they could handle the work. Not entirely convinced, the VP installed a project-oriented management system and initiated resource-loading reports for all personnel doing project work. The reports showed clearly that the division had an urgent need for additional staff engineers.
As is typical of such cases, the individuals most overworked were the most experienced and most skilled people. Those engineers with spare time were the least skilled and, for the most part, recent hires. The untrained remained untrained. The Vice-President, however, altered work assignments and ordered that additional engineers be hired. Overscheduling was limited to 125 percent (50 hours per week), and at that level for a limited time only. A policy of partnering new engineers with experienced cohorts was instituted. Within 6 months, division projects were progressing reasonably on time.
Resource loading is usually displayed as a list of the amounts of specific resources assigned for use on specific project activities at specific times, or as a graph showing the level of a resource's capacity required against the project calendar. To be useful for scheduling, the resource must have a calendar showing the resource's availability. The calendar should include hours—and days—worked each week, any holidays on which the resource will not be available, and any other information affecting the availability of the resource. Resource cost per unit of usage should be included on the calendar, plus any additional cost for overtime or overuse. Overscheduling a resource may cause serious problems for the PM.
6.3 RESOURCE LEVELING
Look once again at Figure 6-4. Tasks 2, 3.2, and 3.3 are all scheduled to start on March 29. The scriptwriter is required for the first two of the three items and the producer for the last two. The scriptwriter's calendar (Table 6-2) indicates that the scriptwriter can work a 54-hour week—6 days per week at 9 hours per day. The producer is available for a standard 40-hour week. The resource-loading table (Table 6-3) shows the above-mentioned tasks assigned to the scriptwriter and producer. Apparently both are expected to do two different jobs at the same time.
The scriptwriter's conflict must be reduced. Figures 6-5 and 6-6 illustrate the problem clearly. Both illustrations are MSP outputs. Figure 6-5 lists all tasks for which the scriptwriter is scheduled. Figure 6-6 indicates that the scriptwriter is overallocated by a factor of 2 during the period from March 29 to April 2.*

Figure 6-5 Resource overallocation report for scriptwriter showing all activities (MSP).
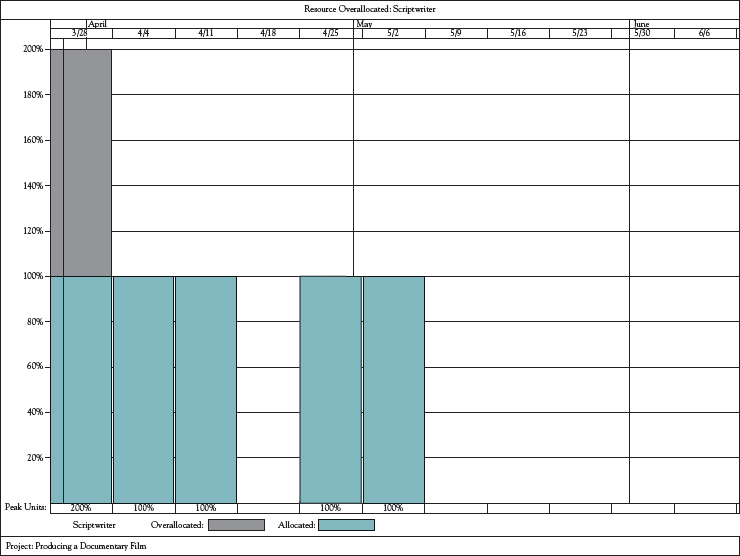
Figure 6-6 Graphic resource overallocation report for scriptwriter (MSP).
Figure 6-5 also shows considerable slack in WBS 3.2. If we ask MSP to level resources, the software will move activities so that resources do not exceed their capacities—and will do so by using available slack first, where possible, rather than extending the project duration. (Clearly, the PM could do the same thing manually, but the job becomes complex and time-consuming on all but small projects.) Figures 6-7 and 6-8 show the effect of resource leveling on the scriptwriter's workload. In this case the project duration was not affected because there was sufficient slack in WBS 3.2, and the leveling operation used it. (PMBOK covers the topic of resource leveling in Chapter 6 on Time.)
![]()
To understand Figure 6-7 correctly requires an understanding of MSP. The figure appears to report that the scriptwriter is still working overtime on Tasks 2 and 3.2. This would also mean that there was an error in Figure 6-8 that shows no such thing. The scriptwriter's efforts are, in fact, solely devoted to scriptwriting (Task 2), but the producer and the client are working on Task 3.2, so the task is shown as being underway. MSP has split Task 3.2, and the scriptwriter begins work on the task on Monday, April 12 after work on Task 2 has been completed. The second part of Task 3.2 does not begin until all work on Task 2 is complete. It is easy to verify that this has happened. Figure 6-9 shows the resource allocation, after leveling the scriptwriter's workload, using a daily calendar. The scriptwriter is not assigned more than 9 hours per day. On Monday, April 12 work transfers from Task 2 to Task 3.2.
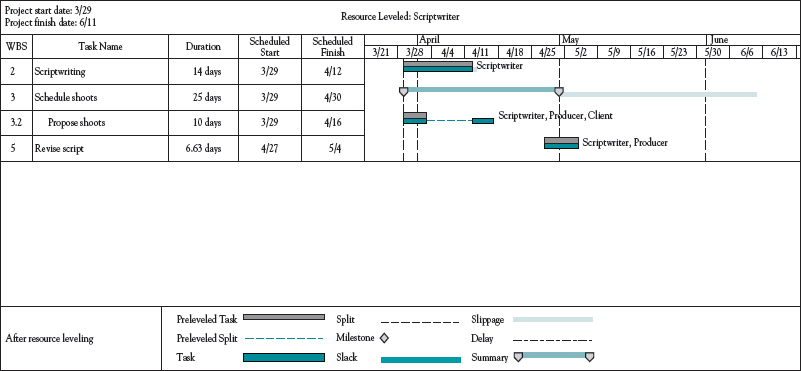
Figure 6-7 Resource leveled report for scriptwriter showing all activities (MSP).
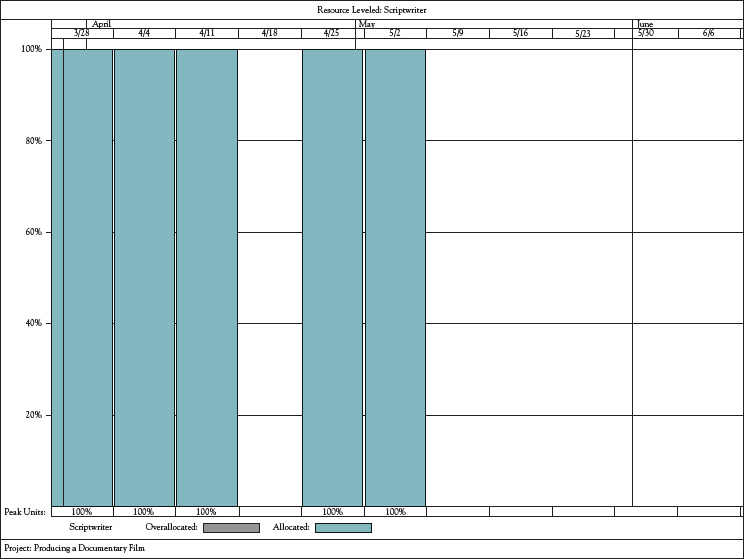
Figure 6-8 Graphic resource leveled report for scriptwriter (MSP).
The problem of the still overallocated producer is another matter. This is the same problem we discussed above concerning the client's need to attend some meetings. The fact that the producer is overscheduled is not really a problem. Neither of the conflicting tasks (WBS task 3.2 and 3.3) requires 8 hours per day of work by the producer. The duration of 5 days for Task 3.2 (Propose shoots), for example, indicates that the producer will be spending some time during a 5-day period on the job of proposing locations and settings for filming. Similarly, Task 3.3 (Hire secretary) will require the producer to interview some candidates for the secretarial position during the same 5-day period, but this will not be a full-time job either. The 5-day durations are an indication of when the tasks are expected to be complete. Task duration is not necessarily dictated by the amount of labor required to complete the task, but by the calendar time required to complete it. Sometimes, of course, the amount of labor may be the determinant of calendar time, but often it is not.
At this point a short digression is appropriate. As a student of project management reading this book, you probably know little of the reality of the projects used here as examples of this or that project management problem. As a PM working on a real-world project, you know a great deal more about the reality of your project than could possibly be explained in this book on the subject. The PM of the documentary project knows that there will be no problem raised by the apparent conflict in the allocation of the producer's time. The PM could have used one of the methods we noted in the discussion of resource loading to handle the matter, but elected not to take the time and effort. This, then, is another of the trade-offs the PM must make. Not every facet of a project requires equal managerial care. The PM must decide where to expend his or her managerial efforts—and then take responsibility for the decision.
![]()
Table 6-4 Daily Resource Loading Chart for DVD Project, Scriptwriter Leveled (MSP)
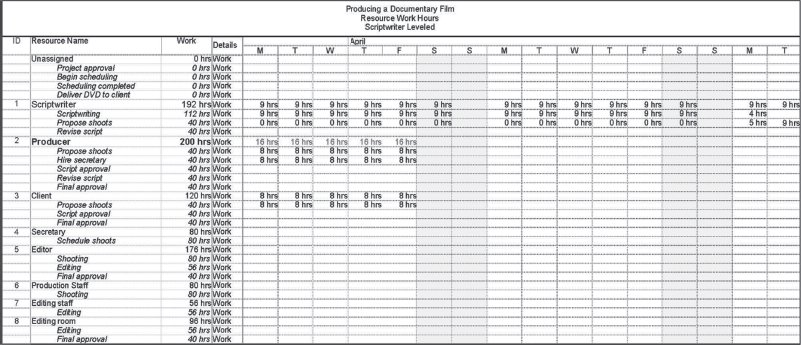
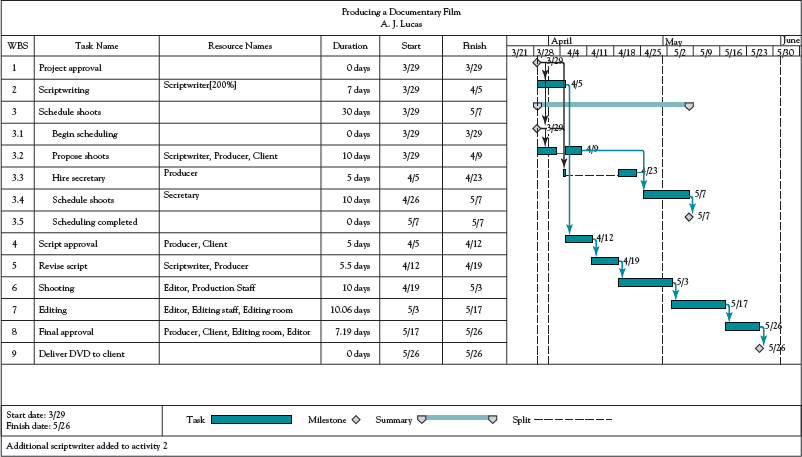
Figure 6-9 Final DVD project Gantt chart schedule, with two scriptwriters and producer leveled (MSP).
A resource allocation decision may be intended to avoid future problems rather than to cure a present problem. While the scriptwriter is not overallocated, the PM decided to add a second scriptwriter to WBS 2. The PM also leveled the producer's apparent overallocation just to add some slack to the producer's schedule. Both of these additions were made to ensure that the project was not made late by a glitch in the producer's work or in the scriptwriting activity, which is on the project's critical path. (See Section 6.5 for additional information about the advisability of having some excess capacity in projects.) The result of all these moves is seen in Figure 6-9. The project can be finished 2 weeks or 16 days earlier than indicated in Figure 6-4.
When resources are added to a project, the PM may be asked to explain just how the project budget came to be underestimated. To answer such a question, the PM would be well advised to contact the administration of any large city that has recently built a sports stadium.
A more or less steady state demand for human resources is highly desirable—if it is not seriously inconsistent with the technological demands of the project. The cost of adding, laying-off, or permanently releasing human beings is very high for both hourly and salaried personnel. If the parent organization is quite large and is operating many projects that have reasonably high commonality in their demand for certain skills, it is often possible to set up “pools” for such skills as clerical, machine operation, and similar types of workers. When pools are used to supply resources for projects, careful records must be kept to ensure fast determination of skill availability and that the proper charges are made to all projects.
Pools of like resources from which labor can be added temporarily to projects tend to cut costs for the firm as a whole. Pools also cut the cost of managing the project. The PM's job is made easier, and the cash flows of the project are less volatile. The PM will spend far less time trying to find and recruit personnel. Such pools, however, are useful only if the labor is not subdivided into highly specialized subtasks. Secretarial skills are less specialized than, say, the skills required to design, generate, or test computer software. The conclusion is that secretarial pools are feasible, but that software design, generation, and testing should be done by “teams” in which the required specialists are available.
Resource Loading/Leveling and Uncertainty
Figure 6-10 is a resource-loading chart for a software engineering group in a large firm. The chart depicts the total number of hours required of a resource group (all members from one department assigned to the firm's projects) displayed against the group's capacity. (MSP resource-loading information was exported to an Excel® spreadsheet and displayed graphically. The process of producing such displays is not difficult.) There are 21 members of the group. They are scheduled for 40 hours per 5-day week by the firm. Figure 6-10 covers a 34-week period. The graph shows estimated work-hours (28,282) committed by this team for projects that are currently on the company's books. The delivery-date commitments are such that group workloads exceed the group's capacity through much of March and April, for a brief period in the middle of May, and again in the latter part of June. (The total of these overloads is 1,747 hours, or a bit more than 83 hours per person.)
A rough estimate of group capacity is
21 (people) × 40 (hours per week) × 34 (weeks) = 28,560 labour-hours
But a few corrections are in order. There are three national holidays in the period: Memorial Day, the Fourth of July, and Labor Day. The time lost for the holidays is
21 × 3 (days) × 8 (hours) = 504 labour-hours
which lowers capacity to 28,056 labor-hours. Assume further that 11 people take a 2-week vacation during the 34-week period, a conservative assumption given the fact that the period includes May through September. The time for 11 vacations is an additional capacity loss of
11 × 2 (weeks) × 40 = 880 labor-hours
There are now 28,056 — 880 = 27,176 labor-hours available, and even if the group's work were evenly distributed across the 34-week period, the team's capacity is about 1,100 less than the scheduled demand for work. The workload is 28,282/27,176 = 1.04 or 104 percent of capacity.
A 4 percent shortage of capacity does not seem like much. Why not increase the hours worked per week for these salaried software engineers to 41.6 hours per week? The added capacity will (roughly) equal the estimated workload. While such a move might help, it would not begin to solve the problem. For instance, is it likely that no engineers in the group will be ill and absent on any of the 170 workdays? Is it likely . . . no; is it possible that every task the group is scheduled to perform will be ready for the group's work exactly on schedule? Is it possible that all required facilities and equipment will be available when needed? Is it possible that there will be no change orders extending the time required for any phase of the work the group is committed to complete? In reality, the probability that any of the above conditions will be met is, as mathematicians are wont to say, vanishingly small. But even if they were met, what about that large bulge of work required in March and April?
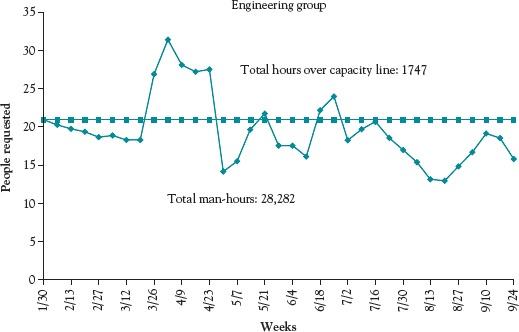
Figure 6-10 Thirty-four-week resource loading chart for a software engineering group (MSP and Excel®).
For many years, the study of Operations Management has included the subject of “line balancing.” (See Meredith and Shafer, 2013, pp 55 ff.) The purpose of line balancing is to construct a manufacturing production line such that the individual production units on the line can generate the required amount of product with as little excess capacity as possible. Minimizing excess capacity in the elements of a production line is one test of production line efficiency. This concept, when applied to the resources used by projects—as it often is—is a precursor to disaster. Even in production lines, some excess capacity is required to deal with minor problems and variations that arise during the production process. In projects, the level of uncertainty surrounding the “production process” is so much greater that the amount of excess capacity in the work force needs to be much larger. If this flies in the face of managerial instinct, it is because that instinct is sometimes in error. We will revisit this problem in the following section.
The result of the situation displayed in Figure 6-10 is that all the projects to which this team of engineers is devoted are going to be late and over budget unless some drastic steps are taken to prevent it. The firm in question is known for high-quality work, and it is assumed that the projects will be completed more or less on time with a reasonable percent of the promised specifications in place and working. How this comes about is quite simple. Engineers in this firm are scheduled to work a 40-hour week. They do not, however, work 40-hour weeks. They average between 50 and 60 hours per week. At a 55-hour week, for example, the capacity of the group is approximately 37,500 labor-hours. Given the 28,282 labor-hour workload, the system would operate, on average, at about 75 percent of capacity—which explains the engineering group's ability to meet most of its delivery-date commitments.
Most project management software will, when asked politely, level out the loads (usage) for individual resources and warn the PM when a resource is scheduled for greater-than-capacity workloads. Whenever possible, the leveling will utilize any available activity slack rather than extend the duration of the project. When a resource is assigned to an activity, it is assigned for 100 percent of its availability unless the PM specifies otherwise.
It is often necessary to have significant excess resource capacity on projects because of the uncertainty that exists in all projects. Dealing with this issue is a major reason for the installation of a competent risk-management system.
![]()
6.4 ALLOCATING SCARCE RESOURCES TO PROJECTS
When we leveled resources in the case of the overworked scriptwriter, MSP simply used the available activity slack to reschedule WBS item 3.2 (see Figure 6-9). The project completion date was not altered because the WBS 3.2's slack was large enough to swallow the added time. Often, that is not possible and the software needs instruction about what priority to use when allocating scarce resources to several tasks—which tasks should get the resources immediately and go first, and which may be delayed. In order to select a suitable method for assigning priorities, we need to understand how the problem is solved.
Most solutions start with the PERT/CPM schedule. Given this initial solution, each activity is examined period by period and resource by resource. If the demand for a resource exceeds its supply, the software considers the tasks one by one and assigns resources to the tasks according to some priority rule chosen by the PM. Tasks that receive resources under this rule proceed as originally scheduled. Tasks that do not get resources are delayed until ongoing tasks are completed and the required resources are freed-up for use. If this increases the project duration, the change will be visible on the project's Gantt chart or network as it was when the videotape project client was not available while on vacation. (See Figures 6-3, 6-4, and 6-9.) No matter what priority rule is used, the project's technology always takes precedence.
Some Comments about Constrained Resources
Every time a project falls behind schedule, the PM is apt to plead for more resources. In spite of the PM's complaints about the scarcity of resources, serious cases of resource scarcity rarely apply to resources in general, but rather to one or two very specific resources. We call such resources “Walts.” The term was derived from the name of an individual, Walter A., who is employed by a large insurance company. Walt is a specialist in the rules and laws affecting insurance policies for certain types of casualty losses in the firm's commercial lines of business. He has an excellent analytical mind and many years of experience. His knowledge is required when designing new policies in this area of risk. The firm has only one Walt, and while the firm is training others, such training takes years. Walt is a true scarce resource. Projects requiring Walt's input are scheduled around his availability.
There are many other examples. Military combat missions may be scheduled around the availability of attack aircraft. Construction projects may be scheduled around the availability of a large crane. A Broadway opening may be scheduled around the availability of a star actress. The key problem to be solved is deciding which activities get the scarce resource and in what order.
Some Priority Rules
There are many possible rules for assigning preference to some activities over others when allocating scarce resources. Most popular project management software packages have a limited number of rules that can be automatically applied to level overallocated resources so many of the priority rules for assigning scarce resources to activities may have to be applied manually. Fortunately, as we will see, this is not as difficult as it might seem. Several of the most commonly used rules are as follows:
As soon as possible—This is the standard rule in scheduling. Activities are scheduled to start on their earliest start times (ES), and resources are made available with that in mind.
As late as possible—With this rule, resources are made available so that activities start on their latest start times (LS) whenever possible without increasing the project's duration. This may seem irrational, but it preserves the firm's resources and delays cash outflows as long as possible. This rule is also compatible with Eliyahu Goldratt's contention that the “student syndrome” leads workers to delay starting an activity until the last possible moment (Goldratt, 1997, Ch. 13).
Shortest task duration first—Always consistent with technological precedences, shorter tasks are given priority over longer tasks. This rule maximizes the number of tasks that can be completed by a system in a given time period.
Minimum slack first—Tasks are supplied with resources in inverse order of their slacks. This rule usually minimizes the number of late activities.
Most critical followers—The number of successors on the critical path(s) for each activity is counted. Activities with a higher number of critical successors take precedence. The rationale here is that such activities would cause the greatest damage to the desired project schedule if they are late.
Most successors—The same as the previous rule except that all successors are counted. This rule has the same rationale as the preceding rule.
Most resources first—With this rule, the greater the use of a specific resource on a task, the higher the task's priority for the resource. This rule is based on the assumption that more important activities have a greater demand for scarce resources.
In addition to these rules, there are many others. For example, it may be company policy to put favored customers' projects at the head of the resource line—or to reserve special resources for such clients by withholding them from the available supply. The same type of favoritism is sometimes shown to specific projects of high value to the parent firm. (Some firms show favoritism to specific high-value activities, but this rule makes little sense because all activities of an individual project must be completed to finish the project.) Application of a value measure for allocating scarce resources across several projects is both rational and common.
There are many other priority rules that might be used, but most project management software packages recognize only a few; however, assigning scarce resources manually is not difficult. From our earlier example, recall Figure 6-5, in which all tasks requiring the scriptwriter were listed alone on a Gantt chart showing the task duration, scheduled start, scheduled finish, activity slack, and other needed information. The scheduled start dates would allow us to apply either the early or late start rules. Information on activity slack allows us to use the minimum slack rule. Task duration is the necessary input to apply the Shortest Task Duration rule. The project network, Gantt chart, and the task list all allow a simple count of followers, critical or not. MSP and most other project management software allow verbal or numeric priorities to be assigned easily. This allows the use of any priority system required.
Considerable research has been done on these rules* and the minimum slack rule is usually best or second best. It rarely performs poorly. If a high-slack task is not given resources in one period, its slack is automatically decreased and in the next period it has a better chance of receiving resources. The resource allocation is repeated periodically (hourly, daily, weekly, or monthly, etc.), depending on the time frame of the project's activities. If a task becomes critical, that is, all the slack is used up before the activity receives resources, the project will be delayed. We will consider borrowing resources from ongoing tasks when we discuss the allocation of scarce resources among several projects.
When a resource is overallocated, MSP can level resource usage by adopting a variety of priority rules, including available activity slack. If there is insufficient slack, other priority rules may be used to allocate the scarce resource. Most of the priority rules originated as job shop scheduling rules. The minimum slack rule usually works best. Only a few critical resources are actually scarce in the sense that project schedules must be adjusted to resource availability.
6.5 ALLOCATING SCARCE RESOURCES TO SEVERAL PROJECTS
When the problem of allocating scarce resources is extended to the case when several projects are being carried out concurrently, the size and complexity of the problem increase but the nature of the underlying problem remains the same. The projects might be independent or members of one large superproject. In any case, there is a decided advantage if several projects are joined as a set.
Consider a single project for a moment. It is composed of a set of first-level tasks connected in a technological relationship of predecessors and successors. Each first-level task is composed of a set of second-level tasks, also arranged in technologically determined ways. The second-level tasks are divided into third-level tasks, and so on, much like the fleas in Jonathon Swift's famous verse:
So, naturalists observe, a flea
Hath smaller fleas that on him prey;
And these have smaller still to bite 'em;
And so proceed ad infinitum.
If we take several projects, we can link them together with pseudoactivities, here defined as activities that have duration but do not require any resources. The set of projects linked in such a way becomes a sort of superproject and can be “managed” like any other. We can use the pseudoactivities to establish precedences between the projects they connect, and thus we can separate the projects in time. This is simplest to illustrate as an AOA network (see Figure 6-11), but a Gantt chart could be used by displaying the projects with leads and lags. Each node in Figure 6-11 represents a project, and the arrows connecting them are pseudoactivities. The temporal relationships of the projects are altered by varying the duration of the pseudoactivities.
The individual projects are interrelated by specifying predecessor/successor relationships in MSP. Thus they appear (to MSP) to be parts of one project. If the original project calendars are put on the same time base (exactly as we did with individual activities when scarce resources were allocated among several activities in a single project), we can use the single-project resource-allocation methods for several projects at a time. (MSP's ability to handle projects with a very large number of activities on multiple levels is not limited by the software but by the size of the computer's memory.) MSP can also easily link many large projects, treated as separate and independent, but they share the same set of resources. The pseudoactivities may represent technological relationships among the projects—which will often be the case when individual projects are parts of an overall program. Pseudoactivities may separate projects according to planned delivery dates, or the separations may be completely arbitrary.
Putting a set of projects into a format that deals with them as a single project allows us to use MSP's resource loading and leveling charts and tables. Remembering that the calendars of all projects should be adjusted to the same time-base, we can examine the status of resource allocation—or overallocation—for all activities in all projects over any time period. By using the leveling routines, we can also examine the consequences of adopting different resource allocation priority rules. Further, we can examine the implications of adding more resources by comparing the costs of additional resources with the costs that might accrue from late deliveries or delays if the resources are not added. The assignment and handling of various priority rules are, of course, the same as in the single project case. The number of cases to be investigated will be larger in the multiproject case, but few genuine Walts are involved. Extending or contracting the pseudoactivities is the mechanism by which we change the start or finish dates of projects in order to avoid overallocation of Walts.
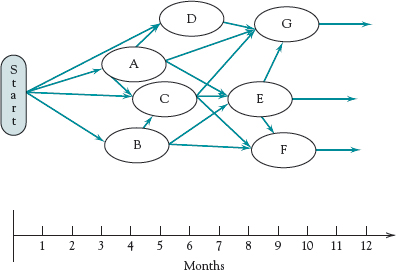
Figure 6-11 Multiple projects connected with pseudoactivities shown on a time line.
Criteria of Priority Rules
Whatever the priority rule, the PM faces the problem of choosing between the alternative outcomes that result from different priority rules, as well as different arrangements and durations of the pseudoactivities. There are many measurable criteria available to help us choose a priority rule. The most useful for projects are schedule slippage, resource utilization, and in-process inventory.
![]()
Schedule slippage simply measures the amount by which a project, or a set of projects, is delayed by application of a leveling rule (or by extending a pseudoactivity so that a project finishes later because it starts later). As we noted above, the PM (and senior management) must trade off penalty costs or the possible displeasure of clients against the cost of adding resources, if that is possible, or by reducing the overallocation of Walts. Just as serious is the ripple effect that often occurs when a delay in one project causes a delay in others. Indeed, expediting one project typically causes disturbances in the schedules of others.
The shortest-task-first rule for assigning resources minimizes the level of in-process inventory or how much unfinished work is in the system. Clients have little desire to pay for things they have not yet received—though partial prepayment is sometimes arranged by contract—and the organization carrying out projects may have large quantities of human and material resources invested in projects that have little value until they are complete.
![]()
The minimum slack rule is probably the best overall priority rule according to research on the subject. It gives the best combination of minimum project slippage, minimum resource idle-time, and minimum in-process inventory (Fendley, 1968). While first-come-first-served may be the client's idea of “fair,” it is a poor priority rule when measured against almost any of the others. If the minimum slack rule produces ties among two or more projects (or activities), the shortest task rule seems to be the best tie-breaker.
The Basic Approach
It is now appropriate to stop for a moment and consider a matter. The basic approach taken here to solve project loading and leveling problems is borrowed from a manufacturing model that has widespread application and works equally well for projects. Our problem is that there exists a set of activities belonging to one or more projects all eager for processing by a limited set of facilities or other resources. Not all activities require the same subset of facilities or resources, and some activities are more in need of immediate attention than others. To make matters worse, some activities need more work than others, and some insist (for technological reasons, of course, rather than natural cussedness) on being dealt with before some others.
As if this were not enough, the activities do not have access to the facility or resources at precise, predetermined times so the PM or facility manager does not know—with any great precision—when to expect specific activities to be ready for processing. Finally, even when an activity does arrive, and when the facility is ready to begin, there may still be considerable uncertainty about exactly how much time it requires to do the processing. Remember that we are discussing the unfinished outputs of some projects. They have completed a previous activity and are now waiting for resources to engage in the next activity for which they are scheduled. All of these activities involve the use of a scarce resource (or two) that we must allocate to the waiting activities.
In this setting, a scarce facility (resource) is like a bottleneck. A line or queue of activities waiting to be processed forms in front of the processor. Assume that jobs arriving to join the queue arrive randomly at an average or expected rate of λ jobs per unit of time. Also assume that the time required for the processor to service the activities is random and has an average or expected rate of μ jobs per unit of time. The behavior of queues has been studied for many years and under our assumptions, not unreasonable for the constrained resource, multiproject problem, the average number of jobs in the waiting line is given by J = (λ/μ)/(1 — λ/μ). Note what happens when the arrival rate of tasks approaches the system's capacity, for example λ approaches. μ. J, the number of jobs in the queue, heads toward infinity. This supports our earlier contention that production or servicing systems must have excess capacity unless they are tightly controlled assembly-line type operations—and even these need a small amount of excess capacity to handle the normal, small variations in arrival or service rates.
Resource Allocation and the Project Life Cycle
Whatever the scheduling rule, the scheduling method assigns scarce resources to activities on the basis of the degree to which the activity meets some priority conditions. Once the most urgent cases (as measured by the priority rule) have been given resources, the next most urgent cases receive their resources. The process continues until there are no more activities qualified under the rule.
If all critical activities demanding scarce resources are supplied, but the remaining stock of scarce resources is depleted before all noncritical activities are resource loaded, the less urgent activities go unsupplied. When this happens, the less urgent activities become more urgent as period after period passes until they rise far enough up the priority rank list and receive their resources. But what happens if the stock of scarce resources is depleted before all the critical activities receive resources? For example, when using the minimum slack rule, what happens if we run out of our scarce resource before we run out of critical (zero slack) activities?
When this condition occurs, it is often possible to borrow some resources from another (ongoing) activity that is lower on the priority list, that is, has some slack in the case of the minimum slack rule. Perhaps we could even deschedule such an activity and take all the scarce resource being used, restoring the scarce resource later when the descheduled activity has risen higher on the priority list. The decision about whether to borrow some resources from a high-slack ongoing task or whether to stop the task and use all its resources is made by looking at the implication of either action on the project. Borrowing the scarce resource may only slow down progress on an activity or it may stop the activity altogether. If borrowing does the latter, it would make sense to borrow all other resources at the same time.

Figure 6-12 Project or task life cycles.
We can also use our knowledge of the project's life cycle to help make the decision. Figure 6-12 shows both types of project life cycle that were discussed in Chapter 1, Section 1.4. The Type 1 life cycle shows decreasing returns to additional resources toward the end of the project. If we borrow from or deschedule activities late in the life of a Type 1 project, we lose proportionately little from the project. If we borrow from or deschedule activities late in the life of a Type 2 project, we may destroy it completely. On the other hand, if the borrowing or descheduling is done near the middle of the life of the project, our conclusion might be exactly the opposite. We need to understand the general shape of the project's life cycle curve in order to assess the implications of slowing or stopping it.
Allocating scarce resources among multiple projects is more complicated than the single project case, but is not different in its basic logic. The several projects are linked with pseudoactivities and treated as if they were the individual activities of a single project. Schedule slippage, resource utilization, and in-process inventory are measures of the goodness of any priority rule.
Much of the allocation problem results because project facilities/resources have insufficient excess capacity to handle the uncertainties associated with projects. The shape of the project's life cycle helps determine whether or not resources can be borrowed from ongoing activities to supply stalled activities with critical resource needs.
6.6 GOLDRATT'S CRITICAL CHAIN
Much research has been done on scheduling with constrained resources, and the findings verify what was expected—projects are completed faster when there are fewer of them struggling for attention from a limited set of facilities (Adler, Mandelbaum, Nguyen, and Schwerer, 1996). More recently, in the book Critical Chain (1997) Eliyahu Goldratt applies his Theory of Constraints—so brilliantly developed in his famous book, The Goal (Goldratt and Cox, 1992)—to the constrained resource problem. While Goldratt's focus in the Critical Chain is on a single project with multiple demands on a scarce resource, the logic extends to the multiproject case without alteration. PMBOK covers the critical chain in Chapter 6 on Project Time Management.
![]()
In the following few pages you will note that the exposition focuses mainly on scheduling. But isn't this chapter supposed to be about resource usage? It should be quite clear by now that resource usage and project schedules are inextricably bound together. The technological necessities that force schedules to be ordered in very specific ways simultaneously force resources to be used in very specific ways. To schedule work is also to schedule resource usage. If technology is the prime force behind scheduling the activities of a project, resource availability constrains all solutions to the scheduling problem.
To begin our discussion of Goldratt's approach, imagine for the moment that you are sitting in a room full of people with extensive experience as both project team members and project managers. Now imagine the responses you would hear if the group were asked the question: “What things bugged you most about the projects you have been involved with?” Typical of the responses that we have gotten to that question are:
- Project due dates are too often unrealistic.
- There are too many changes made in the project's scope.
- Key resources and data are often unavailable when needed.
- The budget is frequently unrealistic and therefore often exceeded.
- It seems like my project is always in competition for resources with other projects.
One interesting observation is that these same issues are raised regardless of the organizational context. Thus we hear strikingly similar complaints regardless of whether the group is referring to a construction project, a software development project, a project to develop an advertising campaign, or an R&D project. Hussain and Wearne (2005) asked more than 1000 project managers to identify the “greatest problem of project management,” a subtly different question than we asked, and they found that project “organization,” “resource,” and “time” issues were paramount. (“Change in scope was ranked 11th in their research.) Based on these findings, it is not farfetched to conclude that the causes of these problems are generic to all types of projects. As we have discussed throughout this book, project management is fundamentally concerned with effectively trading off scope, cost, and time. Referring back to the lists of complaints, it can be seen that each issue (excepting “organization”) deals with one or more of the three primary project objectives.
![]()
Given our conclusion that the problems encountered when managing projects are strongly related to the need to trade off one project objective for another, a natural question arises about the extent to which the need to make these trade-offs are caused by human decisions and practices. In other words, can more effective project management minimize the occurrence of these problems? To investigate this issue, let's examine the complaint regarding unrealistic due dates in more detail.
One way to investigate this issue is to see if we can identify any generally accepted practices that would tend to cause the shared perception of many project workers that project due dates are often set too optimistically. To make our discussion more concrete, consider the three AOA network diagrams shown in Figure 6-13. The primary difference between the three diagrams is the degree of interdependence across the paths. In scenario 1, there is only a single path. In scenario 2, the path B-C-D-E is preceded by three activities: A1, A2, and A3. Therefore, the completion of path B-C-D-E depends on which of its three preceding tasks takes the longest. In scenario 3 there are two completely independent paths each consisting of five tasks.
Assume that as project manager you are told that all of the tasks in the three network diagrams require 10 days to complete. What completion time would you calculate for each project? If you assume that the activity times are known with certainty, then all three projects would have the same duration of 50 days. If you find this result somewhat unsettling, you are in good company. Thinking about it intuitively, how can a simple project like scenario 1 with a single path and only five activities have the same duration as scenario 2 with three paths and seven activities, or with scenario 3 with two paths and ten activities?
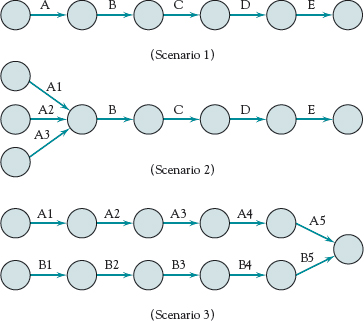
Figure 6-13 Three project scenarios.
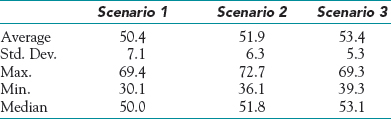
Part of the problem is our assumption that the activity times are known with certainty. To investigate this further, let's assume that all activity times are normally distributed with a mean of 10 days and standard deviation of three. The results of simulating the completion of the three projects 200 times each are summarized in Table 6-5.
As you can see from Table 6-5, removing the assumption that the activity times are known with certainty leads to quite different results. Scenario 1's average duration was slightly higher than the 50 we calculated earlier under the assumption of deterministic time estimates. To a large extent with this linear structure and with our assumption of normally distributed activity times, activities that take less than the expected time tend to cancel out the variability of activities that take more than the expected time, resulting in an overall average completion time that is close to the expected completion time for the project. (Remember, in Chapter 5 we discovered that this canceling out rarely happens in the real world, because activities may start late or on time, but rarely start early because resources are usually not available before the activity's earliest start time.) Also observe that the more interdependent scenarios 2 and 3, on average, take even longer than scenario 1 and that their minimum times are significantly longer than scenario 1's minimum time.
Most important, note that while the average completion times of the projects are still close to 50, this is simply the average project completion time after simulating the execution of each project 200 times. That is, approximately 50 percent of the time the projects will be completed in less than 50 days and 50 percent of the time the projects will be completed in more than 50 days under the reasonable assumption that the distribution of project completion times follows a symmetrical distribution. (Note that here we are referring to the distribution of project completion times as being symmetrical, not the project activity times.) In other words, had we determined the project duration based on the assumption that the activity times are known with certainty (when they were actually probabilistic), we would incur a greater than 50 percent chance that the actual project duration would exceed this estimate. How would you like to have responsibility for a project that has less than a 50 percent chance of being completed on time? This example clearly demonstrates how the commonly made assumption of known activity times in practice can lead to quite unrealistic project deadlines.
Table 6-5 Project Completion Time Statistics Based on Simulating Three Projects 200 Times
It is important to point out that the results would have been even more dramatic had the activities required some common resources. Similarly, the results would have been more dramatic and realistic had a nonsymmetrical distribution been used to model the activity times. Why, you might ask, would a nonsymmetrical distribution more realistically model the activity times? Suppose you scheduled a status meeting to last 20 minutes. Is there any chance the meeting will last 40 minutes longer than expected, or 60 minutes? What about 40 minutes less, or −20 minutes?
Estimating Task Times
Based on the discussion to this point and assuming that project workers have a general desire to be recognized for good performance, what do you imagine project workers do when they are asked to provide time estimates for tasks if they will be held responsible for actual task duration? Do you think they give an estimate that they believe provides them with only a 50 percent chance of being met? Or, more likely, do you imagine they inflate or pad their estimate to increase the likelihood of successfully completing the task on time? What would you do?
If you are like most people, you would inflate your time estimate. Unfortunately, inflated time estimates tend to create even more problems. First, inflating the time estimate has no impact on the actual probability distribution of completing the activity. Second, what do you imagine happens in cases when a project team member finishes early? All too often, the team member believes that it is in his or her best interest to remain silent about completing activities in less than the allotted time so that future time estimates are not automatically discounted by management based on a track record of early task completions. Moreover, there are sometimes penalties or additional costs associated with early completion, such as the need to store partially finished materials because the resources required for the next activity are not yet available. Third, just as things tend to fill available closet and storage space in your home, work tends to fill available time. Thus, the work done on the task may be expanded to fill the available time, as Parkinson's Law dictates.
Perhaps even more dangerous than the inflated estimate becoming a self-fulfilling prophecy is that, after receiving approval for a task based on an inflated time estimate, workers may perceive that they now have plenty of time to complete the task and therefore delay starting the task. As we noted in Chapter 5, Goldratt (1997) refers to this as the student syndrome, likening it to the way students often delay writing a term paper until the last minute. The problem of delaying the start of a task is that obstacles are frequently not discovered until the task has been underway for some time. By delaying the start of the task, the opportunity to cope with these obstacles and complete the task on time is greatly diminished.
In summary, we observe that the common practice of simply adding up task durations often leads to unrealistic project due dates. This is primarily the result of assuming the task times are known with certainty, and that we ignore path mergers and assume that the paths are independent. A natural consequence of this is that project team members will tend to inflate their time estimates. Inflated time estimates further compound the problem, particularly in cases where the student syndrome comes into play. In other words, this system tends to cause unethical behavior.
In our discussion we used computer simulation to investigate the impact that increasing interdependencies in a project network has on the distribution of project completion times. Crystal Ball® can also be used to investigate a variety of issues related to resource allocation. To illustrate this, let's investigate the impact of not reporting early completion times.
The Effect of Not Reporting Early Activity Completion
Once again, refer to Table 5-8 and consider the project described, solved, and then simulated in Chapter 5. When simulating this problem, we suggested that you should save the spreadsheet you created because we intended to use this problem in Chapter 6. We used BetaPERT distributions to reflect the uncertainty in activity duration times. The same distributions can be used, but in order to reflect Goldratt's contention (and ours) that early completion times go unreported (and even if they were reported, the appropriate resources would probably not be available because managers avoid gathering resources until the last moment), we can truncate the distributions so that the lower bound is equal to the most likely time estimate. In effect, this means that no time below the most likely time can be reported. The required changes are easily made.
- Call up the spreadsheet for the simulation you performed for the project shown in Table 5-8.
- Click on cell A3. Then click on Define Assumption in the CB ribbon.
- The BetaPERT distribution you used for the prior simulation will appear. In the box above the Minimum box, type in the most likely time for the activity—10 days for activity a as shown in Figure 6-14. Then click on OK.
- Proceed to alter each of the activities b-h (excepting d, which is a constant) similarly.
- Simulate the project 1,000 times.
Figure 6-15 shows the statistical results of the simulation. A comparison of this figure with Table 5-19 clearly shows the impact of a failure to report early activity finishes. The mean completion time is increased by approximately 2.5 percent. The time for completion with a 95 percent probability (Z = 1.645) increases by 4.6 percent.
The main lesson to be learned is that single point estimates of activity duration are not adequate for planning real-world projects. For a number of reasons discussed above, the earlys and lates do not cancel out. The most likely time is, therefore, not a satisfactory substitute for a three-time estimate of activity duration.
Multitasking
Up to this point, our perspective has been a single project. We now investigate another problem created by conventional practice—the practice of assigning people concurrently to multiple projects.

Figure 6-14 Truncated BetaPERT distribution for activity a reflecting the assumption that early completion times are not reported.
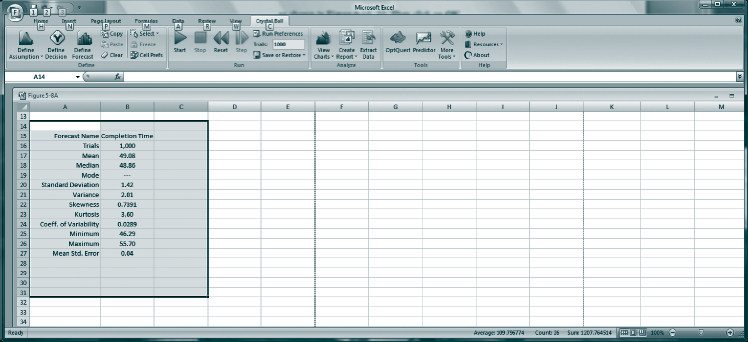
Figure 6-15 Summary statistics for project completion times when early activity completion times are not reported.

Figure 6-16 Two small projects.
When project team members are assigned to multiple projects, they have to allocate their time across these projects or multitask. Multitasking involves switching from a task associated with one project to another task associated with a different project. To illustrate this, consider the two small projects shown in Figure 6-16. The completion of each of the projects' three tasks requires you and one additional resource. Further, the completion of each task requires 5 days.
In Figures 6-17(a) and 6-17(b), Gantt charts have been developed for two alternative ways of completing the tasks. In Gantt chart 6-17(a), you switch between projects after each task is completed, while in Gantt chart 6-17(b) you complete all of your assigned tasks for Project A before beginning any work on Project B. In both of these cases the two projects are finished in 25 days; therefore, aren't both sequences equally desirable? The answer is absolutely not. First, while it is true that in both cases Project B is finished by time 25, in the first sequence Project A finishes in 20 days, while in the second sequence Project A finishes 5 days earlier. Therefore, the sequence shown in the second Gantt chart is preferable because it results in Project A finishing 5 days earlier with no penalty to Project B.
Even more important, our analysis overlooks another significant factor. Specifically, there is typically a penalty or cost associated with switching from working on one project to another. In your own experience as a student, is it more efficient to complete the assignment for one course and then move on to another course or is it more efficient to complete one project management homework problem, then move on to an accounting problem, then on to a statistics problem, then back to a project management problem, and so on? Obviously each time you switch to a different course you have to retrieve the appropriate textbook, find the right page, recall where you left off, and (perhaps most significantly) get into the proper frame of mind. As this example demonstrates, switching attention from project to project is likely to extend activity times. Eliminating such switching costs further increases the benefits associated with the Gantt chart shown in Figure 6-17(b).

Figure 6-17 Alternative Gantt charts for projects A and B.
Common Chain of Events
According to Goldratt, the activities discussed above lead to the following chain of events:
- Assuming that activity times are known and that the paths are independent leads to underestimating the actual amount of time needed to complete the project.
- Because the time needed to complete the project is underestimated, project team members tend to inflate their time estimates.
- Inflated time estimates lead to work filling available time, workers not reporting that a task has been completed early, and the ever-present student syndrome.
- An important caveat then becomes that safety time is usually visible to project workers and is often misused.
- Misused safety time results in missed deadlines and milestones.
- Hidden safety time further complicates the task of prioritizing project activities.
- The lack of clear priorities likely results in poor multitasking.
- Task durations increase as a result of poor multitasking.
- Uneven demand on resources—some overloaded and others underloaded—may also occur as a result of poor multitasking.
- In an effort to utilize all resources fully, more projects will be undertaken to make sure that no resources are underutilized. (Recall the impact of this policy from our discussion of waiting lines in Section 6.5.)
- Adding more projects further increases poor multitasking.
According to Goldratt, this chain of events leads to a vicious cycle. Specifically, as work continues to pile up, team members are pressured to do more poor multitasking. Increasing the amount of poor multitasking leads to longer activity times. Longer activity times lead to longer project completion times, which ultimately lead to more projects in the waiting line.
It might have occurred to you that one way to reverse this cycle would be to add more resources. According to Goldratt, however, the appropriate response is to reduce the number of projects assigned to each person in an effort to reduce the amount of bad multitasking. Incidentally, a simple way to measure the amount of bad multitasking is to calculate the difference between the time required to do the work for a task and the elapsed time actually required to complete the task.
Determining when to release projects into the system is the primary mechanism for ensuring that the right amount of work is assigned to each person. If projects are started too early, they simply add to the chaos and contribute to poor multitasking. On the other hand, if projects are started too late, key resources may go underutilized and projects will be inevitably delayed.
Consistent with his Theory of Constraints, Goldratt suggests that the key to resolving this trade-off is to schedule the start of new projects based on the availability of bottleneck resources or Walts. Goldratt further suggests that time buffers be created between resources that feed bottleneck resources and the bottleneck resources.
![]()
While properly scheduling the start of new projects does much to address the problems associated with poor multitasking, it does little to address the problem of setting unrealistic project deadlines and the accompanying response of inflated time estimates. Relying on elementary statistics, it can be easily shown that the amount of safety time needed to protect a particular path is less than the sum of the safety times required to protect the individual activities making up the path. The same approach is commonly used in inventory management where it can be shown that less safety stock is needed at a central warehouse to provide a certain service level than the amount of safety stock that would be required to provide this same service level if carried at multiple distributed locations.
Based on this intuition, Goldratt suggests reducing the amount of safety time added to individual tasks and then adding some fraction of the safety time reduced back into the system as safety buffer for the entire project, called the project buffer. The amount of time each task is reduced depends on how much of a reduction is needed to get project team members to change their behavior. For example, the allotted time for tasks should be reduced to the point that the student syndrome is eliminated. Indeed, Goldratt suggests using activity durations where in fact there is a high probability that the task will not be finished on time.
The Critical Chain
Another limitation associated with traditional approaches to project management is that the dependency between resources and tasks is often ignored. To illustrate this, consider the network diagram shown in Figure 6-18. According to the figure, the activities emanating from node 1 require resource A, while the activities emanating from nodes 2 and 3 require resources C and B, respectively. Using traditional approaches to project management, two paths would be identified: A1-C1 with a duration of 17 days and A2-B1 with a duration of 11 days. Taking this approach a step further we would conclude that path A1-C1 is the critical path.
The problem with this logic is that activities A1 and A2 are not truly independent as the diagram would seem to indicate since their completion requires the same resource. Based on this new insight, we see that if resource A completes activity A1 first, thereby delaying the start of A2 for 7 days, then path A1-C1's duration remains 17 days while path A2-B1's duration increases from 11 to 18 days. Likewise, if resource A completes activity A2 first, then path A1-C1's duration increases from 17 to 22 days while path A2-B1's duration remains 11 days. (This is precisely what was considered when we examined the process of resource leveling.)
To address the need to consider both precedence relationships and resource dependencies, Goldratt proposes thinking in terms of the longest chain of consecutively dependent tasks where such dependencies can arise from a variety of sources including precedence relationships among the tasks and resource dependencies. Goldratt coined the term critical chain to refer to the longest chain of consecutively dependent activities.
Based on this definition of the critical chain, there are two potential sources that can delay the completion of a project. One source of delay is in the tasks that make up the critical chain. The project buffer discussed earlier is used to protect against these delays (see Figure 6-19). The second source of delay is in the tasks external to the critical chain. These tasks can also delay the completion of the project if delays in these “feeder” paths end up delaying one or more of the tasks on the critical chain. As shown in Figure 6-19, safety time can be added to these paths as well to ensure that they do not delay tasks on the critical chain. The safety time added to chains other than the critical chain is called a feeding buffer since these paths often feed into or merge with the critical chain. Thus, the objective of feeding buffers is to ensure that noncritical chains are completed so that they do not delay tasks on the critical chain.

Figure 6-18 Sample network diagram.

Figure 6-19 Project and feeder buffers.
Clearly, activities on the critical chain should be given the highest priority. Like wise, to ensure that resources are available when needed, they should be contracted at the start of the project. It is also wise to keep these resources updated on the status of the project and to remind them periodically of when their input will be needed. Goldratt suggests reminding these resources 2 weeks before the start of their work, then 3 days prior to their start, and finally the day before they start. Since any delay of an activity on the critical chain can cause a delay of the entire project, it is important that a resource immediately switch to the task on the critical chain when needed.
The critical chain concept identifies the facts that activity times are unknown and independent, that workers will inflate their time estimates to protect themselves, early completion tasks will not be reported, the work will expand to fill the time, tasks will not be started until the last minute, multitasking will be misapplied, resource demands will be uneven and result in task delays, and more projects and tasks will be undertaken to increase resource utilization. All these contribute to project delays and inefficiencies. To correct these problems, feeder time buffers are cut severely to change behavior, a project buffer is added at the end of a project, the release of projects and tasks is based on the availability of bottleneck resources, and time buffers are added to resources that feed bottleneck resources.
The last three chapters on budgeting, scheduling, and allocating resources are the outcome of the planning process we described in Chapter 3. These subjects, taken together, are a description of what to do. Now we turn to two allied subjects: how to report what is going on and how to control it.
REVIEW QUESTIONS
- Given the fact that a project's resource requirements are clearly spelled out in the project plan, why are PMs so concerned with resource allocation?
- Explain the difference between a project that has a fixed delivery day and one that has a fixed limit on resource usage. Why might a PM be interested in this difference?
- What does it mean to “fast-track” a project?
- List as many things as you can think of that should be entered into a specific resource's calendar.
- Explain why project-oriented firms require excess resource capacity.
- The arrival and departure times of commercial aircraft are carefully scheduled. Why, then, is it so important to have excess capacity in the airport control tower?
- Explain the difference in the problems faced by a PM who is short of secretarial resources and one who is short of a “Walt.”
- When allocating scarce resources to several different projects at the same time, why is it important to make sure that all resource calendars are on the same time base (i.e., hourly, daily, weekly . . .)?
- List and describe the three most common criteria by which to evaluate different resource allocation priority rules.
- Why is the problem of allocating scarce resources to a set of projects similar to the problem of scheduling a job shop?
- What is meant by the term “student syndrome”?
DISCUSSION QUESTIONS
12. Describe the fundamental trade-offs made when deciding whether or not to crash a project. If the decision is made to crash, what additional trade-offs must be made?
13. Discuss the advantages of “labor pools” in a project-oriented company. Are there any potential disadvantages with the use of pools?
14. What purpose(s) might be served by using each of the following priority rules for allocating scarce resources?
a. As late as possible
b. Shortest task duration time first
c. Minimum slack first
15. Linking a group of projects together with pseudoactivities creates a sort of superproject. What does this mean, and why would anyone want to do it?
16. Describe in your own words what is meant by Goldratt's critical chain. How does it work?
17. Projects A and B are both nearing completion. You are managing a super important project C that requires an immediate input of a resource being used by both projects A and B, but is otherwise unavailable. Project A has a Type 1 life cycle. Project B's life cycle is Type 2. From which (or both or neither) do you borrow the resource? Why?
18. Goldratt suggested that to avoid the “student syndrome,” it is a good idea to set activity durations so short that there is a high probability that the task will not be finished on time. On the other hand, it has long been known that setting people up for failure is strongly demotivating. What should the PM do?
19. Describe as many types of resource allocation problems as you can, based on the situations described in the chapter.
PROBLEMS
20. Given the following project to landscape a new building site:

(a) Draw a Gantt chart using MSP.
(b) Assuming a 5-day week, find the critical path and project duration in days.
(c) Given that each resource is assigned 100 percent to each task, identify the resource constraints.
(d) Using the MSP default, level the resources and determine the new project duration and critical path.
(e) Identify what alternative solutions can be used to shorten the project duration without overallocating the resources.
21. Given the following project (all times are in days):

(a) Draw the network (AOA or AON) and find the critical path, time, and cost for an all-normal level of project activity.
(b) Calculate the crash cost-per-day (all activities may be partially crashed).
(c) Find the optimal way of getting an 18-day delivery time. What is the project cost?
(d) Find the optimal way of getting a 16-day delivery time. What is the project cost?
(e) Calculate the shortest delivery time for the project. What is the cost?
22. Given the following AOA network, determine the first activity to be given extra resources by the following priority rules:

(a) Shortest task first
(b) Minimum slack first
(c) Most critical followers
(d) Most successors
23. Given the project shown in Figure 5-10 of Chapter 5, assume that a facility used by activities c and d is scarce. To which activity would you assign the facility first, given the following rules:
(a) Minimum slack rule
(b) Most followers
(c) Most critical followers
(d) Shortest task first
(e) As late as possible
24. Consider the following activity information and the constraint that the project must be completed in 16 weeks.

In addition, activity C may be crashed to 7 weeks at a cost of $40, activity F may be crashed to 6 weeks at a cost of $20/week, activity H may be crashed to 2 weeks at a cost of $10/week, and activity I may be crashed to 3 weeks at a cost of $30/week. Find the best schedule and cost.
25. Consider the project network below. Suppose the duration of both activities A and D can be reduced to 1 day, at a cost of $15 per day of reduction. Also, activities E, G, and H can be reduced in duration by 1 day, at a cost of $25 per day of reduction. What is the least-cost approach to crash the project by 2 days? What is the shortest “crashed” duration, the new critical path, and the cost of crashing?
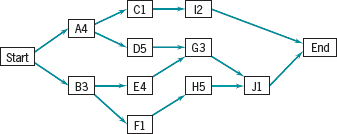
INCIDENTS FOR DISCUSSION
Lab Results, Inc.
Sam G. Farshe runs a medical laboratory in Pittsburgh. He has contracts with several doctors' offices to conduct their lab work. He runs the lab tests and reports the results on their patients. Lab Results, Inc. has a reputation of always delivering quality results within the time specifications of each contract. Sam is pleased with his company's results. His crew of technicians works hard. He prides himself on the fact that there is no excess capacity in his operation. He pays overtime to his technicians weekly, but always includes those costs in his contracts.
Sam has been asked to bid on a contract to do the lab work for an area hospital whose lab is being renovated. The hospital needs to outsource their lab services temporarily. They estimate construction will take 2–3 months, and they want a free-standing lab service to cover their needs for 4 months; then the hospital will resume the service. Sam is treating this as a project and intends to estimate the work hours needed based on the number of tests the hospital estimates. He will then be able to determine his bid price for the job. Sam wants this contract. He has heard rumors that some of the other hospitals in the city are considering outsourcing their lab work permanently as a cost saving measure. Sam thinks that he can submit the low bid if he just has his current staff ‘buckle-down’ for the 4-month time period and pick up this additional work. The hospital is estimating a significant amount of work, but Sam believes if he just adds additional overtime to his bid, he can cover the increase in work load and win the contract.
Questions:
- Do you think Sam's plan is going to work? Why or why not? How would you handle the bid on the new project?
- Would Crystal Ball® be useful in assessing Sam's plan and changing it, if necessary?
Southern Kentucky university Bookstore
Southern Kentucky University (SKU) bookstore is beginning a major project of automating their inventory system. The bookstore is organized into four business units: Textbooks, General Merchandise—insignia merchandise (sweatshirts, coffee mugs, etc.), General Books, and Convenience (candy, soft drinks, etc.). Lisa O'Brien, the Bookstore Manager, has decided to name each business unit supervisor as the PM of his or her area's automation project. Each department has its own information systems person assigned, so Lisa feels that each area can work independently and then all meet her deadline of completion. The project is scheduled for completion right before school starts in the fall, with staggered “Go Live” dates for each of the business units. Each unit will do its own data entry and then work with the others on testing and implementation.
Missy Motz is the supervisor of the Textbook division of the bookstore. Missy is concerned that her department will not have enough resources to complete the automation project. The Textbook department is always swamped with book orders from professors right before school starts. Missy thinks she has enough staff to handle the data entry, but is concerned about supplying personnel at the times and quantities required as the implementation is phased in over each of the business units.
Missy knows a little bit about resource allocation techniques. She remembers that one of the most effective allocation techniques is to work first on the activity with minimum slack, so she instructed her staff to approach any tasks they are assigned as members of the project team on that basis.
Questions:
- Is the minimum slack rule a reasonable way to schedule resources of the Textbook division? Why or why not?
- What complication is added by making this project four separate projects?
![]()
St. Dismas Assisted Living Facility Resource Usage—4
The team for the Assisted Living Facility (ALF) program was working to prepare in-depth plans, complete with the resource requirements for their projects' tasks.
Marc Alison, MD, the Medical Director of Rehabilitation Services for St. Dismas Medical Center was responsible for developing a project plan with the objective of identifying the scope and associated costs of health services to offer residents. The Medical Director included in the plan the development of an assessment tool that would be used to determine the required level and cost of care for prospective residents. This tool would also be used to ensure that the appropriate population was housed at the facility. It was important to have a way to distinguish a person who was too sick and needed a more intense level of care than that offered by the Assisted Living Facility. Once the assessment of a potential resident was completed, the facility staff could determine if the person assessed was a good candidate for the facility. This phase of the project plan was critical to the success of the project.
Dr. Alison's approach was to develop the assessment tool and test it on individuals that matched the marketing department's target population of the assisted living facility. He felt he had a great opportunity to find his test population by using some of the current St. Dismas patients who were almost ready for discharge from the hospital. He could also use some of the older volunteers who currently worked at the hospital. Dr. Alison felt strongly that a physician should assess potential residents but he also knew that it might be cost prohibitive to have such an expensive resource conducting pre-admission assessments. He thought that if a physician developed and tested the tool first, then additional testing could be conducted using less costly health care professionals to conduct the evaluations.
Dr. Alison knew he would have to work with Dr. Zen Link, Head of Geriatric Medicine, on developing the tool. Dr. Link was familiar with the elderly population that the marketers were targeting and could offer valuable insights on how to assess the health status of potential residents. Dr. Link also had an extensive practice at St. Dismas and would have some patients who might agree to help test the assessment tool. Dr. Alison would also need the services of the CFO and his staff to determine the cost of the health services the residents would need. Dr. Alison prepared and presented the following plan to the project steering team:
The ALF team was impressed with the thought that went into Dr. Alison's project plan. They were delighted with the prospect of copyrighting an admission and discharge assessment tool, but they raised some questions about Dr. Alison's resource assignments. The COO asked how Drs. Alison and Link were going to assess a sufficient sample of people in 6 hours' time given their busy clinical schedules. Dr. Alison replied that he and Dr. Link would be doing all of the other steps in the plan during their normal 8 AM to 5 PM workday. The step to test the tool on real patients, however, would take some scheduling. Dr. Alison added that his colleague intended to conduct evaluations of current patients, with their permission, during their regular office visits. Dr. Alison admitted he had not figured out how he was going to see his share of the test group. He knew he could see some inpatients ready for discharge from the hospital during the time he did his rounds. He also wanted to test the tool on at least a dozen people from the volunteer staff who matched the prospective resident population. He informed the team that his secretary had agreed to phone the volunteers and see if any of them were interested. She said she could do this during her normal workday, so he had not included her time in the plan.
Dr. Alison sat silently thinking about how long this step in his plan would take, given his current workload. He knew that he would only be available to do the assessments during the time that he allocated for administrative hospital work, Wednesday from 8:00 AM to noon. He did not want to give up any of his clinical time, because his patients had been scheduled months in advance. Dr. Alison wanted to personally test the tool on at least 12 people. He estimated each assessment would take no more than a half hour (that is why he said that step would take six hours to complete).
Dr. Alison was not sure what to do next. He told the project team he would get back to them.
QUESTIONS
- Prepare a Gantt chart with resources for the project plan Dr. Alison submitted. Begin this project on January 3. Prepare a resource calendar for Dr. Alison.
- How would you handle Dr. Alison's resource problem?
- Given Dr. Alison's availability, how long will it take to complete testing of the assessment tool?
- Prepare a Gantt chart for Dr. Alison's plan incorporating any changes you recommend.
![]()
Charter Financial Bank
Charter Financial Bank operates three branches in a southeastern city. Ray Copper, Vice-President of Information Technology at the bank, has recently been charged by the bank's president to develop a mobile app that can be used on smartphones and tablet computers to promote bank services, to provide access to customer account information, and to allow individuals to apply online for loans and credit cards.
Ray decided to assign this project to Rachel Smith, one of two directors in the information technology group. Since this would be Charter Financial's first mobile app, Ray and Rachel agreed that an appropriate starting point for the project would be for the project team to benchmark existing apps in order to gain a better understanding of the state-of-the-art in this area. At the conclusion of their first meeting, Ray asked Rachel to prepare a rough estimate of how long this project would take and how much it would cost if it were pursued at a normal pace. Noting that the president appeared particularly anxious to develop the app, Ray also requested that Rachel prepare a time and budget estimate related to developing the app as quickly as possible.
During the first project team meeting, the team identified seven major tasks associated with the project. The first task was to benchmark existing apps. The team estimated that completing this task at normal pace would likely require 10 days at a cost of $15,000. However, the team estimated that this task could be completed in as few as 7 days at a cost of $18,750 if the maximum allowable amount of overtime was used.
Once the benchmark study was completed, a project plan and project definition document would need to be prepared for top management approval. The team estimated that this task could be completed in 5 days at a cost of $3,750 working at a normal pace or in 3 days at a cost of $4,500.
After the project received the approval of top management, the app design could begin. The team estimated that app design would require 15 days at a cost of $45,000 using no overtime or 10 days at a cost of $58,500 using all allowable overtime.
After the app design was complete, three tasks could be carried out simultaneously: (1) developing the server code to support the app, (2) developing and coding the actual app, and (3) developing and coding the app's user interface. The team estimated that developing the server code would require 10 days and cost $9,000 using no overtime, but could be completed in 7 days at a cost of $11,250 using overtime. Likewise, the team estimated that developing and coding the app would require 10 days and cost $15,000 using no overtime or could be reduced by 2 days at a total cost of $19,500. Developing the user interface was to be subcontracted out and would take 7 days at a cost of $8,400. The organization that was to be used to create the user interface does not provide an option for paying more for rush jobs.
Finally, once the code for the server, the code for the app, and the user interface were completed, the entire app would need to be tested and debugged. The team estimated that this would require 3 days at a cost of $4,500. Using overtime, the team estimated that the testing and debugging task could be reduced by a day at a total cost of $6,750.
QUESTIONS
- What is the cost of completing this project if no overtime is used? How long will it take to complete the project?
- What is the shortest amount of time in which the project can be completed? What is the cost of completing the project in the shortest amount of time?
- Suppose that the benchmarking study actually required 13 days as opposed to the 10 days originally estimated. What actions would you take to keep the project on a normal schedule?
- Suppose the President wanted the app developed in 35 days. What actions would you take to meet this deadline? How much extra would it cost to complete the project in 35 days?
![]()
Rand Contractors
Brothers Anthony and Bruce Rand own and operate a house renovation business. Recently they signed a contract with a homeowner for a fairly extensive addition to the house. In particular, the home addition involves knocking out the back wall of the kitchen and the corresponding wall in the basement and expanding the space on both levels. Also, the roof of the new addition will serve as a terrace for the master bedroom located on the second floor, so a door leading to the terrace will also have to be installed in the master bedroom. While a cost estimate for the project has been approved by the homeowner, the Rand Brothers need an estimate of how long the project will take so they can provide a start date to the customer of their next project.
The first task in the renovation project is to knock out the walls in the basement, kitchen, and master bedroom. The brothers work together on this task. Based on their experience, their best estimate of the time it will take to knock out the walls is 3 days. However, they feel if the task goes particularly well, they may be able to knock out all the walls in 2.5 days. On the other hand, if they encounter unforeseen problems, they estimate that knocking out the walls could take as long as 5 days.
Once the walls have been knocked out, the framing for the new addition can be started. Only Anthony has the skills to do the framing. His best guess is that the framing will take 9 days, but he believes there is a chance he might be able to complete it in 8 days. By the same token, if he encounters some difficulties, he estimates that framing the addition could take as long as 12 days.
Once the framing has been complete, either the plumbing or electrical work can be started which are both done by Bruce. Bruce estimates that the plumbing will take 3 days, but might be done in as few as 2 days or as long as 6 days. Likewise, he estimates that the electrical work will take him 3 days, but that he might be able to finish it in 2 days or require as many as 5 days.
After both the plumbing and electrical work are completed, the drywall and trim work can be started. Anthony does the drywall and trim work. He estimates this will take 6 days, could possibly be done in 5 days, and might take as long as 9 days.
Finally, after the drywall is finished, the new addition can be painted, which is done by both brothers. Based on past projects, the brothers estimate that painting will take 3 days. If the job goes well, they could possibly get the task done in 2 days, while if it goes slower than expected it could take up to 4 days. Also, note that the exterior brickwork is being subcontracted out to another contractor and can commence as soon as the framing is complete.
QUESTIONS
- Assuming the activity times follow a beta distribution, simulate the home renovation project 10,000 times ignoring for the moment which brother performs a given task? What is the expected project completion time? What are the shortest and longest amounts of time you estimate it will take to complete the project?
- What is the probability the project can be finished in 25 days or less? What is the probability the project will require 27 days or more to complete? What is the probability the project can be completed in 24 to 26 days?
- Revise your simulation model so that in addition to considering the precedence relationships, it also considers who will be doing the tasks. Now what is the expected project completion time? What is the shortest and longest amount of time you estimate it will now take to complete the project?
- Based on the revised simulation model, what is the probability the project can be finished in 25 days or less? What is the probability the project will require 27 days or more to complete? What is the probability the project can be completed in 24 to 26 days?
- How do the results compare between the two simulation models? What are the implications of these differences for a project manager?
- Based on your simulation results, how would you respond to the next customer regarding when their remodeling project will start?
BIBLIOGRAPHY
ADLER, P. S., A. MANDELBAUM, V. NGUYEN, and E. SCHWERER. “Getting the Most Out of Your Product Development Process.” Harvard Business Review, March–April 1996.
FENDLEY, L. G. “Towards the Development of a Complete Multiproject Scheduling System.” Journal of Industrial Engineering, October 1968.
GOLDRATT, ELIYAHU M. Project Management the TOC Way (uncorrected proofs). The North River Press: Great Barrington, MA, 1998.
GOLDRATT, E. M. Critical Chain. Great Barrington, MA: North River, 1997.
GOLDRATT, E. M., and J. Cox. The Goal. 2nd rev. ed., Great Barrington, MA: North River, 1992.
HUSSAIN, R., and S. WEARNE, “Problems and Needs of Project Management in the Process and Other Industries.” Transactions of the Institution of Chemical Engineers, Part A, April 2005.
IBBS, C. W., S. A. LEE, and J. I. Li. “Fast-Tracking's Impact on Project Change.” Project Management Journal, December 1998.
KURTULUS, I., and E. W. DAVIS. “Multi-Project Scheduling Categorization of Heuristic Rules Performance.” Management Science, February 1982.
KURTULUS, I., and S. C. NARULA. “Multi-Project Scheduling: Analysis of Project Performance.” IEEE Transactions on Engineering Management, March 1985.
MEREDITH, J. R. and S. M. SHAFER. Operations Management for MBAs, 5th ed. New York: John Wiley, 2013.
*With few exceptions, we will not make a distinction between human and nonhuman resources in this chapter. We need not distinguish between them in order to consider the allocation problem. The tasks of administering the human and nonhuman resources are quite different, of course.
*If MSP's Gantt chart view is set to show weekly intervals, it indicates resource usage for an entire week even if the resource is actually used for only 1 day during that week. To see resource usage with more precision, set the MSP calendar to show daily or hourly intervals.
*Kurtulus and Davis (1982) and Kurtulus and Narula (1985) in two excellent research papers extended the earlier work of Fendley. They tested many more priority rules than can be covered here.