

Project Activity and Risk Planning
If problems arise during the life of a project, our first hunch would be that the project was not properly planned. Most of the time our hunch would be correct. Inadequate planning is more the case than the exception. We can only guess why. Perhaps the reason is that senior management and/or the PM and/or the project team are impatient. They want “to get on with it.” Possibly some of the people who should be engaged in planning have heard Tom Peters, well-known searcher-for-excellence and management guru, comment that good planning almost never cuts implementation time and that “Ready, Fire, Aim” is the way good businesses do it.
As a matter of fact, Peters is wrong. There is a ton of research that concludes that careful planning is strongly associated with project success—and to the best of our knowledge there is no research that supports the opposite position. Clearly, planning can be overdone, a condition often called “paralysis by analysis.” Somewhere in between the extremes is the happy medium that everyone would like to strike, but this chapter does not seek to define the golden mean between no planning and overplanning (Langley, 1995). We do, however, examine the nature of good planning, and we describe proven methods for generating plans that are adequate to the task of leading a project work force from the start of the project to its successful conclusion. We must start by deciding what things should be a part of a project plan.
3.1 THE BASIS OF A PROJECT PLAN—THE “PROJECT CHARTER”
Before considering how to plan, we should decide why we are planning and what information the plan should contain. The primary function of a project plan is to serve the PM as a map of the route from project start to finish. The plan should include the business case or the organization's expected financial benefits that will accrue as well as the strategic reasons for the project. The plan should contain sufficient information that, at any time, the PM knows what remains to be done, when, with what resources, by whom, when the task will be completed, and what deliverables the output should include. This information must be known at any level of detail from the most general overall level to the minutiae of the smallest subtask. As the project travels the route from start to finish, the PM needs also to know whether or not any changes in project plans are contemplated and whether or not any problems are likely to arise in the future. In other words, the PM needs to know the project's current state and its future expectations. Because PMs are sometimes appointed after the project has begun, the PM also needs to know the project's history to date.
![]()
The PMBOK Project Plan (Chapter 4 and parts of the following chapter of PMBOK) is comprehensive and refers to the Project Charter and all the elements concerning the planning, execution, and control of the project. In practice, the charter is essentially an abridged version of what will later become the full project plan, thus containing summaries of the budget and schedule details. The major project stakeholders must sign off on the charter before initiation of the project. The list of signatories would include a person representing the project sponsor, the client/user, the Project Manager, and the Program Manager if the project is a part of an overall program. In some cases, representatives of other stakeholders may be asked to sign their approval. Clearly, this may require negotiation. Once agreed to, the charter cannot be altered by any signer without acceptance by the others.
A bias toward reality requires us to note that different stakeholders have different levels of clout. If senior management and the client both favor a change in the scope of the project, the project manager and his or her team would be well advised to accept the change in good grace unless there is some overriding reason why such a change would be infeasible. Occasionally, stakeholders not directly connected to the organization conducting the project or the client purchasing it can be so demanding that provision is made for them to sign off on specific changes. Consider, for example, People for the Ethical Treatment of Animals (PETA) and their battles with cosmetic firms over the use of animal testing for cosmetic products. Once completed, the Project Charter becomes the basis for the follow-on full project plan.
The multiple elements required in the Project Charter fall into one of the following eight categories.
- Purpose. This section describes the Business Case for the project. The Business Case includes the strategic reasons for the project, its expected profitability and competitive effects, as well as the desired scope and any other technical results. The intent of the Business Case is to communicate to project team members (and others) the reasons why the organization is undertaking the project.
- Objectives. This is a more detailed description of the project's scope, its deliverables and outcomes. Another approach to describing a project's objectives is the project mission statement. While somewhat similar to the Business Case, the focus of the mission statement is to communicate to project team members (and others) what will be done to achieve the project's overall objectives. To foster team understanding of the project as a whole, a representative group of team members and stakeholders are often included in the process of developing the statement of objectives.
- Overview. This section contains a brief description of the project and its deliverables (the latter are the project scope), together with a list of the major milestones or significant events in the project schedule and any constraints on the project scope. It is intended for senior management. The technological and managerial approaches to the work are also described. An identification of the project as “derivative,” “platform,” or “breakthrough” might be included, as might the relationship between this project and others being undertaken or contemplated by the organization. Also noted are plans that go beyond the organization's standard management practices such as the use of consultants or subcontractors. This section should also describe the agreements made with the client or any third party such as reporting requirements; technical specifications of deliverables; delivery dates; any incentives or penalties; the procedures for making changes in the deliverables or project procedures; and similar agreements.
- Schedules. Included in this section is a summary of schedules and milestones. The major tasks in the project are listed in a project Work Breakdown Schedule. (The WBS is discussed later in this chapter.) Listed with each task is the time required to perform it. The project plan's full schedule will then be constructed from these data.
- Resource requirements. Estimates of project expenses, both capital and operating, are included here. The costs associated with each task are shown, and overhead and fixed charges are described. Appropriate account numbers to be charged are listed with the relevant cost items. This then becomes the project budget, though the PM may use a budget that deletes overhead and some fixed charges for day-to-day project management and control. (The details of budget preparation are covered in the next chapter.) In addition, cost monitoring and cost control procedures may be described here.
- Personnel and stakeholders. This section describes the stakeholders, sponsor, project manager, and possibly some members of the project team. It notes any special skill requirements, necessary training, and special legal arrangements such as security clearances or nondisclosure agreements. Combined with the schedule, it may also note the time-phasing of personnel requirements. Sections 4, 5, and 6 may contain individual notations concerning managerial responsibility for control of each project area, detailing the managerial/informational accountability requirements for each person.

- Risk management. “Learn from experience” is a widely ignored adage. This section is an attempt to remedy that condition. Planners should list the major and minor disasters that may strike projects similar to the one being undertaken—late subcontractor deliveries, bad weather, unreasonable deadlines, equipment failure, complex coordination problems, client changes in project scope, and similar dire happenings. The argument is often made that crises cannot be predicted but the only uncertainty is which crisis will occur and when. In any case, dealing with crises does not require a which-and-when prediction. Contingency plans to deal with the potential crises described here should be a standard part of the follow-on project plan and included in a permanent file in the PMO (or EPMO). It is well to remember that no amount of planning can prevent all crises—but developing contingency plans may prevent or soften the impact of some. Other methods for handling risks are covered later in this chapter.
- Evaluation methods. Descriptions of all project evaluation procedures and quality standards are found in this section. Also included are procedures to ensure compliance with all corporate requirements for monitoring, collecting, and storing data on project performance, together with a description of the required project history.
It is hard to overstate the importance of a clear statement of the purpose of the project. It is not, repeat NOT, sufficient to state the project objectives without reference to its purpose. For example, to reach the Pudong International Airport from Shanghai's business center, China built a magnetic levitation (maglev) train that runs every 10 minutes (PMI, April 2004). Reaching speeds over 300 miles an hour, it whisks people to the airport 20 miles away in less than 8 minutes. However, according to the vice-director of the train company, “We are not lucky with ticket sales.” The trains are virtually empty. The reason is simple. To meet the time deadline and budget, the train station was located 6 miles outside the city center, requiring lengthy public transportation to get there. The project met its technical, budgetary, and schedule objectives successfully. It failed, however, to meet the needs of the public. China is currently investigating extending the line to the downtown area, but that will be a much more expensive and time-consuming project.
The importance of a contract specifying the process of potential problem solving between the project's principals in addition to the content of project deliverables is made clear in the following example. $74 million of Philadelphia's $567 million Market Street Elevated train system reconstruction project went to PKF Mark III contractors for one portion of the system (PMI, Feb. 2005). The Philadelphia transportation authority (SEPTA), however, maintained that PKF is was far behind schedule, failed to meet the eight milestones of the contract, or complete any of the activities. PKF, in turn, maintained that SEPTA's failure to accept work performed in accordance with the contract constituted a change in project scope, and SEPTA's lack of timely action regarding submittals, requests for information and drawings, claims and change orders are what took the project off schedule. Both groups have gone into litigation to resolve the issue, but the delays of litigation threaten the loss of federal funding for the project. If mediation instead of litigation had been included in the initial contract, the problem might have been more quickly resolved.
One additional use for a careful, complete project plan is when the project may be small and routine, but it is also carried out frequently, as in some maintenance projects. The complete planning process may be conducted to form a template for such projects—with particular emphasis on evaluation methods. With this template, planning similar projects is simple—just fill in the blanks. If changes in the plan are contemplated, the prescribed evaluation methods can be employed. This allows a “continuous improvement” program, sometimes called “rolling wave” planning, to be implemented with ongoing evaluation of suggested changes.
The project plan should contain eight elements: the project's purpose, a statement of objectives, a general overview, schedules of activities, a list of resource requirements or a project budget, a description of the stakeholders and personnel requirements, a description of potential risks, and the methods for evaluating the project. When all stakeholders have signed off on the plan, it becomes an operational Project Charter.
3.2 THE PLANNING PROCESS—OVERVIEW
A great deal has been written about planning. Some of the literature focuses on the strategic aspect of planning—(e.g., Webster, Reif, and Bracker, 1989) choosing and planning projects that contribute to the organization's goals (cf., the introduction to Section 1.5, in Chapter 1). Another body of writing is directed at the techniques of how to plan rather than what to plan (e.g., Pells, 1993; Prentis, 1989). These techniques, if we are to believe what we read, differ from industry to industry, from subject to subject. Architecture has a planning process; so does software development, as does construction, as well as pharmaceutical R&D projects, and campaigns for raising funds for charity.
As far as we can determine, the way that planning techniques vary in these different cases has more to do with nomenclature than substance. Consider, for example, the following planning process that has been divided into eight distinct steps.
- Develop and evaluate the concept of the project. Describe what it is you wish to develop, including its basic performance characteristics, and decide if getting such a deliverable is worthwhile. If so, continue.
- Carefully identify and spell out the actual capabilities that the project's deliverable must have to be successful. Design a system (product or service) that will have the requisite capabilities.
- Create such a system (product or service), which is to say, build a prototype deliverable.
- Test the prototype to see if it does, in fact, have the desired capabilities. If necessary, cycle back to step 3 to modify the prototype and retest it. Continue until the deliverable meets the preset requirements.
- Integrate the deliverable into the system for which it was designed. In other words, install the deliverable in its required setting.
- Validate the deliverable—which answers the question, “Now that we have installed the deliverable, does it still work properly?”
- If the deliverable has been validated, let the client test it. Can the client operate the system? If not, instruct the client.
- If the client can operate (and accepts) the deliverable, make sure that the client understands all standard operating and maintenance requirements. Then shake the client's hand, present the client with a written copy of maintenance and operating instructions, give the client the bill, and leave.
![]()
Reread the eight steps. Are they not an adequate description of the planning process for the design of a new pick-up truck, of a high-end hotel room, of a restaurant kitchen, of a machine tool, of a line of toys, etc.? They would need a bit of tweaking for some projects. An R&D project would need a more extensive risk analysis. If the project is a new pharmaceutical, for example, it would need toxicity and efficacy testing, and clearance from the FDA, but the general structure of the planning process is still adequate.
The eight steps above were originally written to describe the planning process for computer software (Aaron, Bratta, and Smith, 1993). There seem to be as many different planning sequences and steps as there are authors writing about planning. Almost all of them, regardless of the number of steps, meet the same criteria if they are meant to guide a project to a successful conclusion. The final plan must have the elements described in the previous section of this chapter.
There are many techniques for developing a project plan and Project Charter. They are fundamentally similar. All of them use a systematic analysis to identify and list the things that must be undertaken in order to achieve the project's objectives, to test and validate the plan, and to deliver it to the user.
3.3 THE PLANNING PROCESS—NUTS AND BOLTS
This section deals with the problem of determining and listing the various tasks that must be accomplished in order to complete a project. The important matters of generating a project budget and developing a precise project schedule are left to succeeding chapters, though much of the raw material for doing those important things will come from the planning process described here.
The Launch Meeting—and Subsequent Meetings
Once senior management has decided to fund a major project, or a highly important small project, a project launch meeting should be called. Preparation for this meeting is required (Knutson, 1995; Martin and Tate, 1998).
When a PM is appointed to head a new project, the PM's first job is to review the project objectives (project scope plus expected desirable outcomes that accrue to stakeholders from matters beyond the project's deliverables) with the senior manager who has fundamental responsibility for the project. The purpose of this interview is threefold: (1) to make sure that the PM understands the expectations that the organization, the client, and other stakeholders have for the project; (2) to identify those among the senior managers (in addition to the manager who is party to this interview) who have a major interest in the project; and (3) to determine if anything about the project is atypical for projects of the same general kind (e.g., a product/service development project undertaken in order to extend the firm's market into a new area).
Armed with this background, the PM should briefly study the project with an eye to preparing an invitation list for the project launch meeting. At the top of the list should be at least one representative of senior management, a strong preference given to the individual with the strongest interest in the project, the probable project champion. (The champion is usually, but not necessarily, the senior manager with responsibility for the project.) Recall in Chapter 2 we noted that the project champion could lend the political clout that is occasionally needed to overcome obstacles to cooperation from functional managers—if such obstacles were not amenable to dissolution by the PM.
Next on the invitation list come the managers from the functional areas that will be called upon to contribute competencies or capacities to the project. If highly specialized technical experts will be needed, the PM can add individuals with the required expertise to the list, after clearing the invitation with their immediate bosses, of course.
The PM may chair the launch meeting, but the senior manager introduces the project to the group, and discusses its contributions to the parent organization. If known and relevant, the project's tentative priority may be announced, as should the tentative budget estimate used in the project selection process. If the due dates for deliverables have been contracted, this should also be made clear. The purpose of senior management's presence is to ensure that the group understands the firm's commitment to the project. It is particularly important for the functional managers to understand that management is making a real commitment, not merely paying lip service.
At this point, the PM can take over the meeting and begin a group discussion of the project. It is, however, important for the senior manager(s) to remain for this discussion. The continuing presence of these august persons more or less assures cooperation from the functional units. The purpose of the discussion is to develop a general understanding of what functional inputs the project will need.
Table 3-1 Program Launch Meeting Output, Human Resources Development
Some launch meetings are restricted to brainstorming a problem. The output of such a meeting is shown in Table 3-1. In this case, the Director of Human Resources (HR) of a medium-size firm was asked by the Board of Directors to set up a program to improve employee retention. At the time, the firm had a turnover rate slightly above 60 percent per year among its technical employees. (A turnover rate of 50 percent was about average for the industry.) The HR Director held a launch meeting of all department heads, all senior corporate officers, and members of the Board. At this meeting, the group developed a list of “action items,” each of which became a project.
When dealing with a single project, it is common for a preliminary plan to be generated at the launch meeting, but we question the advisability of this. For either functional managers or the PM to guess at budgets or schedules with no real study of the project's deliverables is not prudent. First, the transition from a “tentative, wild guesstimate” made by senior managers or the EPMO to “but you promised” is instantaneous in these cases. Second, there is no foundation for mutual discussion or negotiation about different positions taken publicly and based on so little knowledge or thought. It is sufficient, in our judgment, to get a firm commitment from functional managers to study the proposed project and return for another meeting with a technically (and politically) feasible plan for their group's input to the project.
It has been said, “If this means many planning meetings and extensive use of participatory decision making, then it is well worth the effort (Ford and McLaughlin, 1992, p. 316). If the emphasis is on “participative decision making,” we agree. Actual planning at the launch meeting should not go beyond the most aggregated level unless the deliverables are well understood or the delivery date is cast in concrete and the organization has considerable experience with similar projects. Of course, if this is the case, a major launch meeting may not be required.
The results of the launch meeting should be that: (1) the project's scope is understood and temporarily fixed; (2) the various functional managers understand their responsibilities and have committed to develop an initial task and resource plan; and (3) any potential benefits to the organization outside the scope of the project are noted. In the meetings that follow, the project plan will become more and more detailed and firmer. When the group has developed what appears to be a workable plan with a schedule and budget that seem feasible, the plan moves through the appropriate management levels where it is approved, or altered and approved. If altered, it must be checked with those who did the planning. The planners may accept the alterations or a counterproposal may be made. The project plan may cycle up and down the managerial ladder several times before it receives final approval, at which time no further changes may be made without a formal change order (a procedure also described in the plan).
Irrespective of who alters (or suggests alterations to) the project plan during the process described above, it is imperative that everyone be kept fully informed. It is no more equitable for a senior manager to change a plan without consultation with the PM (and, hence, the project team) than it would be for the PM or the team to alter the plan without consultation and approval from senior management. If an arm's-length client is involved, the client's approval is required for any changes that will have an effect on the schedule, cost, or deliverable. Clearly, the PMO (or EPMO) can facilitate this process.
Open, honest, and frequent communication between the interested parties is critical for successful planning. What emerges from this process is sometimes called the project baseline plan. It contains all the nine elements noted in Section 3.1 and all amendments to the plan adopted as the project is carried out. As noted above, when senior management, the client, and other stakeholders have “signed-off” on the plan, it becomes a part of the Project Charter, a contract-like document affirming that all major parties-at-interest to the project are in agreement on the deliverables, the cost, and the schedule.
Sorting Out the Project—The Work Breakdown Structure (WBS)
Inadequate up-front planning, especially failing to identify all important tasks, is a primary contributor to the failure of a project to achieve its cost and time objectives. Therefore, a primary purpose for developing a WBS is to ensure that any task required to produce a deliverable is not overlooked and thereby not accounted for and planned. PMBOK describes the construction of the WBS primarily in Chapter 5 on Scope, but it is also touched upon in Chapters 6 (Time), 7 (Cost), and 8 (Quality).
![]()
The previous subsection discussed the planning process as seen from the outside. The PM and the functional managers developed plans as if by magic. It is now time to be specific about how such plans may be generated. In order to develop a project plan that will take us from start to finish of a project, we need to know precisely what must be done, by whom, when, and with what resources. Every task, however small, that must be completed in order to complete the project should be listed together with any required material or human resources.
Making such a list is a nontrivial job. It requires a systematic procedure. While there are several systematic procedures that may be used, we advise a straightforward and conceptually simple way to attack the problem—the hierarchical planning process— which is how to build a Work Breakdown Structure (WBS) for the project.
To use this process, one must start with the project's objective(s). The planner, often the PM, makes a list of the major activities that must be completed to achieve the objective(s). The list may be as short as two or three activities, or as large as 20. Usually the number is between 5 and 15. We call these Level 1 activities. The planner now takes each Level 1 activity and delegates it to an individual or functional group. (The PM might delegate one or more Level 1 tasks to him- or herself.) The delegatee deals with the task as if it is itself a project and makes a plan to accomplish it; that is, he or she lists a specific set of Level 2 tasks required to complete each Level 1 task. Again, the breakdown typically runs between 5 and 15 tasks, but a few more or less does not matter. The process continues. For each Level 2 task, someone or some group is delegated responsibility to prepare an action plan of Level 3 subtasks. The procedure of successively decomposing larger tasks into their component parts continues until the lowest level subtasks are sufficiently understood so that there is no reason to continue. As a rule of thumb, the lowest level tasks in a typical project will have a duration of a few hours to a few days. If the team is quite familiar with the work, longer durations are acceptable for the lowest level tasks.
Another simple approach to creating the WBS begins by gathering the project team together and providing each member with a pad of sticky-notes. After defining the project's objectives, and Level 1 tasks, team members then write on the sticky-notes all the tasks they can think of that are required to complete the project. The sticky-notes can then be placed on the wall and arranged in various ways. One advantage of this approach is that it provides the entire team with a better understanding of the work needed to complete the project. The fact that it is a cooperative exercise also helps the project team to bond. Finally, this exercise can generate a WBS tree. Figure 3-1 illustrates the tree. A colleague called this a “Gozinto chart.” (He said it was named after a famous Italian mathematician, Prof. Zepartzat Gozinto. The name has stuck.)

Figure 3-1 A partial WBS (Gozinto chart) for an Annual Tribute Dinner project.
Microsoft Project (MSP) will make a WBS list (but not a tree-chart) at the touch of a key. The task levels are appropriately identified; for example, the WBS number “7.5.4” refers to the “Level 3, task Number 4” that is needed for “Level 2, task 5” that is a part of “Level 1, task 7.” (The PM has the option of using any other identification system desired, but must enter the identifiers manually.)
Task levels are appropriately organized on the MSP printout, with Level 1 tasks to the left and others indented by level. If one uses a tree diagram and each task is represented by a box with the WBS identifier number, one can add any information one wishes—given that it will fit in the box. Such an entry might be the proper account number to charge for work done on that task, or the name of the individual (or department) with task responsibility, or with a space for the responsible party's signature denoting that the person has accepted accountability by “signing-off.” As we will see, additional information is often added by turning the “tree” into a list with columns for the additional data.
In doing hierarchical planning, only one rule appears to be mandatory. At any given level, the “generality” or “degree of detail” of the tasks should be roughly at the same level. One should not use highly detailed tasks for Level 1 plans, and one should not add very general tasks at Level 3 or more. This can best be done by finding all Level 2 subtasks for each Level 1 task before moving one's attention to the Level 3 subtasks. Similarly, break all Level 2 tasks into their respective Level 3 tasks before considering any Level 4 subtasks, if the breakdown proceeds that far. A friend of ours who was an internationally known artist and teacher of industrial design explained why. When producing a painting or drawing, an artist first sketches-in the main compositional lines in the scene. The artist then adds detail, bit by bit, over the whole drawing, continuing this process until the work is completed. If this is done, the finished work will have “unity.” Unity is not achieved if individual areas of the picture are completed in detail before moving on to other areas. A young art student then made a pen-and-ink sketch of a fellow student, showing her progress at three different stages (see Figure 3-2).
We have said that the breakdown of Level 1 tasks should be delegated to someone who will carry out the Level 2 tasks. It is the same with Level 2 tasks being delegated to someone who will design and carry out the required Level 3 tasks. A relevant question is “Who are all these delegatees?” Let's assume that the project in question is of reasonable size, neither very large nor small. Assume further that the PM and the functional managers are reasonably experienced in dealing with similar projects. In such a case, the PM would probably start by working on Level 1. Based on her background, the PM might work on Level 2 of one or more of the Level 1 tasks. Where recent experience was missing, she would delegate to the proper functional manager the task of specifying the Level 2 tasks. In the same way, the latter would delegate Level 3 task specification to the people who have the appropriate knowledge.
In general, the job of planning should be delegated to the lowest competent level. At Level 1, this is usually the PM. At lower levels, functional managers and specialists are the best planners. In Chapter 2 (Section 2.1) we described that strange bugbear, the micromanager. It is common for micromanagers to preempt the planning function from subordinates or, as an alternative, to allow the subordinate to develop an initial plan that the micromanager will amend with potentially disastrous results. The latter is an event reported with some frequency (and accuracy) in Dilbert©.
Extensions of the Everyday WBS
The WBS can be reshaped and buttressed with some additional data often not included in the project's WBS. The WBS is generally oriented toward the project's deliverables. The additions increase its orientation toward the planning and administration of the work. It does this by using available material, while adopting a format that is not typically used by the WBS. Figure 3-3 illustrates a layout that helps to organize the required information. We refer to these layouts as “modified” WBSs. The additional data in the columns are: (1) estimates of the resources required for each task in the plan, (2) the estimated time required to accomplish each task, (3) information about who has responsibility for the task, and (4) data that will allow tasks to be sequenced so that the set may be completed in the shortest possible time. Once the project starting date is known, item 2 in the preceding list may be changed from the time required for a subtask completion to the date on which the subtask is scheduled for completion.

Figure 3-2 Three levels of detail in hierarchical planning.
To understand the importance of item 4 in the list, consider a set of subtasks, all of which must be completed to accomplish a parent task on a higher level. It is common in such a set that one or more subtasks (A) must be completed before one or more other subtasks (B) may be started. The former tasks (A) are said to be predecessors of the successor tasks (B). For instance, if our project is to paint the walls of a room, we know that before we apply paint to a wall, we must do a number of predecessor tasks. These predecessors include: clear the floor area near the wall to be painted and cover with drop cloths; remove pictures from the wall; clean loose dirt, oil, grease, stains, and the like from the wall; fill and smooth any cracks or holes in the wall; lightly sand or score the wall if it has previously been painted with a high-gloss paint; wipe with a damp cloth or sponge to remove dust from the sanding; and mask any surrounding areas where this paint is not wanted. All these tasks are predecessors to the task “Paint the walls.”
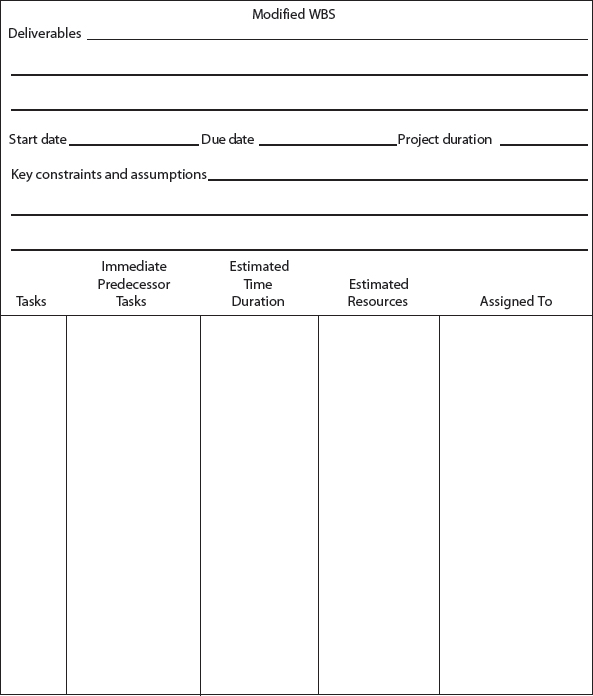
Figure 3-3 A form to assist hierarchical planning.
The predecessor tasks for “paint the walls” have been listed in the order in which they might be done if only one person was working. If several people are available, several of these tasks might be done at the same time. Note that if three tasks can be done simultaneously, the total elapsed time required is the time needed for the longest of the three, not the sum of the three task times. This notion is critical for scheduling, so predecessors must be listed in the WBS. One convention is important. When listing predecessors, only the immediate predecessors are listed. If A precedes B and B precedes C, only B is a predecessor of C.
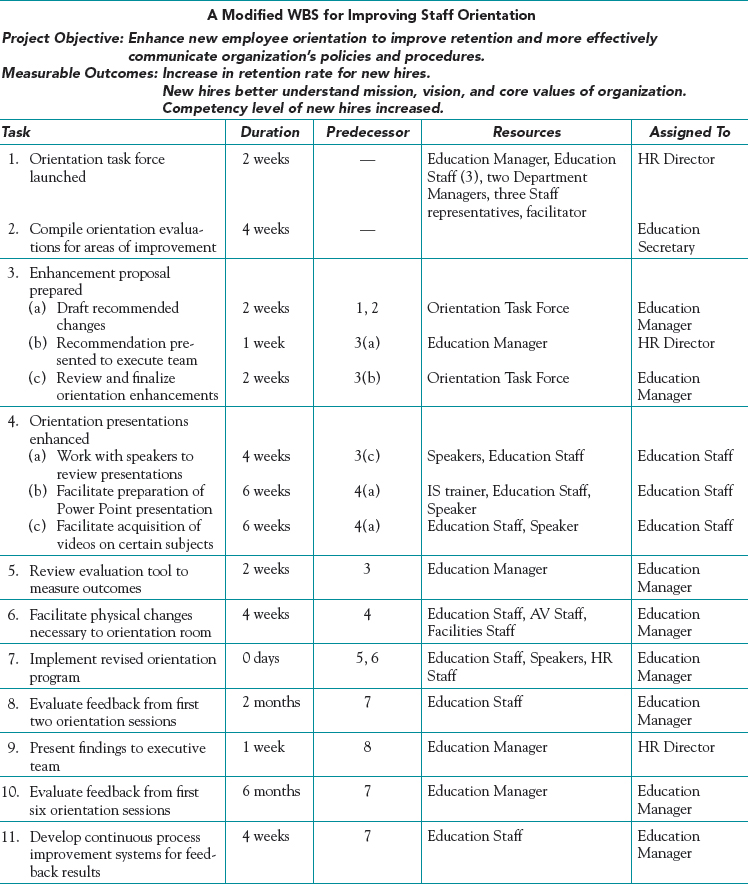
While Table 3-1 illustrates the output of a project launch meeting (more accurately a program launch meeting), Table 3-2 shows a WBS for one of the action items resulting from the launch meeting. With the exception of tasks 3 and 4, it is a Level 1 plan. Three Level 2 items are shown for tasks 3 and 4. Because the HR Director is quite familiar with such projects, violating the one-level-only rule is forgivable. Note also that the HR Director has delegated some of the work to himself. Note also that instead of assumptions being shown at the beginning of the WBS, project evaluation measures were listed.
Table 3-2 A Modified WBS for Improving Staff Orientation
The WBS not only identifies the deliverable, but also may note the start date if it is known or other information one wishes to show. Once the subtasks and their predecessors have been listed along with the estimated subtask activity times, the probable duration for the set of subtasks, and thus the task due date, can be determined as we will see in Chapter 5. If the estimates for the durations and resource requirements for accomplishing the subtasks are subject to constraints (e.g., no overtime work is allowed) or assumptions (e.g., there will be no work stoppage at our subcontractor's plant), these should be noted in the WBS.
If one wishes, the information in the form shown in Figure 3-2 can be entered directly into Microsoft Project® (MSP). Alternatively, one can produce a WBS using MSP, directly, as shown in Figure 3-4. The project title can be entered in a header or footer to the form, as can other information such as a brief description of the deliverables, the name of the PM or the task manager, the project start and/or due dates, and the like.
Table 3-3 shows a WBS generated on MSP with task durations, and start and finish times for the Level 1 tasks in an infection control project. The project begins on September 12 and ends on November 30. As is customary, people work a five-day week so a three-week task has 15 work days and 21 calendar days (three weeks), assuming that the individual or team is working full-time on the task. As we will see in Chapter 5, one usually dares not make that assumption and should check carefully to determine whether or not it is a fact. If the one performing the task is working part-time, a task that requires 5 days of work, for example, may require several weeks of calendar time. We will revisit this problem in Chapter 5.

Figure 3-4 A WBS as an output of MSP.
MSP makes the task of Level 1 planning of the broad project tasks quite straight-forward. The same is true when the planners wish to generate a more detailed listing of all the steps involved in a project. The PM merely lists the overall tasks identified by the planning team as the activities required to produce the project deliverables—for example, the output of a brainstorming session. The PM and the planning team can then estimate task durations and use MSP to create a WBS. Table 3-4 shows a planning template used by a software company when they have their initial project brainstorming meetings about delivering on a customer request.
MSP has a planning wizard that guides the PM through the process of identifying all that is necessary to take an idea for a project activity and turn it into a useful WBS.
Table 3-5 is an example of a template developed by a computer systems support company. Company planners repeatedly performed the same steps when clients would ask for a local area network (LAN) installation. They treated each job as if it were a new project, because costs and resource assignments varied with each assignment. To improve efficiency, they developed a planning template using MSP. After meeting with a client, the project manager could add the agreed-upon project start date, and any constraints on the schedule required by the client. The steps to install the LAN remained the same. The start and finish dates, and the number of resources needed to meet the schedule were adjusted for each individual client, but the adjustments were usually small. Once the schedule of a specific job was decided, the PM could determine the resources needed to meet that schedule and find the cost of the project.
Table 3-3 A WBS Showing Level 1 Tasks for an Infection Control Project (MSP)
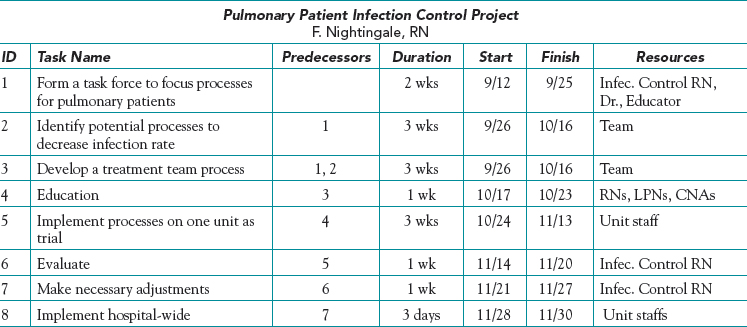
Table 3-4 Template for a Brainstorming Planning Meeting
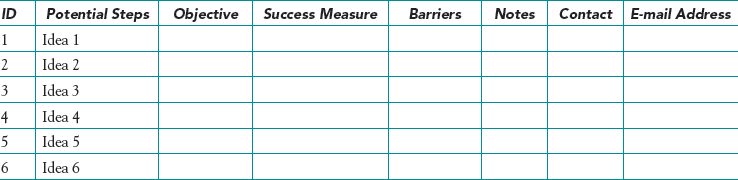
Table 3-5 An MSP Template for a LAN Installation Project

Creating this kind of template is simple. The software can calculate the cost of each different project which is most helpful to the project manager if cost, prices, or schedules must be negotiated. If the client wants the project to be completed earlier than scheduled, the PM can add the additional resources needed and project management software can determine the costs associated with the change.
If the PM wishes to include other information in the project's modified WBS, there is no reason not to do so. Some include a column to list the status of resource or personnel availability. Others list task start dates.
The project launch meeting sets the project scope, elicits cooperation of others in the organization, demonstrates managerial commitment to the project, and initiates the project plan. The plan itself is generated through a hierarchical planning process by which parts of the plan are sequentially broken down into finer levels of detail by the individuals or groups that will implement them. The result is a WBS that lists all the tasks required to carry out the plan together with task resource requirements, durations, predecessors, and identification of the people responsible for each task.
3.4 MORE ON THE WORK BREAKDOWN STRUCTURE AND OTHER AIDS
At times, PMs seem to forget that many of the conventional forms, charts, and tables that they must fill out are intended to serve as aids, not punishments. They also forget that the forms, charts, and tables are not cast in bronze, but, like Emeril's recipes, may be changed to fit the PM's taste. In addition to the matters just covered, there is more about the WBS and two other useful aids—the Responsible-Accountable-Consult-Informed Matrix (RACI Matrix), and Mind Mapping—that merits discussion.
The process of building a WBS is meaningful. The PM and individual team members may differ on the technical approach to working on the task, the type and quantity of resources needed, or the duration for each subtask. If so, negotiation is apt to accompany the planning process. As usual, participatory management and negotiation often lead to improved project performance and better ways of meeting the project's goals.
The RACI Matrix
![]()
Like the WBS, the RACI Matrix comes in a variety of sizes and shapes. Typically, the RACI matrix is in the form of a table with the project tasks derived from the WBS listed in the rows and departments or individuals in the columns. PMBOK describes the RACI matrix in Chapter 9 on Human Resources. The value of the RACI Matrix is that it helps organize the project team by clarifying the responsibilities of the project team members. For an example of a simple RACI Matrix, see Figure 3-5.

In Figure 3-5, letters are used to indicate the nature of the responsibility link between a person and a task. Note that there must be at least one A in every row, which means that someone must be accountable for completion of each task. For example, examine the row with the task “Solicit quotations.” In this case the Project Engineer is accountable for the task being carried out while the Field Manager will be responsible for actually doing the work associated with soliciting quotations. The project's Contract Administrator and the Compliance Officer/Risk Manager must be consulted about the solicitation process. The PM must be informed before documents are sent to potential vendors. Note that a particular individual or department can be assigned multiple responsibility links. For example, it is common for a person to be both accountable and responsible for a particular task. Other common combinations include consult/inform and accountable/consult.
Standard RACI Matrix templates are available to facilitate their development. One can use symbols or numbers as opposed to letters to refer to different responsibility relationships, and the references may be to departments, job titles, or names. Only imagination and the needs of the project and PM bound the potential variety. Likewise, additional columns can be added to the RACI Matrix to capture the due dates of tasks, actual dates completed, the status of tasks, performance metrics, and so on.
A final observation is needed on this subject. When we speak to functional managers about project management, one comment we often hear is anger about changes in the project plan without notification to the people who are supposed to conduct the tasks or supply services to the project. One quote from the head of a statistics lab in a large consulting firm is typical. The head of the lab was speaking of the manager of a consulting project for a governmental agency when he said, “I pulled three of my best people off other work to reserve them for data analysis on the XYZ Project. They sat for days waiting for the data. That jerk [the PM] knew the data would be late and never bothered to let me know. Then the *%$#@% had the gall to come in here and ask me to speed up our analysis so he could make up lost time.”
Make sure to use the Inform category, not simply to report progress, but also to report changes in due dates, resource requirements, and the like.
A Whole-Brain Approach to Project Planning
![]()
In today's fiercely competitive environment, project teams are facing increasing pressure to achieve project performance goals while at the same time completing their projects on time and on schedule. Typically project managers and project team members rely on the “left” side or the analytical part of the brain to address the challenges. Indeed, if you are a business or engineering student, the vast majority of techniques that you have been exposed to in your studies relies on the logical and analytical left side of your brain. On the other hand, art students and design students tend to be exposed to techniques that rely more on imagination and images which utilize the creative “right” side of the brain. Importantly, many activities associated with project management can be greatly facilitated through the use of a more balanced whole-brain approach (Brown and Hyer, 2002).
One whole-brain approach that is particularly applicable to project management in general, and project planning in particular, is mind mapping. Mind mapping is essentially a visual approach that closely mirrors how the human brain records and stores information. In addition to its visual nature, another key advantage associated with mind mapping is that it helps tap the creative potential of the entire project team, which, in turn, helps increase both the quantity and quality of ideas generated. Because project team members tend to find mind mapping entertaining, it also helps generate enthusiasm, helps get buy-in from team members, and often gets quieter team members more involved in the planning process.
To illustrate the creation of a mind map, consider a project launched at a graduate business school to improve its part-time evening MBA program for working professionals. The mind mapping exercise is initiated by taping a large sheet of paper (e.g., 6 ft × 3 ft) on a wall. (One good source of such paper is a roll of butcher's wrapping paper. Several sheets can be taped together to create a larger area if needed.) It is recommended that the paper be oriented in landscape mode to help stimulate the team's creativity as people are used to working in portrait mode. In addition, team members should stand during the mind mapping exercise.
The process begins by writing the project goal in the center of the page. As is illustrated in Figure 3-6, the part-time MBA project team defined the goal for the project as generating ideas for breakthrough performance in the part-time MBA program. In particular, notice the inspirational language used in defining the project goal which helps further motivate team members and stimulate their creativity.
Once the project goal is defined, team members can brainstorm to identify the major tasks that must be done to accomplish this goal. In developing the mind map for the project, the MBA team initially identified four major tasks: (1) define the role of working professional programs (WPPs), (2) generate ideas for improving current programs, (3) generate ideas for diversification, and (4) evaluate the ideas generated. As illustrated in Figure 3-7, these major tasks branch off from the project goal.
Developing the mind map proceeds in this fashion whereby components in the mind map are continuously broken down into more detailed tasks. For example, Figure 3-8 illustrates how the define role of the WPPs task was broken down into more detailed tasks. Figure 3-9 provides the final map for the MBA project.

Figure 3-6 Begin mind mapping with statement of project's objective.

Figure 3-7 Major tasks branch off from project goal.
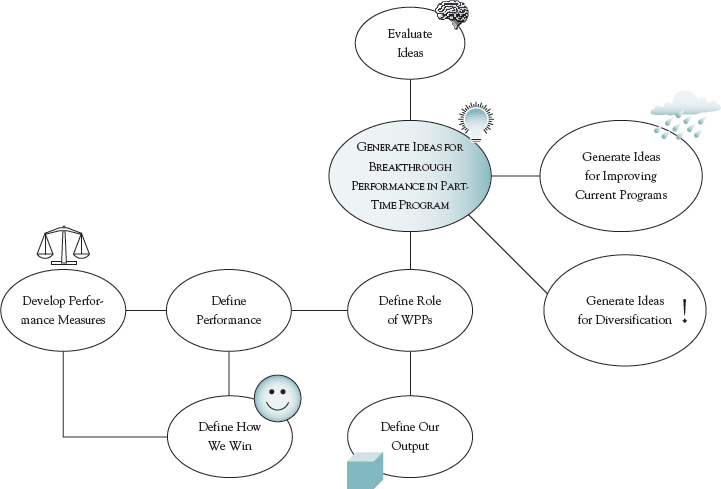
Figure 3-8 Major tasks are further broken down into more detailed tasks.
A couple of comments regarding the process of mind mapping are in order. First, color, word size, word shape, and pictures should all be used to add emphasis. In fact, team members should be encouraged to use pictures and images in the mind map over using words. The brain processes and responds to symbols and pictures differently than it does to words. When using words, key words as opposed to full sentences should be used. Also, it should be noted that it is OK to be messy when developing the original mind map. Indeed, one should not expect the original mind map to resemble something as polished as the mind map shown in Figure 3-9. Rather, the mind map will typically need to go through several iterations of polishing and refining. It should also be noted that the polishing and refining can be greatly facilitated with the use of a computer graphics program.
In addition, multiple team members can and should contribute to the mind map simultaneously. In fact, one team member should be formally designated as the facilitator to ensure that all team members are contributing to keep team members focused on the project, and to ensure that team members are focusing on project tasks—not goals. Finally, at the most detailed level, tasks should be expressed using a noun and a verb (e.g., develop measures, generate ideas, define output).

Figure 3-9 Final mind map for part-time MBA program project.
Unfortunately, it is all too common for projects to go over budget and/or be completed late. In many cases insufficient upfront planning is the major culprit. With inadequate upfront planning, important tasks are overlooked, which in turn results in underestimating the project budget and duration. Mind mapping is a fast and effective tool that can greatly facilitate project planning and help minimize problems that result from inadequate upfront planning.
![]()
A polished and refined mind map facilitates a number of other project-related activities. For example, the mind map can be easily converted into the traditional WBS. Furthermore, the mind map can be used to facilitate risk analysis, setting project team meeting agendas, allocating resources to project activities, and developing the project schedule (see Brown and Hyer, 2002, for additional details on the use of mind mapping for project management).
From the Work Breakdown Structure, one can extract a list of all tasks arranged by task level. The WBS will show numeric identifiers for each task plus other information as desired. The WBS may take a wide variety of forms. From the WBS one can also develop the RACI Matrix which details the nature of responsibility of each individual or group involved in the project to the specific tasks required to complete the project. Mind mapping can greatly enrich the planning process.
3.5 RISK MANAGEMENT
![]()
It was noted in Chapter 1 that the primary role of the project manager is managing trade-offs between time, budget, scope, and risk. As we discuss in this section, there are a host of activities that can be completed during the project planning phase that greatly facilitate managing project related risks.
![]()
![]()
The field of risk management has grown considerably over the last decade. The Project Management Institute's PMBOK (2013) devotes Chapter 11 to this topic. In general, risk management includes three areas: (1) risk identification, (2) risk analysis, and (3) response to risk. The process of accomplishing these three tasks is broken down into six subprocesses:
- Risk Management Planning developing a plan for risk management activities.
- Risk Identification finding those risks that might affect the project.
- Qualitative Risk Analysis evaluating the seriousness of the risk and the likelihood it will affect the project.
- Quantitative Risk Analysis developing measures for the probability of the risk and its impact on the project.
- Risk Response Planning finding ways of reducing negative impacts on the project as well as enhancing positive impacts.
- Risk Monitoring and Control maintaining records of and evaluating the subprocesses above in order to improve risk management.
1. Risk Management Planning This planning process is like any other planning process. First, a method for carrying out steps 2 through 5 for any project must be designed. Care must be exercised to ensure that the necessary resources can be applied in a timely and well-organized manner. The planning process, just as the task of managing risk, is a continuous process. The factors that cause uncertainty appear, disappear, and change strength as time passes and the environment of a project changes. Note that planning how to deal with uncertainty is an organizational problem, not specifically a project problem. The result is that many firms create a formal, risk management group, whose job it is to aid the project management team in doing steps 2 through 5. The overall risk management group develops plans and maintains the database resulting from step 6.
Some of the inputs and outputs of steps 2 through 5 are unique to the project, and some are common for all projects. The overall group helps individual project risk teams with the necessary analytic techniques, information gathering, the development of options for response, and monitoring and evaluating the results.
2–3. Risk Identification and Qualitative Risk Analysis We list these steps together because in practice they are often carried out together. As a risk is identified, an attempt to measure its timing, likelihood, and impact is often made concurrently.
Risk identification consists of a thorough study of all sources of risk in the project. Common sources of risk include the organization of the project itself; senior management of the project organization; the client; the skills and character of the project team members, including the PM; and acts of nature.
Scenario Analysis Scenario analysis is a well-known method for identifying serious risks. It involves envisioning likely scenarios that may have major repercussions on the organization and then identifying the possible resulting outcomes of events such as a hurricane in New Orleans, an extended labor strike, the freezing of a river, or the failure of an oil well head 5000 feet below the water surface in the gulf of Mexico. These types of risk can often be identified and evaluated by project stakeholders or outside parties with previous experience in similar projects. Beyond this, a close analysis of the project plan, the WBS, and the RACI Matrix, as well as the PERT chart (Chapter 5) will often identify highly probable risks, extremely serious risks, or highly vulnerable areas, should anything go wrong.
After the major risks are identified, the following data should be obtained on each to facilitate further analysis: the probability of each risk event occurring, the range or distribution of possible outcomes if it does occur, the probabilities of each outcome, and the expected timing of each outcome. In most cases, good estimates will not be available, but getting as much data and as accurate estimates as possible will be crucial for the follow-on risk analysis. Above all, remember that a “best guess” is always better than no information.
![]()
Failure Mode and Effect Analysis (FMEA) FMEA is a structured approach similar to the scoring methods discussed in Chapter 1 to help identify, prioritize, and better manage risk. Developed by the space program in the 1960s, FMEA can be applied to projects using the following six steps.
- List ways the project might potentially fail.
- List the consequences of each failure and evaluate its severity. Often severity, S, is ranked using a ten-point scale, where “1” represents failures with no effect and “10” represents very severe and hazardous failures that occur with no warning.
- List the causes of each failure and estimate their likelihood of occurring. The likelihood of a failure occurring, L, is also customarily ranked on a ten-point scale, with a “1” indicating the failure is rather remote and not likely to occur and “10” indicating the failure is almost certain to occur.
- Estimate the ability to detect each failure identified. Again, the detectability of failures, D, is customarily ranked using a ten-point scale, where a “1” is used when monitoring and control systems are almost certain to detect the failure and “10” where it is virtually certain the failure will not be detected.
- Calculate the Risk Priority Number (RPN) by multiplying S, L, and D together.
- Sort the list of potential failures by their RPNs and consider ways for reducing the risk associated with failures with high RPNs.
Table 3-6 illustrates the results of a FMEA conducted to assess the risk of a new drug development project at a pharmaceutical company. As shown in the table, five potential failures for the project were identified: (1) The new drug is not effective at treating the ailment in question, (2) the drug is not safe, (3) the drug interacts with other drugs, (4) another company beats it to the market with a similar drug, and (5) the company is not able to produce the drug in mass quantities. According to the results, the most significant risk is the risk of developing a new drug that is not effective. While it is unlikely that much can be done to reduce the severity of this outcome, steps can be taken to reduce the likelihood of this outcome as well as increase its detectability. For example, advanced computer technologies can be utilized to generate chemicals with more predicable effects. Likewise, perhaps earlier human clinical and animal trials can be used to help detect the effectiveness of new drugs sooner. In this case, if both L and D could each be reduced by one, the overall RPN would be reduced from 240 to 160.
Table 3-6 FMEA for New Product Development Project at Pharmaceutical Company

4. Quantitative Risk Analysis Hertz and Thomas (1983) and Nobel prize winner Herbert Simon (1997) have written two classic books on this topic. As we noted in Chapter 1, the essence of risk analysis is to state the various outcomes of a decision as probability distributions and to use these distributions to evaluate the desirability of certain managerial decisions. The objective is to illustrate to the manager the distribution or risk profile of the outcomes (e.g., profits, completion dates, return on investment) of investing in some project. These risk profiles are one factor to be considered when making the decision, along with many others such as intangibles, strategic concerns, behavioral issues, fit with the organization, and so on.
A case in point is Sydney, Australia's M5 East Tunnel (PMI, March 2005). It was constructed under strict budgetary and schedule requirements, but given the massive traffic delays now hampering commuters, the requirements may have been seriously underestimated. Due to an inexpensive computer system with a high failure rate, the tunnel's security cameras frequently fail, requiring the operators to close the tunnel due to inability to react to an accident, fire, or excessive pollution inside the tunnel. The tunnel was built to handle 70,000 vehicles a day, but it carries 100,000 so any glitch can cause immediate traffic snarls. A risk analysis, including the risk of overuse, probably would have anticipated these problems and mandated a more reliable set of computers once the costs of failure had been included.
Estimates Before discussing the risk analysis techniques, we need to discuss some issues concerning the input data coming out of the qualitative analysis of step 3. We assume here that estimating the range and timing of possible outcomes of a risky event is not a problem but that the probabilities of each may be harder to establish. Given no actual data on the probabilities, the best guesses of people familiar with the problem is a reasonable substitute. An example of such guesses (a.k.a. estimates) can be seen in Table 3-7.
Knowledgeable individuals are asked for three estimates of the cost of each activity, a normal estimate plus optimistic and pessimistic estimates of the cost for each. From these an expected value for the cost of an activity can be found, but we will delay discussing this calculation until Chapter 5 where we show such calculations for either cost or durations.
If approximations cannot be made, there are other approaches that can be used. One approach is to assume that all outcomes are equally probable, though there is no more justification for this assumption than assuming any other arbitrarily chosen probability values. Bear in mind that when using the common expected-value approach (see below) to help make a decision, the result can be misleading. For example, the probability of a disaster may be very low (resulting in a low expected value), but such risks must be carefully managed nonetheless, such as with insurance or extensive contingency planning.
Expected Value When probability information is available or can be estimated, many risk analysis techniques use the concept of expected value of an outcome—that is, the value of an outcome multiplied by the probability of that outcome occurring. For example, in a coin toss using a quarter, there are two possible outcomes and the expected value of the game is the sum of the expected values of all outcomes. It is easily calculated. Assume that if the coin comes up “head” you win a quarter, but if it is “tails” you lose a quarter. We also assume that the coin being flipped is a “fair” coin and has a .5 probability of coming up either heads or tails. The expected value of this game is
E (coin toss) = .5($.25) + .5($− .25) = 0
A decision table (a.k.a. a payoff-matrix), such as illustrated in Table 3-8, is a technique commonly used for single-period decision situations where there are a limited number of decision choices and a limited number of possible outcomes.
In the following decision table, there are four features:
- Three decision choices or alternatives, Ai.
- Four states of nature, Sj, that may occur.
- Each state of nature has its own probability of occurring, pj, but the sum of the probabilities must be 1.0.
- The outcomes associated with each alternative and state of nature combination, Oij, are shown in the body of the table.
If a particular alternative, Ai, is chosen, we calculate the expected value of that alternative as follows:
![]()
Table 3-7 Optimistic, Normal, and Pessimistic Cost Estimates for the Annual Tribute Dinner

Table 3-8 Decision Table (or payoff matrix) for Sample Problem

For example, using the data from Table 3-8 for alternative “Fast” we get
E (Fast) = 0.1(14) + 0.4(10) + 0.3(6) + 0.2(1) = 7.4
The reader may recall that we used a similar payoff matrix in Chapter 1, when we considered the problem of buying a car. In that example, the criteria weights played the same role as probabilities play in the example above.
![]()
Simulation We will demonstrate simulation in the next chapter (4) and will demonstrate it more in later chapters. In recent years, simulation software has made the process user friendly and far simpler than in the midtwentieth century. It has become one of the most powerful techniques for dealing with risks that can be described in numeric terms. The most difficult problems involved with the use of simulation are (1) explaining the power of using three point estimates (most likely, optimistic, and pessimistic) instead of the single point estimates decision makers have always used; and (2) explaining the notion of statistical distributions to people whose only acquaintance with statistical distributions is the (mistaken) notion that the grades in the classroom are, or should be, distributed by “the curve.” Once the fundamental ideas behind a Monte Carlo simulation are understood, the power of the technique in dealing with risk is obvious. Even more potent is the notion that one can estimate the likelihood that certain risky outcomes will actually occur, such as the probability that project costs will be at or below a given limit, or the chance that a project will be completed as scheduled.
There is another problem with using simulation, or any process involving estimates of project costs, schedules, etc. It is convincing anyone connected to a project to make honest estimates of durations, costs, or any other variables connected with a project. The problem is the same whether one asks for single point or three point estimates. Asking individuals to be accountable for their estimates is always difficult for the askee, and project managers are advised to use their best interpersonal communication styles when seeking to improve project cost and time estimates. The PMI's code of ethics demands honesty, and PMs should strive to ensure it.
5. Risk Response Planning Risk response typically involves decisions about which risks to prepare for and which to ignore and simply accept as potential threats. The main preparation for a risk is the development of a risk response plan. Such a plan includes contingency plans and logic charts detailing exactly what to do depending on particular events (Mallak, Kurstedt, and Patzak, 1997). For example, Iceland is frequently subjected to unexpected avalanches and has thus prepared a detailed response plan for such events, stating who is in charge, the tasks that various agencies are to do at particular times, and so on. Actually practicing those responses with dress rehearsals is particularly important if the risk is a potentially life-or-death emergency.
Contingency Plan A contingency plan is a backup for some emergency or unplanned event, often referred to colloquially as “plan B,” and there may also need to be a plan C and a plan D as well, for an even deeper emergency such as an oil spill in the gulf of Mexico, to give a wildly improbable example. The contingency plan includes who is in charge, what resources are available to the person, where backup facilities may be located, who will be supporting the person in charge and in what manner, and so on.
In another example, when Hurricane Katrina hit Mississippi and New Orleans in August 2005, Melvin Wilson of Mississippi Power, a subsidiary of 1250 employees, became “Director of Storm Logistics” for the duration. As a contingency, Mississippi Power subscribes to three weather forecasting services and in this case decided the most severe forecast was the right one. Wilson called for a retreat from the company's high-rise headquarters on the beach to a backup contingency office at a power plant 5 miles inland. By noon, the backup power plant flooded and lost power, which was not in the plan, and the cars in the parking lot were floating. A company security van made it through to take the storm team to a third option for a storm center—a service office in North Gulfport that had survived Hurricane Camille in 1969—there was no fourth option. The office was dry but without electricity or running water. The phone lines were down, and cell phones were useless but the company's own 1100 cell phones plus 500 extras to lend out had a unique radio function, and that worked. They were the only working communications for the first 72 hours on the gulf coast. The company's worst-case contingency plans had never imagined managing a repair crew of over 4000 from outside. But Wilson became responsible for directing and supporting 11,000 repairmen from 24 states and Canada, feeding and housing them in 30 staging areas including six full-service tent cities that housed 1800 each. He had to find 5000 trucks and 140,000 gallons of gasoline a day to help restore power to 195,000 customers. Within 12 days of the storm, power had been restored to all customers except a few thousand whose lines were too damaged to receive electricity. Clearly, Mississippi Power had not made contingency plans for such an extreme event, but the plans they had made, and the backups to those plans, were sufficient to give a smart team of emergency responders the chance to successfully handle this crisis.
Logic Chart Logic charts show the flow of activities once a backup plan is initiated. They force managers to think through the critical steps that will need to be accomplished in a crisis, and provide an overview of the response events and recovery operations. They include decisions, tasks, notifications, support needs, information flows, and other such activities. They are time independent and illustrate the many tasks as well as dependencies and interdependencies that emerge out of the initial response steps, such as: “If X has happened, do this; otherwise, do that.”
6. Risk Monitoring and Control Like risk management planning, monitoring and control are tasks for the parent organization, as well as for the project. If the overall risk management group is not involved along with the project in performing the tasks of recording and maintaining records of what risks were identified, how they were analyzed and responded to, and what resulted from the responses, the records have a high probability of being lost forever when the project is completed (or abandoned). If records are lost or not easily available, the chance that other projects will “learn from the experiences of others” is very low.
It is the job of the risk management group to maintain records for how all projects deal with risks. The group, however, is not merely a passive record holder. It should be involved in the search for new risks, for developing new and better techniques of measuring and handling risk, and estimating the impact of risks on projects. Thus, the group should become an advisor to project risk management teams. It should provide an ongoing evaluation of current risk identification, measurement, analysis, and response techniques. Fundamentally, the group is devoted to the improvement of the organization's risk management activities.
Risk management consists of risk planning and identification, qualitative and quantitative risk analysis, risk response, and risk monitoring and control. We deal with risk primarily through such means as decision tables, simulation, and response, which entail identifying which risks will be prepared for and which will be ignored and simply accepted.
In the next chapter, we use the project plan to develop a project budget. We discuss conflict surrounding the budgetary process. Then we deal with uncertainty, the project's (and PM's) constant companion.
REVIEW QUESTIONS
- What are some benefits of setting up a project plan for similar, frequent projects?
- Discuss the reasons for inviting the functional managers to a project launch meeting rather than their subordinates who may actually be doing the work.
- Discuss the pros and cons of identifying and including the project team at the project launch meeting.
- Why is participatory management beneficial to project planning? How does the process of participatory management actually work in planning?
- What is the difference between the Resource column on the WBS (that would include personnel needed by the project) and the Assigned To column?
- Under what circumstances is it sensible to do without a project launch meeting?
- Distinguish among highly probable risks, extremely serious risks, and highly vulnerable areas in risk identification.
DISCUSSION QUESTIONS
8. For each one of the eight components of a project plan, discuss the problems that might be raised if the element was incomplete.
9. Give several examples of a type of project that would benefit from a template project plan being developed.
10. Why is the hierarchical planning process useful for project planning? How might it influence the plan if the hierarchical planning process was not used?
11. Develop a WBS with at least two levels for a project you are personally familiar with (e.g., moving away to college, registering for class, cleaning out a garage). (Hint: the plan will be more useful as a learning exercise if you have a subordinate or two, real or imaginary.) Be sure to include precedences, task durations, resource requirements, and milestones. Enter the plan in MSP.
12. Discuss the drawbacks of implementing a project plan without a RACI Matrix.
13. Pursuing a degree or certificate is a major project. Construct a brief “project plan” for this project that includes all nine elements described in the chapter.
14. Assume that your class instructor appointed you project manager to lead a dozen of your classmates in writing up the end-of-chapter pedagogy materials (i.e., Review Questions, Discussion Questions, Problems, Incidents for Discussion, and Cases) as an Instructor's Guide for this book. You plan to form subteams to work on each of these elements, each headed by a subteam leader. Of course, all the subteam materials will need to be integrated into the final Instructor's Guide at the end. Construct a WBS and RACI Matrix for this project.
15. You and your family and friends are planning to host a graduation party at the end of the school year. Construct a WBS for this party.
16. Construct a WBS for the project in Question 14.
17. Consider one or more projects (from this course or elsewhere) that you understand reasonably well. Identify situations where information learned from a later task of the project becomes important to an earlier task.
18. Contrast the Project Plan, and the Work Breakdown Structure.
PROBLEMS
19. Find the best alternative given the cost outcomes below. The probability of rain is 0.3, clouds is 0.2, and sun is 0.5.

20. In Problem 19, base your decision instead on the worst possible outcome for each alternative.
21. A marketing firm is trying to win a major contract from a large retail company and is concerned with four major threats. (1) Competition: the probability of very competitive bids is high at 0.6, and the potential impact would be substantial at a value of 5 on a scale of 1–7 (where a 7 is a major negative impact and a 1 is slight). (2) Economy: probability of a recession is 0.4 and its impact would be 7 since the company would probably decide not to advertise. (3) Chance of a loss: a small probability of only 0.3 with a negative impact of 4. (4) Personnel loss (head of marketing is being courted by a competitor): probability of loss is 0.5 but negative impact is only 3. Use the FMEA technique to determine which risks are critical and which can be ignored.
22. A marketing analyst has investigated each of the four threats in Problem 21 in terms of NOT being able to ameliorate them and has come up with the following values (again, on a 7 point scale) for each of the threats: #1: 1, #2: 6, #3: 3, #4: 4. Recalculate the RPN and determine which risks are now critical and which can be ignored. How has this changed from before? Does this new ranking seem more realistic?
23. Vern Toney managed the small IT group of a growing business. Vern's boss, the CFO, was on Vern's back to cut costs in the IT group. The CFO felt Vern could cut a staff member or two and maintain their current service level. Vern was also receiving a steady flow of complaints about the response time to calls to the help desk. He had two people answering the help desk phones and three desktop support staff responding to the problems.
Vern had to do something. He thought that he might save money by outsourcing the group's help desk function. He called a few vendors, all of whom claimed they could save him money.
Vern was not sure if this would shorten the group's response time to help desk calls. He felt that he needed to do some research before he made a decision. He decided to construct a project plan for the research.
After closing the office door, he sat down at his computer using Microsoft Project software and started to identify all of the steps he needed to take before he phoned vendors for bids on taking over the help desk. The investigation would have to be a secret or his staff would worry about their job security.
First, Vern decided that he needed to identify the department's current level of service. This required knowing the current volume of calls, the length of time until the call ticket is assigned to a desktop support person, and the time it took to close the ticket. He thought that he could accomplish all of this in one week by doing all three steps simultaneously.
After he determined the current service level, Vern thought that he should informally poll all company managers to see what improvements in IT group service they would like. He figured 2 days to make all the phone calls. He could then call the finance department to get up-to-date payroll information on his staff's salary and overtime expenses. Vern thought that if he called right away, he would surely hear back in 1 day.
Vern also decided to call other IT managers in the city to try to establish a benchmark service level. He thought that step would take a week and he could start after finding the current service levels. Last, after every other step was completed, Vern could prepare a request for proposals to send to IT outsourcing vendors. He thought that the preparation of an RFP would take a week. He decided to start this planning project right away.
Question: Prepare a WBS using MSP with the steps that must be completed before Vern Toney can contact outsourcing vendors. If Vern starts on August 1, 2016, how long will it take to get ready to contact outsourcing vendors?
24. Develop a mind map to identify the tasks that need to be completed for a nonprofit organization's annual casino night charity event.
25. In addition to your regular responsibilities, your supervisor has just assigned you to be in charge of your organization's annual golf tournament. It is expected that 100 to 150 employees will enter the tournament. In addition to organizing the event, you are also responsible for promoting it. Your budget for the event is $25,000. Develop a mind map to identify the tasks that need to be completed for the golf tournament project.
INCIDENTS FOR DISCUSSION
Plymouth Zoo's Re-engineering Project
The Chief Operating Officer of the Plymouth Zoo, Avery Mitchell, was put in charge after the CEO unexpectedly died. Avery was named acting CEO and told by the zoo's Board of Directors that he would be considered for the position permanently if the next few months went smoothly. Avery was very nervous because he knew that the zoo was on the verge of financial troubles. He was not expecting to make the profits that had been projected for the next few months. He knew that admissions were down as a result of recent unrest in the city and nationally.
The deceased CEO had hired a consulting group to help identify cost savings for the zoo. The firm hired was unfamiliar to Avery, and there were rumors around the zoo that the lead consultant was a friend of the now deceased CEO.
The consulting group had been interviewing staff at the zoo for the last two weeks in order to prepare a proposal for work re-design to cut costs. Avery met with the consultants, and they presented him with their proposal. The proposal outlined the cost of the consultants and the projected savings the zoo could expect after the consultants' work was finished. Avery was unclear about precisely how the savings were determined and what would be the redesign project's specific deliverables.
Questions: What should Avery Mitchell do next? What information should he ask the consultants for before accepting their proposal? What project planning tools would you suggest Avery ask the consultants to use to outline the project more specifically and address his concerns?
Time Is Fleeting
A large privately owned retail discount store was having problems with their time clocks. There were six freestanding time clocks in the store for staff use. They were located conveniently at points where staff entered and exited the store. The staff could also clock in and out on the computer terminals that controlled the cash registers.
The time clocks were old and often in need of repair. The Information Technology (IT) department was responsible for the maintenance of the machines. The IT department could make minor repairs but had to call the clock vendor for the not infrequent major repairs.
The head of Human Resources (HR) wanted to launch a project to purchase and install new time clocks. He felt that because the current time clocks could not be counted on to work, the accuracy of the staff's working hours and the store's payroll was in question. This bothered him, and he felt the problem was getting worse as the clocks aged.
The head of the IT department wanted to launch a project to get rid of all the time clocks and have everyone clock in and out using the current computer terminals located at each register. This would greatly decrease the costs the department was incurring to maintain the current time clocks. The head of IT knew that the computer terminals were not conveniently located for anyone except the sales clerks, but he thought that he could add some terminals in other locations for less money than maintaining the current clocks. He also felt very confident in his staff's ability to maintain the computer terminals themselves, so the expense of calling in a vendor would disappear completely.
The head of HR did not like IT's idea at all. He had problems already with people clocking in for other staff and knew this would only get worse if every staff had to go to a designated computer terminal to clock in and out. The head of HR also knew he had several staff members who were not computer literate and would have trouble clocking in and out.
The two department heads went to the President, and each asked to set up and supervise a project to take care of the time clock problem.
Question: If you were the President how would you handle this problem?
![]()
St. Dismas Assisted Living Facility—1
St. Dismas Medical Center, an urban, nonprofit, 450-bed rehabilitation hospital began to see a significant decline in admissions. St. Dismas' mission focuses on inpatient and outpatient rehabilitation of the severely injured and catastrophically ill. While the patient census varied from month to month, it appeared to the St. Dismas Board of Trustees that the inpatient population was slowly but steadily declining. The hospital's market researchers reported that fewer people were being severely injured due to the popularity of seat belts and bicycle/motorcycle helmets. In order to get a handle on the future of the organization, the Board, and the CEO, Fred Splient M.D. called for a major strategic planning effort to take place.
In January 1999, St. Dismas held a planning retreat to identify future opportunities. The outcome of the retreat was that the Medical Center needed to focus its efforts around two major strategic initiatives. The first, a short-run initiative, was to be more cost-effective in the delivery of inpatient care. The second, a long-run strategy, was to develop new programs and services that would capitalize on the existing, highly competent rehabilitation therapy staff and St. Dismas's excellent reputation in the region.
At the time of the retreat, Fred Splient's parents were living with him and his family. Fred was an active member of the “sandwich generation.” His parents were aging and developing many problems common to the geriatric populace. Their increased medical needs were beginning to wear on Fred and his family. It crossed Fred's mind that life might be more pleasant if the hospital Board approved an expansion of the Medical Center's campus to include an assisted living facility.
In March 1999, Fred had his Business Development team prepare a rough estimate of the potential return on investment of an assisted living facility. He asked the team to identify different options for facility construction and the associated costs. The team also did a complete competitive analysis and examined the options for services to be offered based on St. Dismas's potential population base and catchment area. The Business Development team visited several facilities across the country. The team also interviewed companies that could oversee the design, building, and operation of the facility for St. Dismas. The development team produced a preliminary business plan based on the recommended structure for the facility, estimated capital expenditure needs, estimated income from operation of the facility, as well as projected revenues to other Medical Center programs resulting from the facility's population.
The plan was presented at the May 1999 meeting of the Board of Trustees. Fred Splient and his team introduced the Board to the concept of opening an assisted living facility on St. Dismas's campus. The facility would be set up as a for-profit subsidiary of the Medical Center so that it could generate a profit and not be subjected to the strict guidelines of the hospital's accrediting agencies. As a subsidiary organization, however, the Board would still have control.
The chosen facility design was a freestanding apartment-like facility with a sheltered connection to the Hospital for access to the kitchen and hospital services. The facility would have 100 units with 15 to 30 of the units classified as “heavy-assisted” and built to code to house the physically and medically disabled. The rest of the units would be “light-assisted,” larger apartments. The population would be approximately 110 to 150 residents, with most being single occupants rather than couples.
The light-assisted apartments could hold residents who required only minor medical and social interventions. The residents of the heavy-assisted section would have more medical needs and would require assistance getting around. The Business Development team recommended this type of programming model, because many assisted living facilities were erected across the country, but few had a medical focus and offered the types of services that St. Dismas could offer—physical and occupational therapy programs, and behavior management programs to name a few.
The Board was assured that the facility would meet the strategic initiative of a growing business. The business plan projected an immediate increase in the number of referrals to the outpatient therapy programs. Another projected deliverable of the project was to enable St. Dismas to strengthen its focus on reimbursable preventive and wellness programs for the healthier geriatric population. The project's longer term goal was to increase the census in the hospital's inpatient units by having a location where people could age in place until they were in need of hospitalization, and then such a facility would be right next door.
Depending on the exact size of the apartments, their equipment, and the actual ratio of heavy- to light-assisted units, Fred estimated that the entire project would cost between $8,500,000 and $11,000,000 for the facility construction. That estimate included the cost of land, furnishings, and a sheltered connection to the hospital. When up and running, it was estimated that the net income would range between $9,000 and $12,000 per unit per year. The team estimated the net cash flow for the entire project to be around $1,500,000 per year.
Fred requested the Board to approve the concept and allow his team to prepare a pro forma plan to the Board for approval. The plan would include a recommended design for both heavy- and light-assisted apartments. It would also include all costs of land, construction, furnishings, and staffing. Income estimates would be included and would be conservatively biased. A timetable would also be included.
The Board conducted several executive sessions, and by the middle of May voted to approve the concept. They approved the architectural-construction-management firm recommended by the team, and they requested Splient to proceed with developing a complete project plan. The Board appointed two Board members to sit on Fred's planning group.
In June, Dr. Splient gathered his executive team together and presented the project mission, and scope. He reported that the board had approved a small budget to finance the planning process. The Board also stipulated that construction could not begin until after the November 1999 city elections because two of the Board Members were running in that election, one for a city council seat and one as a county commissioner. The Board also stated that they would like a plan that would allow the facility to open by July 2000, as research has shown that many adult children find the summer the easiest time to assist their parents in finding an alternative to independent living arrangements. The CEO and executive team were now confident that they were ready to launch the project to plan, build, and open an assisted living facility at St. Dismas.
A few days later, Fred decided that it was time to set up the team that would take responsibility for what he called the ALF project. He quickly decided to include the following staff at the launch meeting:
- Chief Financial Officer (CFO)
- Vice President of Business Development and Marketing
- Rehab Services Medical Director
- Construction Project Manager for capital facilities projects
- Chief Operations Officer (COO) (nursing, facilities, food services, and housekeeping)
- Director of Information Services
- Director of Support Services (central supply, purchasing, and security)
- Two members of the Board of Trustees, one with construction experience and the other a probable electee to the city council.
Even though the department directors from Support Services and Information Services would not be involved until later, Fred decided to include them from the beginning. Fred knew some members of his team had a tendency to become obstacles to progress if they felt left out.
Fred named the group the ALF Project Steering Committee and held the first meeting. Fred presented his vision for the facility. He told the group that he personally would be managing this project. He led a discussion of all the major steps that must be included in the project plan, and asked each team member to identify the areas for which they would accept responsibility. The hospital's Construction Project Manager took responsibility for the construction of the facility, and the COO volunteered to oversee the building design, as well as define the needs for food services, housekeeping, staffing, and policy and procedure development. The CFO agreed to develop the budgets for each area of the project as well as the operating budget for the facility. The CFO also agreed to create the payroll and accounting systems necessary to operate the facility.
The IS director accepted responsibility to define and set up all the telecommunications and information system needs of the facility. The VP of Business Development agreed to create a preliminary marketing plan, and a communication package for the community and hospital staff. In addition, she discussed organizing a major ground breaking event. The Medical Director said that he would design an assessment tool for determining residents' level of medical needs upon moving in to the facility. He felt this was the first step in defining what clinical services should be offered to residents. Fred told the team that he would develop the management structure for the new facility and work with in-house counsel to identify all governmental regulations as well as all industry standards that pertain to an assisted living facility and govern the facility's practices. Splient gave the team 2 months to come back with their detailed action plans for their areas of responsibility.
QUESTIONS
- Define project deliverables.
- Define project constraints and assumptions.
- Develop a preliminary Level 1 WBS.
- Is Dr. Splient a good choice for project manager? Support your position.
![]()
John Wiley & Sons
John Wiley & Sons, Inc. publishes books, journals, and electronic products for the educational, professional, scientific, technical, and consumer markets. The oldest independent publisher in North America, Wiley is in the forefront of electronic publishing, with more than 200 products and services on disk, on CD-ROM, or available by network. Wiley has more than 11,000 active book titles and 400 journals. The company publishes 1500 new titles in a variety of formats each year. The company has approximately 2000 employees worldwide.
Wiley has U.S. publishing, marketing, and distribution centers in New York, Colorado, Maryland, New Jersey, and Illinois. A substantial portion of Wiley's business comes from international markets. In addition to offices in the United States, it has operations in Europe (England and Germany), Canada, Asia, and Australia to serve the needs of the local markets and explore opportunities for expanding its publishing programs.
In the early years, Wiley was best known for the works of Washington Irving, Edgar Allan Poe, Herman Melville, Nathaniel Hawthorne, and other nineteenth-century American literary giants. But by the turn of the century, the company was established as a leading publisher of works on science and technology.
Today its areas of specialization include the sciences, engineering, technology, mathematics, accounting, and business management, with a growing presence in general interest titles. Wiley is committed to providing information in those formats most accessible to its readers and is taking advantage of the rapid advances in digital information technology to enhance the speed and flexibility with which it delivers print publications as well as to develop a range of offerings in electronic formats.
The consulting firm you work for has been contacted by Wiley to support its textbook Project Management in Practice. Specifically, John Wiley and Sons is interested in contracting your consulting firm to develop the state-of-the-art website described above. Furthermore, Wiley would also like your firm to benchmark website state-of-the-art in terms of content, capabilities, and functionality prior to designing and developing this website.
QUESTIONS
- Develop a mind map for this project.
- Convert your mind map into a WBS.
- Discuss how your mind map might be used to facilitate other project planning activities such as resource allocation, schedule development, and risk analysis.
![]()
Samson University
Samson University is a small liberal arts university located in the northeast of the country. Recently, QBS Inc., a large multinational corporation headquartered in the same city, made a large gift to the university to develop a 1-year Master of Science program in Project Management. To develop the new Project Management program, Samson's business school dean, Dr. Ryan, asked Professor Scott to chair a taskforce to develop the new degree program. Together, Dean Ryan and Professor Scott decided that Professors Samuelson, Kacy, Regan, and Lee should also serve on the taskforce
At the taskforce launch meeting, Dean Ryan acknowledged how much she appreciated everyone's willingness to serve on the taskforce given all their other responsibilities. She went on to explain how developing this program would significantly enhance the university's relationships with QBS, lead to important job opportunities for its graduates, and ultimately enhance the university's reputation. She then turned the meeting over to Professor Scott.
Professor Scott began:
I would also like to echo Dean Ryan's appreciation for your willingness to serve on this taskforce. Personally, I am very excited about this opportunity and I truly believe we can develop a program that is unique and will attract great students and major employers. Today, my goal is to have us brainstorm about what work we need to undertake to complete our charge. I will record the ideas you come up with on the flip chart and then use this to develop a draft project schedule for your review. So without further delay, what ideas come to mind regarding the work we need to do to complete our charge?
Professor Lee was the first to respond:
In my view, the first thing we need to do is benchmark other Project Management programs and find out what courses these programs offer. Also, I think we need to decide what our goal is. In particular, are we trying to develop a program that achieves parity with other programs or are we trying to reinvent the way project management is taught?
Professor Kacy next chimed in:
I agree with Dr. Lee that benchmarking is an important step. Based on what we learn from benchmarking other programs, we will then need to develop the curriculum for our program.
From an administrative perspective, as you develop the curriculum you will need to consider faculty related issues. For example, does our current faculty have the background to teach the new courses? And if so, is there sufficient slack that we can accommodate the new courses in the faculty's current teaching loads?
Professor Samuelson suggested:
In addition to benchmarking other programs, I think it is important to solicit input from key stakeholder groups including potential students, our faculty, and companies that would recruit graduates of the program.
Dr. Lee agreed:
I completely agree with Dr. Samuelson. My suggestion is we create an online survey to solicit recruiter opinions.
Dean Ryan added:
Speaking of recruiters, we also need to evaluate whether we have sufficient resources in our Career Management Center to handle the coaching and placement needs of this new group of students.
Professor Scott next suggested:
There are a lot of issues that come to mind regarding the curriculum. For example, should we develop a skills matrix? How much hands-on experience should be emphasized? Should the program be organized around modules or should we have standard semester length courses?
Building on Professor Scott's comments, Professor Kacy remarked:
Yes, getting the curriculum right is critical. Also, we need to determine the split between hard analytical skills and softer skills. And if we were to go with modules, would there be themes for each module?
Professor Regan then commented:
Another issue we need to address is what would be the admissions criteria for the program? For example, would students need to have some number of years of work experience?
As the discussion died down, Professor Scott wrapped up the meeting:
This has been a productive meeting. I think we have done an excellent job identifying the work ahead of us. I greatly appreciate the passion each of you has demonstrated and the contributions all of you have made. I will take the list we generated, organize it a bit, and then develop a tentative schedule for your review. I will also have my staff assistant send out a poll to identify a weekly meeting time.
QUESTIONS
- Critique the launch meeting. Are there aspects you think are worth emulating? Are there aspects you would do differently?
- Develop a mind map for this project using the ideas shared in the meeting and other ideas that occur to you.
- Convert your mind map into a WBS.
- Review your mind map and identify risky potential failure points. Which are the most serious? Which are the most likely? Determine the most critical failure points by calculating all their RPNs. Develop a contingency plan for each of the most critical failure points you identify.
BIBLIOGRAPHY
AARON, J. M., C. P. BRATTA, and D. P. SMITH. “Achieving Total Project Control Using the Quality Gate Method.” Proceedings of the Annual Symposium of the Project Management Institute, San Diego, October 4, 1993.
BAILETTI, A. J., J. R. CALLAHAN, and P. DIPIETRO. “A Coordination Structure Approach to the Management of Projects.” IEEE Transactions on Engineering Management, November 1994.
BAILEY, D. E. “Comparison of Manufacturing Performance of Three Team Structures in Semiconductor Plants.” IEEE Transactions on Engineering Management, February 1998.
BOWEN, H. K. Project Management Manual. Cambridge, MA: Harvard Business School, 9-697-034, October 6, 1997.
BROWN, K. A., and N. L. HYER. “Whole-Brain Thinking for Project Management.” Business Horizons, May–June 2003.
FORD, R. C., and F. S. MCLAUGHLIN. “Successful Project Teams: A Study of MIS Managers.” IEEE Transactions on Engineering Management, November 1992.
HAMBLETON, L. Treasure Chest of Six Sigma Growth Methods, Tools, and Best Practice. Prentice Hall, Upper Saddle River, NJ, 2008.
HAUPTMAN, O., and K. K. HIRJI. “The Influence of Process Concurrency on Project Outcomes in Product Development: An Empirical Study of Cross-Functional Teams.” IEEE Transactions on Engineering Management, May 1996.
KNUTSON, J. “How to Manage a Project Launch Meeting.” PM Network, July 1995.
LANGLEY, A. “Between ‘Paralysis by Analysis’ and ‘Extinction by Instinct.’” IEEE Engineering Management Review, Fall 1995, reprinted from Sloan Management Review, Spring 1995. (This is a thoughtful article that speaks to both sides of the “How much planning should we do?” issue.)
LENCIONI, P., The Five Dysfunctions of a Team: A Leadership Fable. San Francisco, Jossey-Bass, A Wiley Company, 2002. (Much like Goldratt's The Goal, this work is fictional and tells the story of a new senior manager who takes over a team of subordinates. It is a quick and easy read and well worth the brief time.)
MARTIN, P. K., and K. TATE. “Kick Off the Smart Way.” PM Network, October 1998.
PELLS, D. L. “Project Management Plans: An Approach to Comprehensive Planning for Complex Projects,” in P. C. Dinsmore, ed., The AMA Handbook of Project Management, New York: Amacom, 1993.
PMI, “Mutual Disagreement,” PM Network, February 2005.
PMI, “A Derailed Vision,” PM Network, April 2004.
PRENTIS, E. L. “Master Project Planning: Scope, Time and Cost.” Project Management Journal, March 1989.
WEBSTER, J. L., W. E. REIF, and J. S. BRACKER. “The Manager's Guide to Strategic Planning Tools and Techniques,” Planning Review, November/December 1989. Reprinted in IEEE Engineering Management Review, December 1990. (A fascinating compilation of planning techniques including such methods as the Delphi method, stakeholder analysis, benchmarking, critical success factors, focus group, and many others—30 in all. It also has a short history of strategic planning.