

Monitoring and Controlling the Project
![]()
Project monitoring and control are, in some ways, simply the opposite sides of project selection and planning. The bases for selection as described in Chapter 1 dictate what to monitor and the details of planning identify the elements to be controlled. PMBOK covers these topics in Chapter 3 on Processes, but more explicitly covers the topic of controlling in Chapter 8 on Quality. Monitoring is the collection, recording, and reporting of project information that is of importance to the project manager and other relevant stakeholders. Control uses the monitored data and information to bring actual performance into agreement with the plan. Clearly, the need to exert proper control mandates the need to monitor the proper activities and elements of the project. Frequently, the distinction between monitoring and control is blurred, and their interaction often makes us think we are working on a single task, but they are quite distinct.
Although the data gathered from monitoring often serve many objectives—auditing, keeping management informed, learning from mistakes—these are all secondary compared to the purpose of control. The purpose of monitoring is to ensure that all interested parties have available, when needed, the information required to exercise control over the project through the use of tools such as the project portfolio process of Section 1.6. Thus, the key issue in designing an effective monitoring and control system is to create an information system that gives the project manager and others the information they need to make informed, timely decisions that will keep project scope as close as possible to the plan.
7.1 THE PLAN-MONITOR-CONTROL CYCLE
Managing a project involves continually planning what to do, checking on progress, comparing progress to plan, taking corrective action to bring progress into agreement with the plan if it is not, and replanning when needed. As noted previously, the fundamental items to be planned, monitored, and controlled are time, cost, and scope so that the project stays on schedule, does not exceed its budget, and meets its specifications.
This plan-monitor-control cycle constitutes a “closed-loop” process that continues until the project is completed. Figure 7-1,* illustrates the information and authority flows for such a cycle in an engineering project. Note that the information flows up the organization and the authority flows down.
Unfortunately, it is often the case that when particularly complex, challenging, or uncertain projects are initiated, the planning-monitoring-controlling effort is minimized so that “the real work” can be done. It is a great temptation to focus on doing something, anything, rather than to spend time on planning, monitoring, and controlling, especially if the stakes are high and the project is a difficult one. It is precisely such projects, however, that most desperately need a mature project manager, particularly one who realizes the importance of creating an effective planning-monitoring-controlling process. Only this will ensure that the project and its output are in full compliance with the law, as well as with the expectations of both senior management and the client.
We are familiar with many firms that incurred tremendous expense and large losses because the planning process was inadequate for the project tasks undertaken. For example, a retailer won a bid to supply a regional office of a national firm with a computer, terminals, and software. Due to insufficient planning, the installation was completed far beyond the due date with very inadequate performance. The project failure disqualified the retailer from bidding on an additional 20 installations planned by the national firm. Another firm in the construction industry ran 63 percent over budget and 48 percent over schedule on a major project because the PM had managed similar projects several times before and “knew what to do without going into all that detail that no one looks at anyway.”

Figure 7-1 Project authorization and expenditure control system information flow.
Source: Dean, 1968.
Designing the Monitoring System
The key to setting up a monitoring system is to identify the special characteristics of scope, cost, and time that need to be controlled in order to achieve the project goals as stated in the project plan. The exact boundaries within which these characteristics should be controlled must be determined, as well as the specified performance characteristics for each level of detail in the project activities. In order to manage for overall project success, control must be exercised at the detailed work level for each aspect of project performance or there is no guarantee that the desired changes will result.
The project plan identifies what is being done, when, and the planned level of resource usage for each task and subtask in the project, so real-time data must be identified to measure achievement against the plan. Mechanisms to gather and store such data must be designed. In addition to collection systems for hard data, the monitoring system should include telephone logs, change tracking/control systems, documentation processes for both formal (e.g., meetings) and informal communications, and other such softer data collection systems. Once again, monitoring is the direct connection between project planning and control.
One way of linking planning and control is to monitor project progress at each milestone or phase of the project. Alternatively, progress can be monitored continuously based on the MSP Gantt chart, as shown in Figure 5-24 of Chapter 5. The original Gantt chart provides the baseline, and every time there is a change the “tracking Gantt” chart is updated to reflect the change. The software automatically adjusts all information to reflect the change. Another way illustrated later in this chapter is to use an “earned value” chart with its preestablished baseline. A fourth method is to monitor the critical chain buffers described in Chapter 6. Critical chain software packages such as ProChain® include buffer reports in their output which can direct the managers to problem areas where attention needs to be focused. The PM should remember to number and save each version of all monitoring documents to ensure a timely and accurate record for the project history that is discussed in Chapter 8.
It is temptingly easy to focus monitoring activities on data that are easily gathered rather than those that are important for control purposes. For example, too often it is the hard, “objective” measures that are monitored when soft, “subjective” data revealed in phone calls and water-cooler or happy-hour conversations are what are needed for proper control.
Too often, intensity of activity is measured instead of results. Because the measurement of project performance may be difficult, there is a strong tendency to let project inputs serve as surrogate measures of output, such as assuming that if 50 percent of the budget has been spent, and/or 50 percent of the scheduled time has passed, then 50 percent of the tasks must be completed. Far, far too often we measure cost (because it is easy to measure and both executives and accountants are used to dealing with cost), and completely ignore any consideration of the actual state of the task or project in terms of developing deliverables.
It is essential to spend time up front designing the planning-monitoring-controlling process, especially for more challenging projects. The project plan is the primary document to guide the design of the monitoring system in terms of the detailed tasks and resources that need to be controlled in order for the project to achieve its time, cost, and output goals. Common errors in setting up monitoring systems are monitoring easy measures instead of relevant measures, monitoring activity in place of results, monitoring inputs as surrogates for outputs, and monitoring measures that don't change from one period to the next.
7.2 DATA COLLECTION AND REPORTING
Once we have decided on the type of data we want to monitor, the next question is how to collect these data and turn them into information useful for controlling the project. This is the activity of data collection and reporting. In this section we cover the physical collection of data and the analysis of that data, if necessary, to transform them into information. Once transformed, however, there are many ways to present the information and these are covered under the topic of reporting, including a discussion of the three main types of reports. A very special means of both collecting and disseminating data, and even sometimes information, is the proverbial “meeting,” and we offer some advice for this often painful phenomenon—both in-person and virtual meetings are included. The use of electronic means for distributing information or reports is briefly examined.
At some point we have to decide what data we need to collect, when we need to collect them, and precisely how we should go about collecting them. A number of questions are raised. Should we design and use special forms? Should data be collected just before or after an important milestone or phase of the project? Should time and cost data always be collected at the same time each month? There are many such issues that arise when considering the data collection process and most of them can only be answered in the context of a specific project. There are a few generalizations that can be made concerning the information needed to control projects; these are described in the next section.
Data Collecting
The majority of data to be collected will eventually exist in one of the following five formats.
- Frequency counts A simple tally of the occurrence of an event is common—for example, days without an accident. Often a count of events per time period or as a fraction of some standard number is used, such as complaints per month, defects per thousand products, and fraction of luggage lost.
- Raw numbers Actual amounts are used, usually in comparison to some expected or planned amount, such as dollars spent, hours required, and pounds consumed. The comparison to plan may take the form of variances, that is, differences between planned and actual, or ratios of one to the other. The ratio format is particularly appealing for reporting on a control chart with predetermined limits, as is described later in the chapter. When collecting raw amounts it is important that the basis, time period, and collection process always be the same.
- Subjective numeric ratings These are usually subjective estimates of some quality offered by specialists in the topic, such as ordinal “rankings” of performance. They can be reported in the same ways as raw numbers, but they often cannot be mathematically processed in the same ways raw numbers can.
- Indicators and surrogates When it is especially difficult to find a direct measure of a variable, indicators or surrogates are frequently used instead. If this approach is taken, it is important that the indicator or surrogate be as directly related to the variable as possible. For example, body temperature is an indicator of infection and years of experience can be a surrogate for expertise. The number of salespersons, however, would be a poor, and clearly indirect, measure for level of customer service.
- Verbal characterizations Other variables that are difficult to measure, such as team spirit or client–supplier cooperation, may take the form of verbal characterizations. These forms of data are acceptable and useful as long as the terminology is limited and is uniformly understood by all parties.
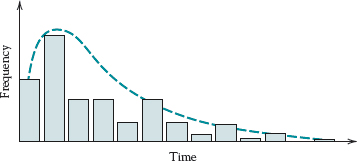
Figure 7-2 Number of bugs per unit of test time during test of Datamix software program.
Data Analysis
Following the collection of the data through the monitoring system, it is frequently necessary to analyze or process the data in some manner before reporting it for control purposes. This may take the form of simple aggregation of the data, such as averaging the values, or something as complex as fitting statistical distribution functions to the data to ascertain relationships, effects, and trends. Crystal Ball® can do this with ease. Some of the quality management techniques for the presentation and analysis of data are often useful here (e.g., see Meredith and Shafer, 2013). As an example, a common graph used in quality management shows the range of sample values taken on a periodic basis, such as daily. If the samples' range—the largest minus the smallest value—appears to be increasing over time, this may indicate that a machine is wearing out or needs maintenance.
Figures 7-2 and 7-3 illustrate curve fitting where charts are updated on a regular basis and curves are fit to the data in order to help the PM estimate the cost and time required to achieve the performance goals for the project. Figure 7-4 shows the trend in the ratio of actual material cost to planned cost so the PM can step in should the values indicate a likely problem.
In general, significant differences from plan should be highlighted or “flagged” in some way so the PM or other person exercising control cannot overlook the potential problem. The many techniques of statistical quality control (see Meredith and Shafer, 2013, Ch.3) are helpful for determining what size variances are “significant,” and may even help in determining causes and effects. These formal approaches, however, are often “after the fact” techniques for correcting (controlling) problems—variances occur, are reported, investigated, and then some action is taken. The astute PM, however, is much more interested in preventing fires rather than putting them out, thus the value of timely data collection and reporting.
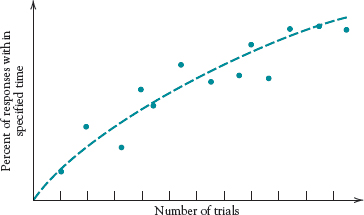
Figure 7-3 Percent of specified performance met during successive repeated trials.

Figure 7-4 Ratio of actual material cost to estimated material cost for aircraft parts company.
Last, it should be noted that data analysis is sometimes used for the assignment of blame. The PM will not find this a helpful endeavor in managing the project. The goal is to achieve the project objectives through correcting deviations from plan, not to find scape-goats or assign guilt. The PM needs all team members performing at the top of their capabilities. Frequent blame placing strongly encourages team members to avoid taking the risks necessary to achieve a project's goals, or from mentioning problems when discovered.
![]()
Reporting and Report Types
![]()
After the data have been collected and analyzed, they need to be reported in some form. For example, PMBOK suggests in Chapter 10 that routine performance reports include status reports, progress reports, and forecasts. There are also many other possible report formats, such as time/cost reports, variance reports, update presentations, and similar documents. All tables, charts (such as PERT/CPM and Gantt), and especially project plans should be updated to reflect current reality. In addition to alerting team members to potential problems, such updates help maintain team morale. Where known, some form of “comparables” should also be reported such as distributions of previous data, perhaps from earlier but similar projects, so that the PM and others can better interpret the data. As we have noted before, any time project reports, plans, or other documents are updated, great care should be taken to preserve all documents from earlier stages of the project's life. These materials will be invaluable when the project is completed and a project final report (project history) is written.
Although everyone concerned with the project should be tied into the reporting system in some fashion, not everyone needs to receive the same information. In addition to, say, aggregating the data for senior managers with many other such projects under their authority, reports may vary in terms of the frequency of distribution and detail as well as the particular measures being reported. The client may wish to have reports on cost and schedule while functional management may wish to see reports on technical accomplishments, for example. Project team members may need information at the task or subtask level on a frequent, perhaps daily, basis.
In general, it is a good idea to avoid periodic reports except in those cases in which the flow of data is periodic, for example, accounting data. Let the project's milestones, scope changes, problems, and the project team's needs for information dictate the timing of reports. It is our feeling that reports issued routinely every day, week, month, or quarter do not get read. An exception to this rule against periodic reporting is made for reports mandated by senior management who must examine the status of many projects and may need to compare the performance of many projects against the same time frame.
The explosion of electronic media for both collecting and disseminating data and information, including project management software such as MSP, makes it possible to customize a wide range of information for different audiences. This means that more data are available for collection, and more frequent updating is possible. Clearly, this can lead to an overload of reporting that is just as dangerous as underreporting. Important events, problems, and trends tend to be hidden in a mountain of detail. Thus, it is crucial that the reporting system be well designed to make use of such modern technological marvels without abusing the recipient of their capabilities. More is said about this later in this section.
The reports delivered to those engaged in carrying out or managing the project should be timed to allow control to be exercised before completion of the task in question. The project plan, again, identifies the level of tasks and responsibilities according to the level of management, and this provides guidance for both the level of detail and the timing of reports. For example, drug efficacy tests require a long time to conduct, so frequent reports would not be appropriate. In contrast, performance verification tests on new silicone chips can result in hundreds of discrepancies within a matter of hours, so daily or even more frequent reports are necessary.
In addition to WBS-determined data and information, individual managers may wish to see specific types of information in their reports, and these should be included as well. Moreover, they may even have preferences on the timing of reports, which should also be followed when they are within reason. The PM, however, must make sure that the relevant (for their level) information about project progress is included in their reports, and in such a way that it cannot be overlooked. Similarly, it is of no value reporting information or data to those who cannot use it for purposes of control, such as reporting overhead costs to the project chemist.
For projects, there are primarily three distinct types of reports: routine (which we have been describing), exception, and special analysis.
- Exception reports are primarily intended for special decisions or unexpected situations in which affected team members and outside managers need to be made aware of a change, and the change itself needs to be documented.
- Special analysis reports are prepared to disseminate the results of a special study in a project concerning a particular opportunity or problem for the project. They may be distributed to top management, other project managers who would benefit from the knowledge, functional managers, or anyone who might be affected or interested. Typical subjects might include studies of new materials, capabilities of new software, and descriptions of the impact of new government regulations.
In addition to the benefits of reports for the purposes of control, they offer these benefits.
- They provide the mutual understanding between stakeholders in a project regarding the goals, progress, difficulties, successes, and other ongoing events of importance to the project.
- They help communicate the need for coordination among those working on the tasks and subtasks of the project.
- They establish and maintain a communication network for global projects.
- There are often changes to the goals and functioning of projects. Reports can communicate this information in a timely and appropriate fashion, thus minimizing the confusion often encountered during such changes.
- They help maintain the visibility of the project, and the project team, to top management, functional managers, colleagues, and clients.
- Finally, unless the project is a disaster, status reports help keep the project team motivated.
It is not by chance that the PMI has labeled these collections of project reports, plans, charters, change orders, project histories, and other such documents as organizational “assets.”
A special problem often encountered in designing project monitoring and reporting systems is the relationship between the project's information system and the overall organization's information system. The PM is, understandably, not free to define costs and other measures in ways that differ from the organization's definition of such measures as documented in the overall information system. Thus, the PM is advised to use the regular information system as the definitional prototype for project monitoring and reporting, making adjustments and additions as necessary for the special circumstances and measures needed for the project at hand. The PM should be aware, however, of another danger—modules of the parent organization's information system may not fit the needs of project monitoring and reporting. For example, an accounting module to track costs for an assembly line will not be adequate for tracking project costs.
Software packages such as MSP offer extensive and varied reporting mechanisms. Gantt charts show the current status of a project (see Chapter 5, Figure 5-24), and reports show the availability of various resources (see Chapter 6, Table 6-2) or the demands for work from individuals or groups (see Table 6-3 or Figure 6-5), just to name a few. MSP not only allows the PM to distribute the information anywhere that has electronic communication capability, but also allows easy customization of the reports limited only by the PM's imagination. A PM can highlight tasks that are running late (or running early if such exist), and add large red Xs to mark cost overages. The level of detail reported on Gantt charts is also completely controllable, so the PM can send only first-level tasks to senior management, and the highest level of detail to project team members.
Meetings
For many project workers and managers, meetings are about as welcome as Herpes diseases or a call from the IRS. So far in our discussion, we have talked about reports as if they were going to be delivered by hand, snail mail, or email. Often, however, they (or their substance) are delivered through face-to-face meetings. These meetings can range from regular, highly formalized and structured presentation/question/answer sessions to informal, off-the-cuff get-togethers. Project review meetings, regardless of the format, are always important.
Although such meetings are usually dreaded because of their length, lack of actionable conclusions, and general waste of time, this need not be the case. The following guidelines should help avoid the problems with such meetings.
- Some meetings, such as the Weekly Progress Report (also known as “show and tell”), should rarely be held at all. Although not always possible, try to hold meetings only for making group decisions or generating input among meeting members for dealing with important problems or opportunities. That is, hold meetings to take advantage of face-to-face interaction when no other approach or technology is an adequate substitute.
- Distribute a written agenda in advance of the meetings. The lead time for distributing the agenda should be sufficient to allow attendees to prepare to deal with agenda items. In addition to a list of the issues that will come before the group, the agenda should announce the meeting's pre-set starting and stopping times. Stick with both. Don't wander off the agenda, don't let the meeting run into overtime, and especially do not penalize those who show up on time by making them wait for those who are late. Obviously, in the case of meetings called to deal with emergencies, feel free to disregard the advice in this section.
- If a crisis arises and a meeting is deemed necessary to deal with it, make sure the meeting is restricted to that issue. If a stopping time cannot be predetermined, an acceptable alternative is “when the crisis is resolved.”
- If homework needs to be done before the meeting by the attendees, check to be sure they will be prepared, and above all make sure you are prepared.
- If you chair the meeting, you should take your own minutes. The minutes should contain a final set of action items including what is to be done, by whom, and by when. The minutes are a critically important piece of documentation for a project, documenting important decisions and responsibilities. Do not delegate this responsibility. Microsoft Word® has a template for creating an agenda and for taking minutes that focus on action items.
- Avoid attributing remarks to individuals in the minutes. Remarks are meant to foster group process, not to be documented for eternity and for all to see. (Obviously this doesn't apply to designated or volunteered responsibilities.) As well, do not record and report votes taken in the meeting. It seems inappropriate to report that the motion to send a get-well card to the boss was passed—four yea and three nay. When the group has made a decision, by whatever means, that decision becomes the unanimous position of the group. Disagreement and debate are appropriate during the meeting, not after the decision is made.
- Although courtesy is always in order, excessive formality at project meetings is not. Robert's Rules of Order can safely be left at the door.
Virtual Meetings, Reports, and Project Management
Virtual meetings are now commonplace. Microsoft Livemeeting® is one of several packages that allows any number of people to meet, hear, view, and discuss presentations or training sessions on conference call telephone lines and computers. Multiway voice and data communication allows questions and answers, either live (interrupting the meeting) or submitted via the computer. Multiperson conversations are quite possible.
In this chapter on monitoring, reporting, and control, it is important to note that PMs can and do effectively utilize what has come to be called the “information revolution.” Using the Internet to communicate and report about the project's status is now easily accomplished whether project team members are in the next cubicle or across the world. One large high technology company uses secure Web pages on the Internet to collect, store, and disseminate information on various projects. They have several Web pages that are specifically designed to communicate project information to and from clients. Others are designed for the sole use of members of the project team. Still others are created to communicate with the firm's senior management.
A senior project manager in the software firm mentioned above offered the following comments on project communication:
In today's entrepreneurial corporate environment, it is necessary to communicate project information at varying levels of detail. Users run the gamut from software engineers to Business Unit (BU) general managers. Many of these users may not know or need to know how to use the project manager's planning tools. In addition, management may not want users from other BUs to have the same level of access as users doing and managing most of the work. It is important to have tools capable of limiting the detail if the user is not interested in it or is not permitted to see it, and providing detail where and when the user needs it. There are third-party software tools that claim to do at least some of this.
Web pages can hold any information that the project manager wants to share, such as progress-to-date on a project, resources assigned to a task, status of a particular task, and expenses to date. The amount of information that can be shared is limited only by the planning and monitoring processes that are put into place and the project manager's imagination.
Software programs such as Microsoft Project Server let you utilize the organization's local area network or intranet, as well as the Internet, to help with project communication and monitoring. A project manager can electronically check the status of a task or any resource used on the project and have updated information automatically entered into a project plan. Electronic work groups can be set up to monitor task completion, resource usage, and to provide reports to a group of individuals who have an interest in the project's status. For example, milestone reports can be sent to a senior management work group, and up-to-date personnel usage reports can be sent to the Human Resources department.
Using Microsoft Project, the converse is also true. With MSP and an appropriate computer network, anyone with authorized access can update his or her section of a project plan and submit it back to the PM for inclusion. Project teams and management at any site across the world will greatly benefit from these features. Using this network capability, users do not need access to a “resident” copy of the software. Valuable real-time reports can be prepared without lengthy phone conversations, or costly onsite meetings. The technological progress of the current “turn of the century” only means more effective and timely use of project information for planning, monitoring, and communicating. Utilizing video conferencing, virtual presentations, Web posting, email, etc. greatly enhance the PM's ability to manage a project.
Thus virtual project teams are created, perhaps spread across continents, with members contributing their own pieces of the project and being monitored and controlled by the PM at another location (Adams and Adams, 1997). In addition to its use for helping with the planning, monitoring, and control of projects, the Internet can also be a rich source of information. The project team can find building codes, technical aid, databases, patent information, expert contacts, and almost anything else on the Internet.
For the monitoring system, data in various forms have to be collected, analyzed, and reported. Data also need to be aggregated, manipulated in various ways, and compared with planned values in order to allow effective control. The monitoring system helps PMs prevent problems instead of having to solve them. Project reports vary in content and frequency, depending on who the reports are targeted to and what controls they will exert. A special consideration is the relationship between the organization's information system and the project's system. In addition to printed reports, reports may also have to be given orally at meetings, but steps can be taken to maximize the effectiveness of such meetings. The Internet and the organization's local area network or intranet have enhanced project communication and meetings as well as facilitated the management of geographically dispersed virtual projects.
7.3 EARNED VALUE
So far, we have discussed monitoring segments of a project—tasks, subtasks, and such. Of primary importance, however, is deriving some measure of overall project progress in terms of performance, budget, and schedule. Such a measure is “earned value.”
The common problem with comparing actual expenditures against plan (a.k.a. baseline or budget) for any given time period is that the comparison fails to consider the actual progress made on the project. Thus, if expenditures are lower than expected for a given period, it may be either good or bad, depending on whether progress is in line with that amount of expenditure. Similarly, if expenditures are higher than expected, this may be acceptable if progress is sufficiently greater than planned for that period. The performance of a task or project cannot be evaluated by considering cost factors alone.
The earned value (EV) of a task (or a project) is the budgeted cost of the work actually performed. It is calculated by multiplying the budgeted cost of the task by the percentage of completion of the task and summing over all tasks for the project. This process is more difficult than it might sound. The budgeted cost of a task is clear, but the percentage of completion is not. In particular, the percent of a task's budget actually spent is not, in general, a particularly good indicator of the percent of that activity's completion. For example, the major cost for a task might be for obtaining the machinery to do the task, a cost that will be incurred before any progress is made on that task. Or perhaps the major cost will not be charged until completion of the task. To the best of our knowledge, there is no satisfactory way to measure accurately the percent of completion of most tasks, let alone to measure accurately the percent of completion of an entire project.
As a result, three conventions have been adopted for estimating progress on tasks, but they must not be confused with reality. The most popular is 50–50: the task is listed as 50 percent complete when work on it is initiated, and the other 50 percent is added when the task is completed. This approach avoids the difficult problem of trying to estimate progress while the task is being executed. Clearly, this overstates the EV of tasks that have recently begun, but understates the EV of tasks nearing completion. In a large project, of course, with multiple on-going tasks starting and stopping at different times, the overstating and understating may tend to even out resulting in a relatively accurate portrayal of project progress. Another convention is 100 percent when the task is complete and zero percent before that. This is a very conservative approach that will only show project progress that is definitely achieved. Projects, however, will always appear to be “behind schedule,” and upper management will be in a constant state of worry about the project's progress (not to mention the project manager's competence). The last approach is the common, intuitive one of trying to estimate percentage completion by using the ratio of cost expended to the total cost budgeted for a task, the ratio of the actual time elapsed relative to the total scheduled task time, or some combination of both. There is no strong evidence that either the time or cost ratio is an accurate estimator of percent completion.
These conventions are meant for application only to individual tasks on a project, not to the project as a whole. (At the end of this section, we show how aggregating the task EVs can be used to estimate the progress of the project as a whole.) In fact, applying these conventions to the project as a whole may result in a seriously misleading number because none of the conventions noted has much semblance of reality. If one must estimate the percent complete for an activity—and as we shall see, one must—the best guess of a knowledgeable person is probably the most that can be expected for most tasks.
![]()
As the earned value of a project is calculated, a graph such as that shown in Figure 7-5 can be constructed. Given the limitations of the input data, such a figure provides a basis for evaluating cost, schedule, and performance to date. The earned value completed to date tells the manager whether progress is up to expectation, the “baseline” planned for this point in time. Any difference is called the “schedule variance,” which shows how much the project is ahead of or behind schedule. As seen in the figure, the value completed to date is less than the baseline estimate for this point in the project's life and represents about a 10-day delay, resulting in a negative schedule variance (delay is negative). The actual cost, however, is considerably above the amount of value completed, resulting again in a negative (bad) “spending variance,” and even exceeds the baseline cost for this point. Thus, this figure represents a difficult situation—a project significantly behind schedule and considerably over budget at this time in the project's life.

Figure 7-5 Earned value chart.
The variances on the earned value chart are calculated based on two simple rules:* (1) A negative variance is “bad,” and a positive variance is “good”; and (2) the spending and schedule variances are calculated as the earned value minus some other measure. Specifically, the cost or spending variance is the earned value (EV) less the actual cost (AC) of the work performed. The schedule variance is the EV less the planned cost (PV) of the work budgeted and scheduled to have been performed to date as determined from the baseline plan. All measures are made as of the same date. For a variety of examples of different possible scenarios, see Figures 7-6(a), (b), and (c).
![]()
Although the above method of calculating variances is relatively standard, another way of handling the data is more useful for making comparisons at different points in time, or across different projects, or among different project managers. This procedure is simply to take the ratios of the measures rather than their differences. Thus, the spending or cost variance becomes the Cost Performance Index (CPI) = EV/AC, and the schedule variance becomes the Schedule Performance Index (SPI) = EV/PV. Values less than 1.0 are undesirable.
We illustrate the above with a simple example. Suppose that work on a project task was expected to cost $1,500 to complete the task and the workers were originally scheduled to have finished today. As of today, however, the workers have actually expended $1,350, and our best estimate is that they are about 2/3 finished. Our calculations follow:
![]()
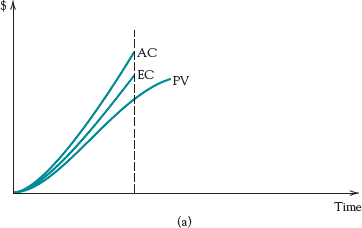
Figure 7-6(a) Positive schedule variance, negative spending variance.
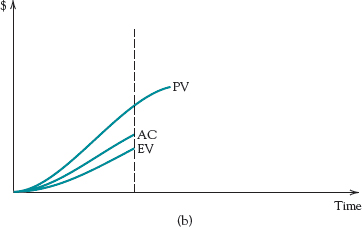
Figure 7-6(b) Negative schedule variance, negative spending variance.
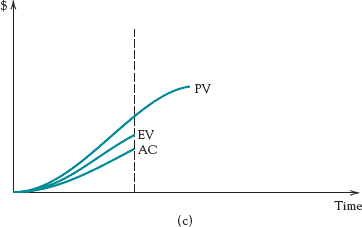
Figure 7-6(c) Negative schedule variance, positive spending variance.

Thus, we are spending more than the baseline plan indicates and, given what we have spent, we have not made as much progress as we should have.
We can use these calculations to determine some additional items of interest as well, such as the estimated (remaining cost) to completion (ETC) and the projected (total cost) estimated at completion (EAC) if nothing is done to correct the problem. Given that the budget at completion (BAC) is 1,500 and the EV is 1,500(2/3) = 1,000,
ETC = (BAC – EV)/CPI = (1,500 – 1,000)/.74 = 676
Note that this assumes that the work will be completed at the same level of efficiency or inefficiency as conducted thus far. The total cost to complete the task is
EAC = ETC + AC = 676 + 1350 = 2,026
That is, the projected additional cost to complete this task is $676 which, when added to the cost accrued to date of $1,350 gives a total task cost to completion of $2,026 rather than the original estimate of $1,500. (See Barr, 1996, and Flemming and Koppleman, 1996.)
Tables 7-1 and 7-2 illustrate the application of some of these variance calculations for a project to produce a documentary film. Tables 7-1 and 7-2 were generated by MSP. Table 7-1 depicts a status report for the documentary film project outlined in Chapter 6.
Table 7-1 is an overview of the actual information on the project steps compared to the baselines for duration, start dates, finish dates, cost, and hours worked. The project began 3/29 and is scheduled to be completed by 5/26. The project baseline or budgeted task and cost information is compared to what actually happened.
At any point during the project the project plan can easily be updated. MSP uses earned value analysis as a tool to compare the actual to the baseline plan. Table 7-1 shows the project updated as of 5/2. Task 2.0 has a baseline (budgeted) duration of 7 days. It actually took 12 days to complete. Task 3.3 took only 3 days instead of the baseline of 5 days. Since we hired the secretary earlier, we could start task 3.4 for scheduling the shoots earlier than expected. Because task 2.0 took longer, however, task 4.0 was delayed in starting. (MSP makes these adjustments automatically once actual information is entered.) All other tasks were on schedule. Step 6 is underway and not yet completed. Steps 7 to 9 have not yet begun.
Table 7-2 is the earned value table prepared by MSP once the project information is updated. Note that only completed stand-alone tasks or subtasks have final cost variances calculated for them. Summary tasks show the roll-up variances for their subtasks. The columns titled EAC, BAC, and VAC show “estimate at completion,” “budget at completion,” and “variance at completion (VAC = BAC – EAC),” respectively. MSP does not automatically adjust the estimate to complete by the CPI of the project to date as we did above.
![]()
As noted above, some older versions of MSP do not calculate earned value variances recommended by the PMI. The MSP earned value numbers in Table 7.2 have been corrected to reflect the PMI Project Management Body of Knowledge (PMBOK, Chapter 11) definitions. (In some older versions, MSP calculation methods even differ from the MSP “help” file definitions.) The calculations used in this book are those recommended by the PMI. Our detailed calculations above were for a particular project task, but the approach can sensibly be extended to an entire project to give a reasonable estimate of the percent completion of the project. The conventional 0/100, 50/50, or percent of budget (time) expended are too ham-handed to apply to the project as a whole. An alternative is to aggregate the calculations made for individual tasks, as shown in Table 7-2. Using the overall task data for the project to date, one can estimate the project CPI and SPI, and thus the cost and schedule at completion for the project.
Table 7-1 MSP Project Status Report for DVD Project, 5/2
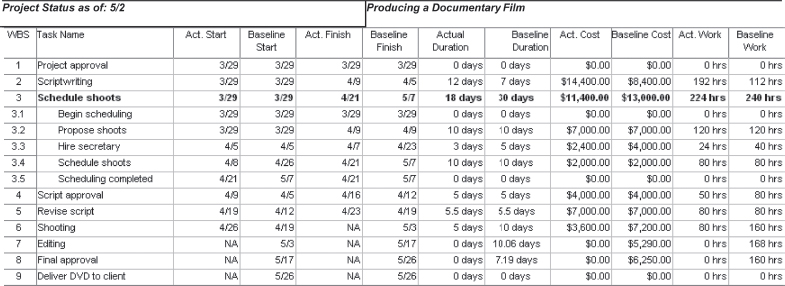
Table 7-2 MSP Earned Value Report for DVD Project, 5/2

If the earned value calculations indicate a cost or schedule deficiency, the PM must still figure out what to do (control) to get the project back on budget or schedule. Options include borrowing resources from other tasks, holding a brainstorming meeting with the project team, requesting extra resources from senior management, or informing the client and/or senior management of the projected deficiency. Unfortunately, research on 700 military projects indicated that the chances of correcting a poorly performing project more than 15–20 percent complete were effectively nil (Christensen, 1994).
An interesting exception to this situation is that of ViewStar Corporation, under contract to design an Accounts Receivable imaging system for Texas Instruments. As the project progressed, although costs were under control, earned value progress fell behind. To catch up, ViewStar directed the project team to meet only key project requirements at the least cost and time (Ingram, 1995). Earned value thereafter rapidly increased back to the planned schedule.
Earned value represents a way to capture both in-process performance and cost on a certain date as measured against budget or schedule. Including the planned costs and actual costs allows the calculation of spending and schedule variances, where negative values are undesirable. Using these figures, a projection can be made of costs to completion and total cost for the task or project under consideration. Although percentage completion makes limited sense for individual tasks and work elements, it has little meaning for the project as a whole. Nonetheless, one can aggregate the individual task earned values and variances to make reasonable estimates of project completion costs.
7.4 PROJECT CONTROL
Control, the act of reducing differences between plan and actuality, is the final element in the planning-monitoring-controlling cycle. Monitoring and comparing activities with plan, and reporting these findings is to no avail if actions are not taken when reality deviates significantly from what was planned. In fact, the simple act of noting and reporting discrepancies may motivate the actions required to correct the deviations. When it does not, however, active control is needed to bring performance, schedule, cost, or perhaps all three, back in line with plan. Control has the primary purpose of ensuring that the project is in compliance with its objectives. Particularly in large projects with a wealth of detail and constant hubbub, it is all too easy to lose sight of these three fundamental targets. Large projects develop their own momentum and tend slowly to move out of hand, going their own way regardless of the wishes of the PM, top management, and even the client. In large projects early control is crucial!
Control is one of the PM's most difficult tasks, invariably involving both mechanistic and human elements. Sometimes humans, through action or inaction, set in motion a chain of events that eventually results in a discrepancy between actuality and plan. Sometimes events occur that affect people in a negative way, leading to undesirable discrepancies. Anger, frustration, irritation, helplessness, apathy, despair, and many other emotions arise during the course of a normal project and affect the activities of the project team members who experience them. It is over this welter of confusion, emotion, inertia, fallibility, and general cussedness that the PM tries to intervene and exert control.
Control is difficult for a number of reasons, perhaps the most important of which is that it involves human behavior. The problem that the human element poses for control by the PM is that it invariably involves the project team—a “we” group rather than a “they” group—a group we perceive as our friends. Yet it is difficult to criticize friends, which is exactly what control does. Control means interceding in an activity that someone has been doing and “correcting” it, thereby implying that someone was at fault and doing something wrong.
Another reason that control is difficult is that problems are rarely clear cut, so the need for change and redirection is also fuzzy. In fact, most discrepancies uncovered by a monitoring system turn out to be “messes,” in the terminology of Russell Ackoff*. A “mess” is a general condition of a system that, when viewed by a manager, leads to a statement that begins “%#@*&+#!!!” and goes downhill from there. The discovery of a mess leads the PM to suspect that there is a problem(s) affecting the project; and in situations as complex as a project, identification of the real problems is difficult. Determining what to control raises further difficulties. Indeed, it is rarely clear if someone took an incorrect action, and thus needs to be corrected, or if the discrepancy (mess) was simply the work of an unkind Mother Nature.
Purposes of Control
There are two primary purposes of control: the stewardship of organizational assets and the regulation of results through the alteration of activities. So far in this chapter we have primarily discussed the latter in terms of the plan-monitor-control cycle, and we will spend the majority of the rest of the chapter on this purpose also. Thus, we take a moment to discuss the first purpose, conserving the organization's three primary assets: physical, human, and financial.
Physical asset control is concerned with the maintenance and use of the project's physical assets. This includes the timing as well as quality of maintenance being conducted on the assets. For example, it is important to conduct preventive maintenance prior to that last stage of the project life cycle known as the Last Minute Panic (LMP), even though the precise timing of the LMP is usually unknown. And, of course, physical inventory must be received, inspected, certified for payment to suppliers, and perhaps stored prior to use. All project assets, even the project coffeepot, project team's couch, and project library, must be controlled. Most important, however, is the set of physical equipment that was charged to the client that must be delivered to the client at the end of the project.
The stewardship of human resources primarily involves controlling and maintaining the growth and development of the project team. Fortunately, projects provide a particularly fertile environment for cultivating humans, given that each project typically offers a unique professional experience over a short duration. These experiences, more than performance appraisals and reports, foster growth and development of project team members.
Last, financial control involves stewardship of the organization's expenditures on the project, including both conservation of financial resources and regulation of resource use. Most accounting tools used for projects are excellent in this area of control: current asset controls, project budgets, capital investment controls, audits, and even representation on the project team through the project accountant. We cannot overemphasize the importance of proper conformance to both the organization's and the client's financial control and record-keeping standards. Recall that all project records, plans, budgets, evaluations, etc. are an organization's “assets” and are subject to the most rigorous control and preservation.
Nevertheless, the PM is invariably more inclined toward the use of project assets than to their conservation. Although most PMs view the conservationist mindset as that of the fabled librarian who is happiest when all the library's books have been collected from readers and are neatly sorted in their proper places on the bookshelves, PMs must realize the dual, albeit conflicting, roles they have assumed. These antithetical attitudes must, however, be merged and compromised in the PM as best they can.
An example of the use of extensive controls to help produce a successful project was the Metro Turnback project for San Francisco (Wu and Harwell, 1998). This massive, high-risk, 11-year underground construction project was conducted in the high-traffic, downtown region of the city. To keep the project on schedule and within budget, an extensive and complex Management Plan and Control System was devised. To illustrate the depth of this monitoring and control system, its subsystems are listed here: Project Code of Accounts, Cost Code of Accounts, Control Budget, Trend Program, Scope Change Log, Monthly Contract Cash Flow Schedule, Contractual Milestone Summary Schedule, Construction Schedule, 3-Week Rolling Construction Schedule, Quality Control and Quality Assurance Program, Contractor's Nonconformance Report, and Corrective Action Report.
For an example of what happens when control is inadequate, we turn to Cincinnati, Ohio, to quote from The Cincinnati Enquirer of January 21, 2000:
Guesswork, management neglect and possible criminal conduct allowed city engineers to report as completed $15 million in street repairs that were never done, a city audit says.
. . . . In annual reports between 1991 and 1997, the city's Engineering Division reported that a total of 818 lane miles [of street repairs] has been completed at a cost of about $65 million.
The internal audit found that only 460 lane miles have been completed, costing $50.5 million. (Cincinnati Enquirer, January 21, 2000, p. 1)
The issue has been assigned to limbo, still in a “blame someone else” state. It displayed certain aspects of low comedy with the city's Engineering Division, City Council, and City Manager all involved in the matter. There is little doubt that inadequate and unaudited reporting coupled with incompetent control by managers on several levels over 7 years all contributed to the fiasco.
Project control, the final activity in the planning-monitoring-control cycle, involves taking action when reality deviates from plan. It includes both mechanistic and human elements, and because it is closely concerned with human behavior, is one of the most difficult tasks of the PM. It includes two seemingly antithetical purposes: (1) stewardship of the organization's and the client's physical, human, and financial assets; and (2) the use of these assets to bring project actuality into conformance with the plan. Somehow, the PM must meld these two purposes into a uniform focus of activity.
7.5 DESIGNING THE CONTROL SYSTEM
When designing the control system, there are certain helpful guidelines to keep in mind. For instance, the primary purpose of the control system is to correct error, not to identify and punish the guilty. Managers must realize that the past cannot be changed, no matter how loudly they yell. Moreover, investment in the control system is subject to sharply diminishing returns. The cost of control increases faster and faster while the degree of control—and its value—increases more and more slowly.
We could, if we wished, control the quality of “hardware store” type wooden yardsticks, so that they were accurate to 1/10,000th of an inch. But who cares? Moreover, who would be willing to invest the increased cost in a product that is usually given away as a gift? Thus, there is some optimum amount of resources worth investing in the control process. The control system should exert control only to the degree required to achieve its objectives; additional control will not help and may be cost-inefficient.
In the same vein, as the degree of control increases beyond some difficult-to-define point, innovation and creativity are discouraged until they are finally shut off completely. In general, the control system should employ the lowest degree of hassle consistent with accomplishing its goals. It is best to avoid annoying those people whose cooperation is needed to reach project goals. To summarize, the control system should be cost-effective and should operate with the minimum force required to achieve the desired end results.
![]()
There are three primary mechanisms by which the PM exerts control: process reviews, personnel assignment, and resource allocation. The process review is directed to an analysis of the process of reaching the project objectives rather than on the results, per se. Because results are largely dependent on the process used to achieve them, the process can be subjected to control even if the results cannot. On R&D projects, for example, project team members usually cannot be held responsible for research or technological outcomes, but they can certainly be held responsible for adherence to the proposal, the budget, and the schedule. Care must be taken, however, not to overstress methods as opposed to results; although methods are controllable, it is still the results that count.
As an example of the effective use of process controls, Australia's 7-year Parliament House construction project matched the inherent construction complexity with an equally sophisticated set of schedule, cost, and time controls. The time controls, for instance, included four levels of increasing detail that could be accessed during progress review and coordination meetings (Nixon, 1987).
Control can also be exercised through personnel assignments based on past project productivity. Although it is relatively easy to separate workers in the top and bottom quartiles by measuring performance or productivity, separating the middle two quartiles is much more difficult, so this approach should be used carefully. Moreover, reassignment can have drawbacks in terms of creating elite groups of top producers but demotivating everyone else in the system.
Controlling resource allocation can be a powerful motivator—and demotivator. Resources are usually allocated to the more productive or important tasks and this can significantly influence the attainment of project results. (Remember that all tasks in a project must be completed to complete the project.) As in the use of other control techniques, the PM needs to exercise care when making decisions about which tasks need the resources in the future, regardless of past efficiencies.
There are some common mistakes PMs and other organizational managers make when trying to control projects. For example, when controlling processes, there is the danger of emphasizing short-run results at the expense of long-run objectives. Excessive control directed to specific objectives can result in sacrificing other project objectives. Across-the-board cuts in resource allocations tend to reward those who have already overspent or overhired while penalizing the frugal and efficient. Finally, focusing on certain items for control can distract the attention of team members from other, equally important items: “What isn't counted, doesn't count.” There is hardly a community in the United States that has not adopted a set of standardized tests to measure the learning of school children. The salaries of teachers are affected by these test results. It should, therefore, hardly come as a shock to the public that teachers spend considerable time and effort “teaching to the test.”
Types of Control Systems
The process of controlling a project, or any other system, is more complex than might be expected. Decisions must be made concerning where in the project we will try to exert control, what is to be controlled, how it will be measured, and how much deviation from plan will be tolerated before we intercede. It is helpful in making these decisions first to understand thoroughly the primary types of control systems used by project managers: go/no-go controls and post-control.
Before discussing the nature and use of these control systems, it is important to note that every control system must contain certain elements if it is to be useful. Any project (or production system) can be described in terms of its inputs, the process by which it works on the inputs, and the outputs that result. To control a project (or any production system) requires the following components:
- Each control must have a sensor, the duty of which is to measure any aspect of the project's output that one wishes to control. For instance, it must be able to measure the length of the yardstick we mentioned earlier.
- The control system must have a standard for each thing measured. For the yardstick, the standard is 36 inches.
- Next, the control system needs a comparator, a mechanism that compares the output of the sensor with the standard.
- Given the results of the comparison, the control system needs a decision maker to decide if the difference between what the sensor measured and the standard is large enough to warrant attention. For the yardstick, a group of 23 engineers attending a project management seminar did not expect (or require) accuracy greater than plus or minus ¼ inch. For more precise measurement they would insist on a steel tape measure.
- The final piece required in a control system is an effector. If the decision maker decides that some action is required to reduce the difference between what the sensor measures and the standard requires, the effector must take some action. It may operate on the input or the process (or both) to fix the problem.
Some control systems use all five of these elements automatically; for example, the mechanisms that control the ph (level of acidity) of the blood, the temperature of a home, the speed of an automobile operating on cruise control, or the speed with which a sheet of steel moves through a rolling mill. Such systems are called “cybernetic control systems” (kybernet is Greek for helmsman or steersman) or “negative feedback loops” or “steering controls.” All of the parts listed above must be present and operative to control any process. It is the PM's responsibility to ensure that such control elements are available and operating in project control. The process will not be automatic during project control. It must be operated by the PM or the PM's deputy.
The go/no-go control takes the form of tests (sensors) to determine if some specific precondition (standard and comparator) has been met before permission is granted to continue (decision maker and effector). This type of control can be used on almost every aspect of a project. The project plan, budget, schedule, earned value charts, and other such information can all operate as control documents. In addition, the PM has prespecified project milestones as control checkpoints. The PM can intercede at any level of the project tasks and subtasks for which detail is available in these control documents.
The “phase-gate” method of monitoring and control (also known as “quality gate,” “toll gate,” and other names) often makes use of the natural milestones in a project as phase gates, though some may be ignored or other phases added. The preconditions to pass each gate are specified beforehand so upper management will not be tempted to let a project slip by without a thorough evaluation, the result of which could be approval to proceed, an order for additional resources, a change in direction, or the termination of the project.
It is worth repeating that a primary aim of the PM is to intercept problems before they arise—at least before they get serious—so it is worthwhile for the PM to include an early warning system with the control system. In this way, potential problems can be exposed and dealt with before they turn into full-blown disasters. Because any project early warning system will include people, it is important for the PM to make it known that the messenger who brings bad news will not be shot, but anyone who sweeps bad news or problems under the rug will be!
An example of a status report used by the agricultural products division of a large chemical company for go/no-go control is illustrated in Figure 7-7. As can be seen, some of the tasks are completed, some are in progress, and some have not yet started. Details from the PM or additional reports about those tasks completed and in progress are used to make the go/no-go decisions.
Post-controls, also known as postperformance reviews, are applied after the project has been completed. Although it might appear that this is the legendary situation of locking the barn door after the horse has been stolen, it is not. The purpose here is not to control the already completed project, but to allow future projects to learn and profit from past project experience. Such lessons might include information about certain suppliers, cost-estimating procedures, or even ways of improving the process of managing projects. Certain managerial methods, organizational procedures, or processes might be altered for future projects, resulting in greater predictability and control and, one hopes, better performance, cost, or schedule results.
The earlier the PM can intercede in a problem, the more likely the project team will be able to correct its activities, but humans respond to these controls in different ways. Response to go/no-go controls tends to be neutral. Because there is no gradation between excellent and barely acceptable, or between terrible and just unacceptable, the fine line of acceptability thus becomes a very sharp knife, subject to complaint and irritation. In a project, however, criticism tends to be leveled toward the team instead of the individual so the response is often less severe than it might have been otherwise.

Figure 7-7 Sample project milestone status report.

Tools for Control
We have already described some of the tools that can help the PM in designing and applying the control system: variance analysis, trend projections, and earned value analysis. With trend projection, for instance, the PM can plot a budget, plan, or growth curve as shown in Figure 7-8 and then, as actual values come in with project progress, plot these as a dashed line on the same chart. Using the dashed line, the PM can forecast on a continuing basis what the projected completion will be. Based on the projection, the PM can decide if there is a problem, what alternatives exist for control, what they will cost and require, and what they will achieve.
Another useful tool for a PM is the critical ratio. A critical ratio indicates to a manager when a task or process is becoming unacceptable, typically when the ratio drops below 1. By tracking the ratio, the manager can anticipate when a problem may be brewing. The calculation of the critical ratio for project tasks is the product of a schedule ratio and a cost ratio. The schedule ratio is actual progress divided by scheduled progress, as measured by some common standard such as earned value: EV/PV. Clearly, ratios greater than one are desirable. The cost ratio is budgeted cost divided by actual cost, or if earned value data are available, EV/AC. Again, values greater than one are most desirable. Taking the product of these two ratios thus gives us an overall measure that includes performance, cost, and schedule.
CR = (actual progress/scheduled progress) × (budgeted cost/actual cost)
Note that the two ratios are equally important in the calculation of the critical ratio. If one ratio is bad, it can be offset by the other ratio if it is equally good. For example, if the actual progress is 2 and the scheduled progress is 3, resulting in a schedule ratio of 2/3, and the budgeted cost is 6 and the actual cost is 4, resulting in a cost ratio of 3/2, their product, 2/3 × 3/2 = 1. Thus, although the project is behind schedule, the cost is correspondingly below budget so everything is fine if lateness is no problem for this activity. This may not really be acceptable to the PM, so a wise PM will evaluate the components of a critical ratio as well as the overall value. Remember that the measurement of progress is subject to the same warnings we noted in the discussion of earned value.
Similar calculations are given in Table 7-3 where the above example is an illustration of Task Number 1. Task 2 is on budget but progress is lacking, so too much money was spent than should have been spent; when the project is completed, it will probably go over budget. Similarly, Task 3 is on schedule but is over budget, creating another probable cost overrun. The critical ratios for Tasks 4 and 5 both exceed 1.0, and none of the subratios is a problem. Task 4 is ahead of schedule and on budget, and Task 5 is on schedule and below budget. The PM may want to look further into these happy events to see what is going on, or if the monitoring system is reporting accurately.
Table 7-3 Critical Ratio (CR) = (actual progress/scheduled progress) × (budgeted cost/actual cost)
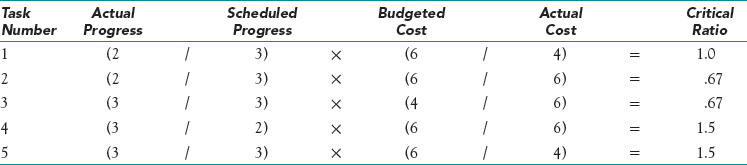
Table 7-4 Monitoring the Critical Ratio
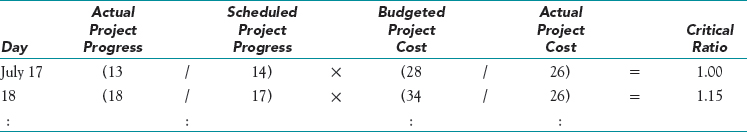
Beyond evaluating each of the activities of a project, a critical ratio for the project as a whole can be calculated as well, as illustrated in Table 7-4. Here, the project is assumed to consist of the five tasks in Table 7-3 and the values of each element of the critical ratio are summed on a daily basis with the critical ratio calculated for each day. This ratio can then be itself tracked in a table (see Table 7-4 where the first day is from Table 7-3) and plotted on a control chart. The PM can also set some “control limits” for the critical ratio so that if they are exceeded on the upside or downside, an investigation is in order, as shown in Figure 7-9. Different tasks, of course, may warrant different control limits. Further, the upside limits may be different, probably larger, than the downside (problem) limits.
Dealing with such differences is the purpose of another tool, the control chart. Any measure—the volume of raw material being used, the cost of contract labor in the project, the hours of computer time—can be plotted and tracked on a control chart such as that shown in Figure 7-10. As illustrated, control limits for intervention can be set by the PM and shown on the chart, so that when a measure exceeds one of these limits, action is instigated.
Another recent development, benchmarking, can be a useful tool for a PM when designing a monitoring and control system (Christensen, 1994; Gupta and Graham, 1997; Ibbs and Kwak, 1998; Thamhain, 1996; Toney, 1997). The process here is to make comparisons to “best in class” practices across organizations, or divisions, or even departments within an organization. An example is a benchmarking study (Ibbs and Kwak, 1998) to generate data for a Project Management Maturity Model. The model measures project processes, tools, techniques, and practices across a range of industries, the various life-cycle phases, and the ten knowledge areas of PMBOK.
![]()
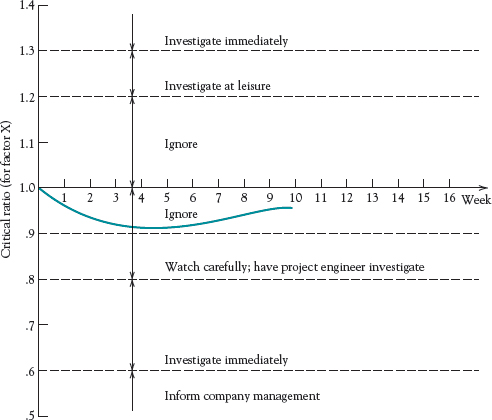
Figure 7-9 Critical ratios with control limits.

Figure 7-10 Cost control chart.
An example of an internal benchmarking study was Johnson Control's benchmarking of the project management procedures of their own highly successful product development project managers, to be used by less-successful project managers. They identified four common sets of procedures these successful PMs all used. These procedures are now used to train new employees, standardize practices, create a common language, tie together company functions, and create a positive project management culture (Reith and Kandt, 1991). Benchmarking and the control chart are tools commonly used in quality management, a subject discussed in more detail in Chapter 8 of PMBOK. (See also Meredith and Shafer, 2013.)
![]()
Designing the project control system entails many issues, but the major guiding objective should be to create a balanced system where the benefits obtained exceed the cost of control. The primary means to active control by the PM are process reviews, personnel reassignment, and resource allocation. Two types of control systems are useful for projects: go/no-go controls and post-controls. Tools to aid the PM in control are variance analysis, trend projections, earned value analysis, critical ratios, control charts, and benchmarking.
7.6 SCOPE CREEP AND CHANGE CONTROL
If midcourse changes in the project specifications are not controlled, the following are typical results: a newspaper front-page headline reading “Stadium costs soaring;” an article on an inner page stating that “Change orders . . . are one of the most common sources of waste and fraud during projects, experts say;” and a quote from a County Commissioner, “The project is in trouble, but it's absolutely recoverable. . . . We can work out responsibility for those payments at a later time. Now is not the time to start pointing fingers.” An auditor appointed to look into the matter “found that there is not sufficient oversight to properly monitor the change orders, check if they were necessary and determine who is responsible” (see Cincinnati Enquirer, February 15, 2000, pp. A-1 and A-4).
As we noted in Chapter 6, input from over 500 project managers regarding things that “bugged” PMs the most indicated that coping with changes is at the top of their list. The most common source of changes is the natural tendency of the client, as well as the project team members, to try to improve the project's output as the project progresses—a phenomenon so frequently encountered, a name for it has been coined: “scope creep.” The most common result of scope creep is an upset client who was not (or claims not to have been) told how long the change would delay the project and how much it would raise the project's cost. The general subject of scope management is described in more detail in Chapter 5 of PMBOK.
![]()
New technologies and materials become available, new requirements and needs become apparent, and these lead to changed projects. The later these changes are made in the project, the more difficult and costly they become. The one absolutely certain thing about a project—even though virtually nothing in a project is ever certain—is that there will be concerted attempts to change it. PMs must expect these attempts and be prepared to deal with them. Fighting change is not appropriate. The best approach is for the PM to set up a well-controlled, formal process whereby such changes can be introduced and accomplished with as little distress as possible.
This process is known as the change control system. The purpose of this system is to:
- review all requested changes (either content or procedural changes)
- identify all impacts the change may have on other project tasks
- translate these impacts into alterations of project scope, schedule, and cost
- evaluate the benefits and disadvantages of the requested changes
- identify and evaluate alternative changes that might accomplish the same ends with greater benefits and/or fewer disadvantages
- install a process so that individuals with appropriate authority may accept or reject the proposed changes
- communicate accepted changes to all concerned parties
- ensure that the changes are implemented properly
- prepare reports that summarize all changes to date and their impacts
![]()
Avoiding scope creep is not possible. Controlling it, and thereby reducing some of the pain, is possible—if the PM follows a few rules.
- Every project plan must include a change control system by which requests for changes in the project's plan, processes, budget, schedule, or deliverables are evaluated.
- Every project change must be introduced by a change order that includes a description of the agreed-upon change together with any resulting changes in the plan, processes, budget, schedule, or deliverables.
- Changes must be approved in writing by the client's agent as well as by a representative of senior management of the firm conducting the project.
- The project manager must be consulted on all proposed changes prior to the preparation and approval of the change order. (The PM's approval is not required.)
- Once the change order has been approved, the project plan be amended to reflect the change and the change order becomes a part of that plan.
The process of controlling change is not complicated. For large projects, a change control board consisting of all interested parties is recommended for handling change requests. For smaller projects, a smaller group may be designated. The main source of trouble with requested changes is typically that the PM, in an attempt to avoid bureaucracy, adopts an informal process of handling requests for change. Such a process leads to misunderstanding on the part of the party requesting the change, and before the PM can undo the damage, the organization is committed to extending the scope of the project but without the additional resources and time to do it.
![]()
In March 2003, the United Kingdom's Child Support Agency (CSA) started using their new $860 million software system for receiving and disbursing child support payments (PMI, January 2005). By the end of 2004, however, only about 12 percent of all applications had received payments, and even those took about three times longer to process than expected. CSA is now threatening to scrap the entire system and is withholding $2 million/month in service payments to the software vendor. The problem seems to be due to control both scope management problems and the lack of a risk management strategy. The vendor claims that the project was disrupted constantly by CSA's 2,500 change requests, while CSA maintains that there were only 50 requests, but the contract did not include a scope management plan to help define what constituted a scope change request. The lack of a risk management strategy resulted in no contingency or fallback plan in case of trouble, so when project delays surfaced and inadequate training became apparent, there was no way to recover.
Scope creep arises quite naturally from both the client as well as the project team as new capabilities and needs surface during the course of the project. Rather than trying to ignore or handle change requests on an informal basis, the PM must anticipate that they will inevitably arise and institute a formal change control system to handle them. The purpose of the system is to evaluate each change formally to determine its benefits as well as its costs and other impacts on the project, and to make arrangements for obtaining the resources and altering the project specifications as needed to implement the change, if it is eventually approved.
REVIEW QUESTIONS
- Why can't the PM use the organization's current information system for project monitoring and reporting?
- What does it mean to say that project monitoring and control are on the opposite sides of project selection and planning?
- The monitoring system is the direct connection between project planning and control. Why is this true?
- Why is it probably a good idea to avoid periodic reports, except in specific cases such as reports tied to the organization's accounting system?
- Aside from the obvious benefits for project control, what other benefits might result from a good project reporting system?
- If the calendar should not dictate reporting frequency, what should?
- Using earned value analysis, explain how the total cost of a partially completed project can be estimated.
DISCUSSION QUESTIONS
8. When making an estimate for the time and cost to execute a project, should the time and cost required to develop the planning, monitoring, and controlling systems be included as well? Should the actions required to monitor and control a project be included in the project's action plan or WBS?
9. The chapter included an example of a firm where the PM dispensed with all the planning formality because no one ever looked at it anyway. What did the PM think the purpose of such planning was in this firm? What should the firm do in the future to correct this problem?
10. In fields such as psychology and sociology, verbal characterizations are frequently used to show the amount of some factor. How might one set up such a measure for a project management characteristic such as the “energy” of the project team?
11. How might one measure team morale?
12. How can the PM circumvent the problem that the monitoring system can only report on activities that have passed, thus telling the PM what has already gone wrong but not what will go wrong in the future?
13. How might using electronic media to report project information lead to problems with control?
14. Explain how the earned value chart captures all three objectives of a project: performance, cost, and schedule.
15. Why isn't there an earned value reporting convention that allows progress on a task to be credited when the task is half completed? Wouldn't this be more accurate than giving credit only when the task is finally completed?
16. When would spending and schedule variances be more informative than ratios? When would ratios be better?
17. How should a PM reconcile the dual purposes of control: conserving resources and regulating results through the use of resources?
18. Identify situations where each of the following control tools might be useful: earned value charts, benchmarking, critical ratios, control charts, variance analysis, trend projections.
19. How might the existence of a change control system affect the behavior of a client, or a project team member, who desires to make a change in the project?
20. “In order to manage for overall project success, control must be exercised at the detailed work level for each aspect of project performance or no significant change will occur.” Does this mean that the PM should micromanage the project? If not, what does it mean?
21. Select a hypothetical project (e.g., designing and building a Web site, installing a new machine in an assembly line, or conducting a major inspection and repair of a passenger aircraft), and briefly describe an example of how each of the following types of control data might be used for project control: (a) Frequency counts (b) Raw numbers (c) Subjective numeric ratings (d) Indicator and surrogate measures.
22. Of all the rules for conducting meetings, the most difficult to enforce is the injunction against the weekly (or daily) standard project progress report (the “show and tell” meeting). Why is this, and under what circumstances do you think that such meetings are justified?
23. If your project management software calculates earned value, or any other standard item to be reported, differently than the Project Management Institute suggests, should you deal with this matter in management reports? If so, how?
24. Logically, when using earned value data in the critical ratio formula, should the “budgeted cost” be the planned value or the earned value? What problems occur with each choice?
PROBLEMS
25. A project in its 26th week has an actual cost of $270,000. It was scheduled to have spent $261,000. For the work performed to date, the budgeted value is $272,000. What are the cost and schedule variances for the project? What are the SPI and CPI?
26. A project has just completed the 87th item in its plan. It was scheduled to have spent $168,000 at this point in the plan, but has actually spent only $156,000. The foreman estimates that the value of the work actually finished is about $162,000. What are the spending and schedule variances for the project? What are the SPI and CPI?
27. The following project is at the end of its sixth week. Find the cost and schedule variances. Also find the CPI and SPI. Then find the critical ratio of the project using earned value calculations. Finally, calculate the ETC and EAC for the project.
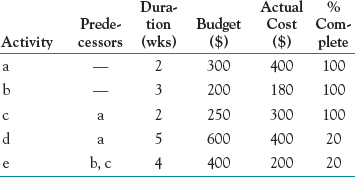
28. Repeat Problem 27 using MSP (omit calculation of CPI and SPI).
29. Given an activity in a smartphone design project whose planned cost was $13,000 but actual cost to date is $12,000 so far, and whose value completed is only 80%, calculate the cost and schedule variances. Will the client be pleased or angry?
30. Resolve Problem 27 using the 50-50 rule for planned value and earned value.
31. Given the following information about a website design, which activities are on time, which are early, and which are behind schedule?
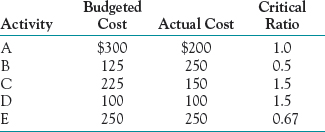
32. Design and plot a critical ratio chart for an advertising project that had planned constant, linear progress from 0 to an earned value of 400 over a 100-day duration. In fact, progress for the first 20 days has actually been: 4,6,8,12,14,18,24,28,30,34,40,42,42,44,48,52,54,58,62, 66. What can you conclude about this project?
INCIDENTS FOR DISCUSSION
St. Margaret's Hospital
Mary Lynn DeCold is the Quality Improvement Director at St. Margaret's Hospital, a large acute care facility. She is responsible for monitoring all of the performance improvement projects that take place in the hospital. At any given time numerous projects can be underway, some departmental and some enterprise-wide efforts.
The Joint Commission on Accreditation of Healthcare Organizations is scheduled to conduct a survey of St. Margaret's in 9 months. It is a requirement of the accrediting agency that three performance improvement projects be spotlighted during the survey. Mary Lynn wants to be sure that she picks three projects that will be finished within the next month or 2 so that they have at least 6 months' worth of data to show that the project improved performance.
Mary Lynn is having trouble getting information on the status of the three projects she chose. Communication between the project managers and the Quality Improvement Department is not always timely. She wants to be sure that all three are completed in plenty of time before the survey is scheduled. Mary Lynn also wants to be able to tell where the projects are in relation to each other, as they all need to be completed by a certain date. She wonders how she can tell if they are behind or ahead of schedule.
Question: What would you recommend Mary Lynn do?
Stoneworth Paving Company
Stoneworth Paving Company specializes in highway paving jobs for the State of Virginia. When the state first awarded Stoneworth the contract, they stipulated a 1 percent penalty for each week Stoneworth was late on a completion date. Preston Flintrock, the project coordinator for Stoneworth, began to notice that the last two jobs were 3 weeks late, and the paving job that was due to be completed in the next 2 weeks was behind schedule. When Preston went in the field to investigate, he found the job to be understaffed, supplier delays, and a high work rejection rate/repaving needed. As a result, Preston decided to establish a better system of project control and present it to his boss.
Question: If you were Preston, what characteristics would you be looking for in a new control system? Will a new control system be adequate for the problem? Explain.
Happy Customers
J. Z. Smith is a small consulting firm specializing in implementing new information systems installation projects for service agencies. J. Z. Smith has a standard project action plan for the implementation projects they work on. They feel very confident in the project plan they use; all steps are included and the costs are estimated well.
The project teams are very entrepreneurial and have great relationships with their small client base. The company works with their clients informally following the standard action plan. They provide weekly progress reports for the client and for Jeremy Smith, the president of J. Z. Smith. Jeremy has noticed that they have problems with meeting budgets and due dates. He thinks his teams allow their clients to add steps to the projects. A current client, the local welfare department, has asked J. Z. Smith to help them implement a newly purchased Dead-Beat-Parent tracking system. Jeremy is nervous and wants to be sure that they meet the specifications of this new project. He is not sure if the standard action plan needs changing or if there is something else he should do.
Question: What should Jeremy Smith do?
Cable Tech, Inc.
Cable Tech is a contract cable wiring company. It provides support to local cable companies in seven states in the midwest. Cable Tech has one operation in each state, and they vary in size from 60 to 250 employees. A disturbing trend has been developing for the last couple of years that Cable Tech management wishes to stop. Incidences of tardiness and absenteeism are on the increase. Both are extremely disruptive in a contract wiring operation. Cable Tech is nonunion in all seven locations, and since management wants to keep this situation, it wants a careful, low-key approach to the problem. Assistant Personnel Manager Jean Alister has been appointed project manager to recommend a solution. All seven operations managers have been assigned to work with her on this problem.
Jean has had no problem interfacing with the operations managers. They quickly agreed that three steps must be taken to solve the problem:
- Institute a uniform daily attendance report that is summarized weekly and forwarded to the main office. (Current practice varies from location to location, but comments on attendance are normally included in monthly operations reports.)
- Institute a uniform disciplinary policy, enforced in a uniform manner.
- Initiate an intensive employee education program to emphasize the importance of good attendance.
In addition, the team decided that the three-point program should be tested before a final recommendation is presented. They thought it would be best to test the program at one location for 2 months. Jean wants to control and evaluate the test by having a daily attendance report transmitted to her directly at headquarters, from which she will make the final decision on whether or not to present the program in its current format.
Question: Does this monitoring and control method seem adequate? What are the potential problems?
St. Dismas Assisted Living Facility Case—5
It is now just 4 months until the Assisted Living Facility program is scheduled to be completed. The team is excited because they can watch the construction of the facility and feel they are moving toward the end of this program.
Every week since construction began, the construction project manager, Kyle Nanno, has been holding a meeting of his project team. At the meetings he invites representatives of the construction company, the facilities manager from St. Dismas, the Director of Security, and other key people as he deems necessary. The meetings are scheduled every Friday at 1:00 PM and last not more than 1 hour. No matter who is or is not there, Kyle starts the meetings exactly at 1:00 PM. Kyle developed the following standing agenda:
- Review schedule and budget as of today's date
- Review schedule and budget for next 2 weeks
- Issues impacting schedule or budget
- Next steps and action items to be completed
The construction project update presented at the April 11, 2001 meeting is shown on the next page.
After each meeting the construction project manager emails the minutes of the meeting and the action item list generated to each member of the Construction Project team. He also sends the information to Fred Splient, the president of St. Dismas, as well as to each member of the ALF Project Steering Team.
Following the update is the most recent copy of the action items generated at the 4/11/01 construction project meeting.
Upon reading the minutes and action items from the week's meeting, Fred got quite angry. Fred read the minutes every week and would immediately phone Kyle to ask why certain decisions still had not been made. This week he wanted to know why the location of the security panel had not been picked out yet, and what the hair salon issue was about. Kyle decided that these matters would be better discussed face to face. He went to Fred's office.
Kyle proceeded to explain to Fred that the Director of Security, Frank Geagy, had not attended the construction project update meeting in weeks. Kyle said that Frank informed him that in light of the cost cutting going on in the hospital, he is short staffed and cannot hire a new security guard. Frank states that he personally has to cover shifts during the time when the update meetings take place. Kyle told Fred that he was not comfortable making the security panel decision without the head of security's input, and that Frank has not returned his phone calls or answered his emails. Fred Splient proceeded to tell Kyle in a very loud and angry voice, “That guy is not short staffed and is not busy covering anyone's shift. Who does he think he is?” Fred instructed Kyle to tell Frank to answer the contractor's questions immediately or the decisions would be made for him.
Kyle said he would do so and then changed the subject. He told Fred that they were still waiting for the city officials to approve the parking lot construction permit. St. Dismas's legal officer estimated that it would take 8–10 weeks to hear back on approval. Kyle allocated that amount of time in the schedule.
Kyle received notice from Fred to proceed with the parking lot construction on January 11, 2001. On February 9, he submitted the application for a permit, complete with appropriate plans and descriptions of the proposed lot, and allocated 10 weeks to wait for the county to notify him. He expected approval on or before April 19 and scheduled construction to begin April 20. Privately, he doubted he would hear from the county by his target date.
The lot would take 3 weeks to build, 2 weeks to install the lighting and add landscaping, and 1 week to pave and stripe. The plot had to be completed by the end of June so that parking spaces would be available when Marketing wanted to begin showing the facility to potential residents. This was a tight schedule, but the marketing people insisted that residents had to begin preparing for this kind of move at least a month before they took residence. Potential residents needed to see the facility, get familiar with apartment layouts, and they needed a place to park. Also, Marketing insisted on having some occupancy by the opening date.
Kyle told Fred that Legal was calling the county weekly to follow up. Fred wanted to know why the parking lot construction was not outlined on the project plan for facility construction. Fred asked Kyle to add it to the Gantt chart and to do a what-if analysis on the assumption that the county did not respond until May 1. Fred also wanted to know the latest date that they could be notified and still meet a June 15 deadline for completion of the lot.
As Kyle was leaving Fred's office, Fred asked him about the hair salon. Kyle explained that the COO and VP of Marketing had come up with an idea to build and operate a hair salon in the facility for the residents. They thought this might be a great selling point that could generate revenue. They came to Kyle just 2 months ago and asked him to include a hair salon on the first floor of the facility. Kyle explained that he did not have enough information to be able to determine the impact this would have on the construction schedule or the cost of this addition. Fred listened and then wondered if the members of his team had done any analysis to determine if this was a good idea or not. Fred told Kyle he would get back to him on that one. He then made a phone call to the COO and VP of Marketing.
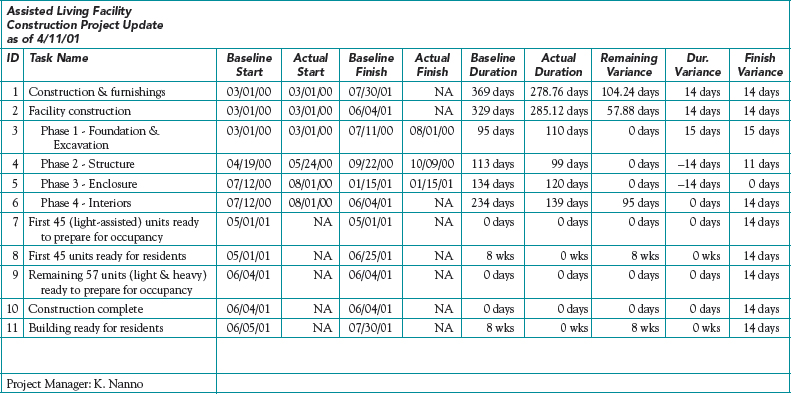
St. Dismas—Assisted Living Facility
Construction coordination meeting 4/11/01
ACTION ITEM LIST
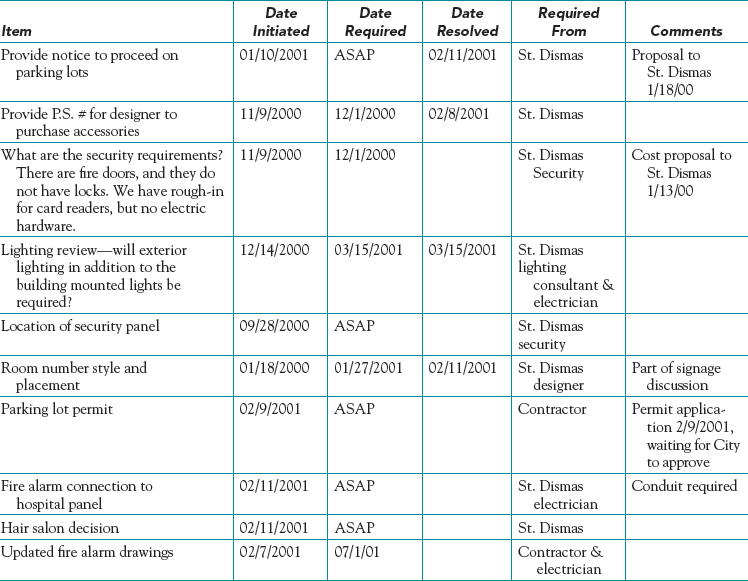
QUESTIONS
- What do you think the construction project manager should have done when the Director of Security stopped attending the project meetings?
- Do you think it is an effective communications tool to send the construction project meeting minutes to the ALF steering team and the President? Support your answer.
- How much time has to be made up for the original, baseline schedule to be met?
- Develop a plan and draw a Gantt chart for the Parking Lot phase of the project as originally planned by Kyle. Answer Fred's questions.
- What information does Fred need to make a decision about building a hair salon?
Palmstar Enterprises, Inc.
Palmstar Enterprises, a leading manufacturer of tablet computers, is currently in the process of developing its next generation device, the model 2000HD. A key feature of the 2000HD is its high definition display. According to the original project schedule, the 2000HD is to be released 1 month from now.
Because the amount of time required to convert the existing software to capitalize on the high definition display was significantly underestimated, the project has fallen behind schedule. The project manager estimates that without additional resources, the development project will be 3 months late. He has also estimated that increasing the project's budget of $3 million by 30 percent would permit the project to be completed on schedule. The added budget would be used primarily to staff the project with additional software engineers.
If released on schedule, first quarter demand for the 2000HD is forecast to be 200,000 units at an initial price of $450. Demand data for similar products suggest that unit sales will increase 5 percent per quarter over the product's 3-year life. Despite pricing pressures in the market, accounting data indicate that Palmstar is able to maintain a 20 percent contribution margin to profit and overhead through continuous process improvements and efficiencies accruing from producing in larger volumes.
QUESTIONS
- What has a larger impact on Palmstar's profits: delaying the 2000HD's introduction by 3 months or increasing the project's budget by 30 percent?
- Are there other factors you would consider in addition to profit?
- What should Palmstar do? Why?
- How generalizable do you think the results of your analysis in this particular case are to other situations?
![]()
Peak Lighting, Inc.
Peak Lighting, Inc. develops stages, lighting systems, and special effects for the concert tours of major musical acts. Recently, they were approached by Bullwhip, a popular band, to develop the stage, lighting, and special effects for its upcoming tour.
The project to develop the stage, lighting, and special effects for a concert tour progresses through four major phases. In the first phase, which lasts about a week, Peak develops a sound track for the concert based on the song list the band provides it for the tour. Using the sound track, Peak employees develop a synchronized lighting and special effects show on a computer that allows them to view an animated stage with the lighting and special effects as the sound track is being played.
In the second phase, the materials needed for the stage, lighting, and special effects are ordered from outside suppliers. The lead time for receiving these materials is 4 weeks, and during this period the project team members are assigned to other projects.
Once all the materials arrive, the third phase involves constructing the stage with the lighting and special effects. Also, writing the computer code to control the lighting and special effects is done in the third phase. This phase takes 3 weeks.
In the final phase, which takes a week, the lighting and special effects are tested and enhanced. The total cost of the Bullwhip project is estimated to be $600,000 of which $400,000 is for the stage, lighting equipment, and special effects, and $200,000 is for labor costs.
Eric Page was recently hired as Peak's VP of Operations. All the project managers that oversee the stage and lighting projects report to Eric. Prior to joining Peak Lighting, Eric served as a project manager for a leading management consulting firm for 10 years. Based on his extensive project management experience, one of the first things Eric did in his new role as VP was implement a formal project reporting system that would help him monitor the progress of the projects under way.
The Bullwhip project had been underway for 5 weeks, and all the materials had arrived. The project team was now ready to start the third phase of the project and construct the stage with the designed lighting and special effects.
In reviewing the most recent progress report for the Bullwhip project and based on his project management experience, Eric became gravely concerned. According to the report, the project had an earned value of $120,000 based on the project manager Jimmy Rush's estimate that 20 percent of the project had been completed. In further studying the report, Eric observed that the planned value and actual costs incurred were both $440,000.
Based on his concern, Eric decided to walk down the hall to Jimmy's cubicle and discuss his concerns related to the progress on the project.
Eric began:
I just reviewed the progress report for the Bullwhip project, and I am very concerned that the project is falling way behind schedule. Based on my review, it appears there are very significant cost and schedule variances. As you know, we have a hard deadline for completing the project as the Bullwhip needs everything fully operational 2 weeks prior to the start of their tour so they can rehearse with it.
Jimmy responded:
To be perfectly honest, I don't know much about schedule and cost variances but I do have a great deal of experience managing these projects. Again, I don't know how you calculated the variances you mentioned, but in my view we are exactly where we should be.
To this Eric replied:
I don't see how you can possibly think the project is on track when it has an earned value of only $120,000 and the planned value by this point in the project is $440,000? And I am equally disturbed you don't understand basic project management concepts such as earned value.
Later that day, Jimmy shared his frustration about his new boss with one of the project team members. “Eric really chewed me out today. He questioned my ability to manage a project. I wonder if he even understands the nature of these projects. Does he even get it that two thirds of the project costs are for materials and that these costs are incurred in the early part of the project?”
QUESTIONS
- Calculate the schedule variance and cost variance for the Bullwhip project.
- Does Jimmy's point about the material costs have merit? If so, does this have any implications for the way the earned valued is calculated at Peak?
- Who is right about the status of the project? Eric or Jimmy?
- What advice, if any, would you offer Eric related to his new role of VP of Operations?
BIBLIOGRAPHY
ACKOFF, R. L. “Beyond Problem Solving.” Decision Sciences, April 1974.
ADAMS, J. R., and L. L. ADAMS. “The Virtual Project: Managing Tomorrow's Team Today.” PM Network, January 1997. (An excellent brief discussion that covers the nature of virtual projects and some of the communication methods allowing their proliferation.)
BARR, Z. “Earned Value Analysis: A Case Study.” PM Network, December 1996.
BYRNE, J. “Project Management: How Much Is Enough?” PM Network, February 1999.
CHRISTENSEN, D. S. “A Review of Cost/Schedule Control Systems Criterion Literature.” Project Management Journal, September 1994. (This study of military projects notes that after a project is 15–20 percent complete, its total CPI changes by less than 10 percent and overruns worsen. This article is briefly noted in Flemming and Koppleman, 1996.)
DEAN, B. V. Evaluating, Selecting, and Controlling R&D Projects. New York: American Management Association Research Study 89, 1968.
FLEMMING, Q. W., and J. M. KOPPLEMAN. “Forecasting the Final Cost and Schedule Results.” PM Network, January 1996. (This is one of five excellent, instructional articles on earned value by these authors. They appeared in PM Network between January 1994 and May 1996.)
GUPTA, V. K., and D. J. GRAHAM. “A Customer Driven Quality Improvement and Management Project at Diamond Offshore Drilling.” Project Management Journal, September 1997.
IBBS, C. W., and Y.-H. Kwak. “Benchmarking Project Management Organizations.” PM Network, February 1998. (This article discusses the development of a tool for finding and assessing the “best” managerial tools for project management.)
INGRAM, T. “Client/Server, Imaging and Earned Value: A Success Story.” PM Network, December 1995.
MEREDITH, J. R., and S. M. SHAFER. Operations Management for MBAs, 5th ed. New York: John Wiley, 2013.
NIXON, T. R. “Project Management at the New Parliament House, Canberra.” Project Management Journal, September 1987.
PMI, “Lack of Support,” PM Network, January 2005.
PMI Standards Committee. A Guide to the Project Management Body of Knowledge 5th ed. Newton Square, PA: Project Management Institute, 2013.
REITH, W. D., and D. B. KANDT. “Project Management at a Major Automotive Seating Supplier.” Project Management Journal, September 1991.
THAMHAIN, H. J. “Best Practices for Controlling Technology-Based Projects.” Project Management Journal, December 1996. (A fine analytical study of finding and assessing the “best practices” for controlling high-technology projects. It not only finds the “best” control practices, but also generates a “benchmark” to which any firm can compare its practices.)
TONEY, F. “What the Fortune 500 Know about PM Best Practices.” PM Network, February 1997.
WU, C., and G. HARWELL. “The MUNI Metro Turnback Project.” PM Network, May 1998.
*Dean (1968) was a classic work in the infant field of project management that proposed several major innovations in the field.
*Here we adopt the standard PMBOK convention that a negative variance is undesirable. While this convention is most common, it is not universal either in the literature or in practice.
*The term “mess” originated in a provoking but delightful after-lunch speech to a large, mixed business/academic audience at a meeting of the American Institute of Decision Sciences (renamed the D.S.I. following the AIDS epidemic in Africa) in Boston, MA on November 16, 1973. In his speech Ackoff draws a useful distinction between detecting and describing a “mess” (the task of managers), and translating the mess into a set of “structured problems” (the task of the analyst/academic).