
If we are fitting data to a straight line, the parameters of the mathematical model will be the slope and intercept of the line. When we determine the parameters of a model, we fit the model on a subset of the data (training set), and we evaluate the performance of the model on the rest of the data (test set). This is called
validation and there are more elaborate schemes. The scikit-learn GridSearchCV class uses k-fold cross-validation, for example.
Classifiers and regressors usually require extra parameters (hyperparameters) such as the number of components of an ensemble, which usually have nothing to do with the linear model as mentioned in the first sentence. It's a bit confusing to talk about models because we have models with plain parameters and a bigger model with hyperparameters.
Let's call the bigger model a level 2 model, although this is not standard nomenclature as far as I know. If we are using GridSearchCV to obtain the hyperparameters of the level 2 model, we have another set of parameters (not hyperparameters or level 1 parameters) to worry about—the number of folds and the metric used for comparison. Evaluation metrics have not passed the review yet (refer to Chapter 10, Evaluating Classifiers, Regressors, and Clusters), but there are more metrics than we used in this chapter. Also, we might worry whether we determined the hyperparameters on the same data as used to evaluate the results. One solution is to apply
nested cross-validation.
Nested cross-validation consists of the following cross-validations:
- The inner cross-validation does hyperparameter optimization, for instance using grid search
- The outer cross-validation is used to evaluate performance and do statistical analysis
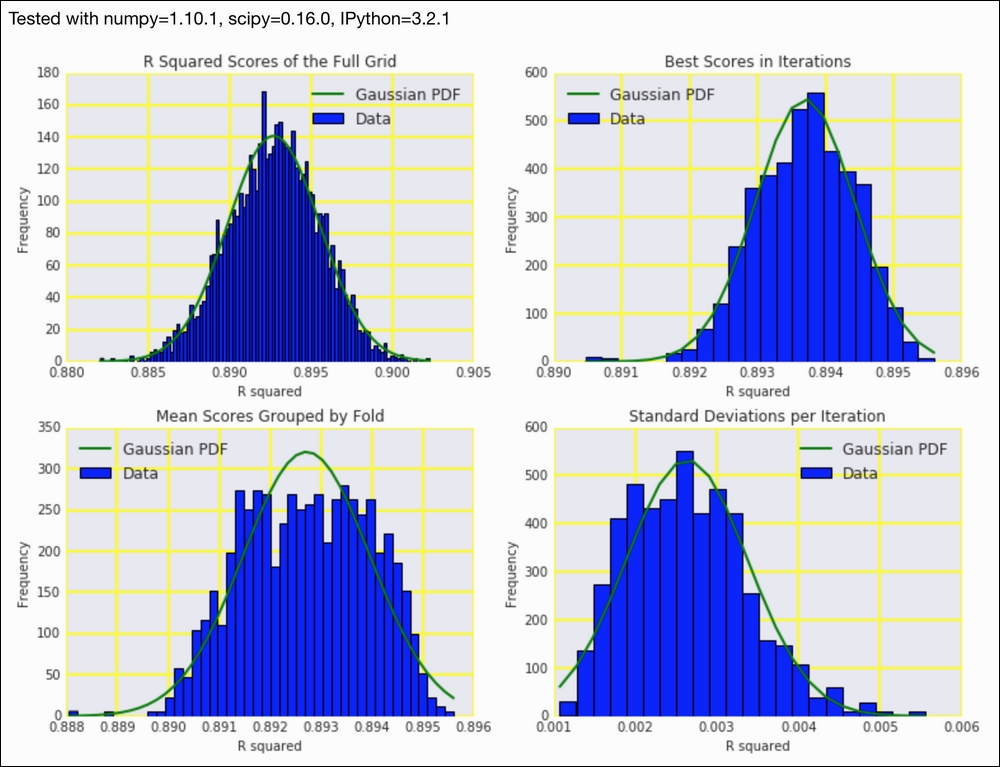
In this recipe, we will look at the following distributions:
- The distribution of all the scores
- The distribution of the best scores for each outer cross-validation iteration reported by
GridSearchCV - The distribution of the mean scores for each fold
- The distribution of the standard deviations of scores within a
GridSearchCViteration
The code is in the nested_cv.ipynb file in this book's code bundle:
- The imports are as follows:
from sklearn.grid_search import GridSearchCV
from sklearn.cross_validation import ShuffleSplit
from sklearn.cross_validation import cross_val_score
import dautil as dl
from sklearn.ensemble import ExtraTreesRegressor
from joblib import Memory
import numpy as np
from IPython.display import HTML

memory = Memory(cachedir='.')
- Get the R-squared scores as described in the previous section:
@memory.cache def get_scores(): df = dl.data.Weather.load()[['WIND_SPEED', 'TEMP', 'PRESSURE']].dropna() X = df.values[:-1] y = df['TEMP'][1:] params = { 'min_samples_split': [1, 3], 'min_samples_leaf': [3, 4]} gscv = GridSearchCV(ExtraTreesRegressor(bootstrap=True, random_state=37), param_grid=params, n_jobs=-1, cv=5) cv_outer = ShuffleSplit(len(X), n_iter=500, test_size=0.3, random_state=55) r2 = [] best = [] means = [] stds = [] for train_indices, test_indices in cv_outer: train_i = X[train_indices], y[train_indices] gscv.fit(*train_i) test_i = X[test_indices] gscv.predict(test_i) grid_scores = dl.collect.flatten([g.cv_validation_scores for g in gscv.grid_scores_]) r2.extend(grid_scores) means.extend(dl.collect.flatten([g.mean_validation_score for g in gscv.grid_scores_])) stds.append(np.std(grid_scores)) best.append(gscv.best_score_) return {'r2': r2, 'best': best, 'mean': means, 'std': stds} - Get the scores and load them into NumPy arrays:
scores = get_scores()
r2 = np.array(scores['r2'])
avgs = np.array(scores['mean'])
stds = np.array(scores['std'])
best = np.array(scores['best'])
- Plot the distributions as follows:
sp = dl.plotting.Subplotter(2, 2, context)
dl.plotting.hist_norm_pdf(sp.ax, r2)
sp.label()

dl.plotting.hist_norm_pdf(sp.next_ax(), best)
sp.label()

dl.plotting.hist_norm_pdf(sp.next_ax(), avgs)
sp.label()

dl.plotting.hist_norm_pdf(sp.next_ax(), stds)
sp.label()
HTML(sp.exit())
Refer to the following screenshot for the end result (distributions of cross-validation results):
- The Wikipedia page about cross-validation at https://en.wikipedia.org/wiki/Cross-validation_%28statistics%29 (retrieved November 2015)
- The Wikipedia page about hyperparameter optimization at https://en.wikipedia.org/wiki/Hyperparameter_optimization (retrieved November 2015)