
Execute the following steps to fit a decision tree classifier.
- Import the libraries:
from sklearn.tree import DecisionTreeClassifier, export_graphviz
from sklearn import metrics

from chapter_8_utils import performance_evaluation_report

from io import StringIO
import seaborn as sns
from ipywidgets import Image
import pydotplus
- Create an instance of the model, fit it to the training data, and create the prediction:
tree_classifier = DecisionTreeClassifier()
tree_classifier.fit(X_train_ohe, y_train)
y_pred = tree_classifier.predict(X_test_ohe)
- Evaluate the results:
LABELS = ['No Default', 'Default']
tree_perf = performance_evaluation_report(tree_classifier,
                                          X_test_ohe,
                                          y_test, labels=LABELS,
                                          show_plot=True)
Running the code results in the following plot:

- Plot the simplified decision tree:
small_tree = DecisionTreeClassifier(max_depth=3)
small_tree.fit(X_train_ohe, y_train)

tree_dot = StringIO()
export_graphviz(small_tree, feature_names=X_train_ohe.columns,
                class_names=LABELS, rounded=True,
                out_file=tree_dot,
                proportion=False, precision=2, filled=True)
tree_graph = pydotplus.graph_from_dot_data(tree_dot.getvalue())
Image(value=tree_graph.create_png())
Running the code results in the following plot:
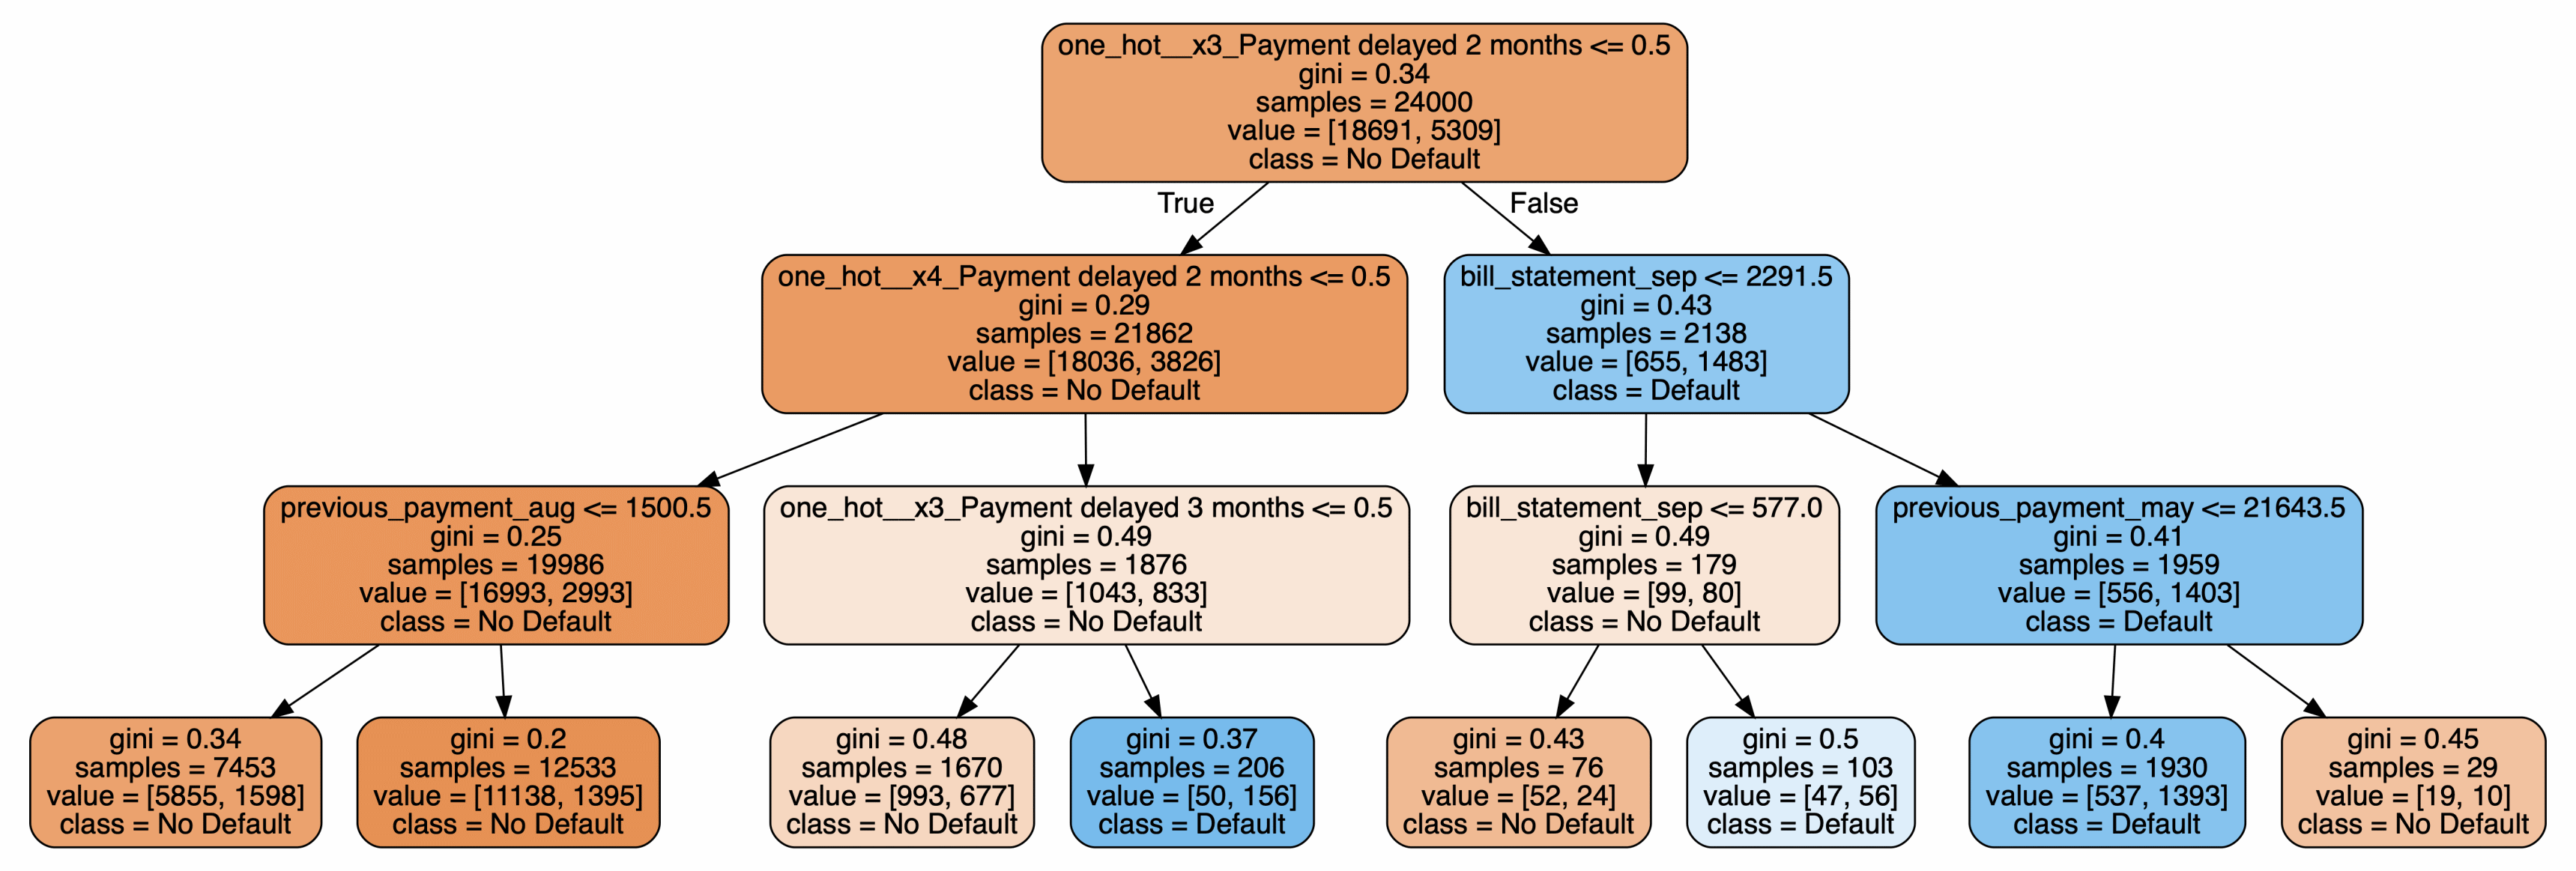
For each node, we can see the split criterion (unless it is the terminal node), the value of the Gini impurity criterion, the number of observations, a list containing the number of observations per class, and the majority class.