
Loudspeakers in Rooms
Room influences on a loudspeaker response. Radiation pattern differences and their effect on a room response. Boundary induced loading of loudspeakers. Critical distance. Room equalisation pitfalls. Minimum and non-minimum phase. Electronic room-correction considerations. Modulation transfer functions. Electronic bass-traps.
11.1 From the Studio to the Control Room
The first ten chapters of this book have considered sound, some characteristics of the ear (and hearing in general), principles of sound isolation, and acoustic control measures for performing rooms. The fundamental principles of room acoustics have also been discussed. All of these subjects come under the heading of ‘Acoustics and Psychoacoustics’ but now we must extend our discussion into the realms of electro-acoustics before continuing to look at the very controversial issue of the design of sound control rooms and monitoring systems. Moreover, where we have discussed the performance of relatively empty rooms, we also need to look at the sonic performance of rooms that contain considerable amounts of equipment. Much of this equipment, sadly, is not designed with the monitoring sound fields in mind, even though it is specifically built for use in professional sound control rooms. Such factors do not help matters.
11.2 Room Influences
In an anechoic chamber or in a true free-field situation, excellent loudspeakers may produce a frequency response which is flat within ±2 dB over their designed performance range. In general, the wider the frequency range to be covered, the more design skill is necessary to maintain these limits, which is usually reflected in the cost. To people more accustomed to working in the electronics side of audio, ±2dB would seem an absurdly wide range of tolerance for professional use, but in the realm of electro-acoustic transducers it is a tight specification. Even many microphones have difficulty in maintaining ±1 dB over just nine octaves of the audio bandwidth, let alone ten. Very flat measuring microphones which can achieve this sort of performance over ten octaves are precision instruments, made with great care, and this also usually reflects in the cost.
However, the reality is that the ± 2 dB tolerance on the loudspeaker specification seems to pale into insignificance when one considers that in the process of getting the sound out of a loudspeaker and across the room to the ears of the listener, ±10 dB would not necessarily be considered to be too bad. This does not apply to the smoothed, one-third octave responses, but to the unsmoothed responses that loudspeaker manufacturers rarely show in their literature. Figure 11.1 shows a pair of response plots for a well-known loudspeaker in an anechoic chamber. In (a) the response is unsmoothed, and in (b) it is as presented in the manufacturer’s literature. Compare these plots with Figures 11.2 (a) and (b), which show the loudspeaker in a normal room. Here it can be seen that the difference between the smoothed and unsmoothed plots is gross. To be fair to loudspeaker manufacturers, the in-room responses are not entirely their responsibility, because the rooms are so variable that there is no typical response which would be representative. However, even the anechoic responses are sometimes smoothed for marketing purposes to an extent that is questionable in terms of providing accurate and honest information.
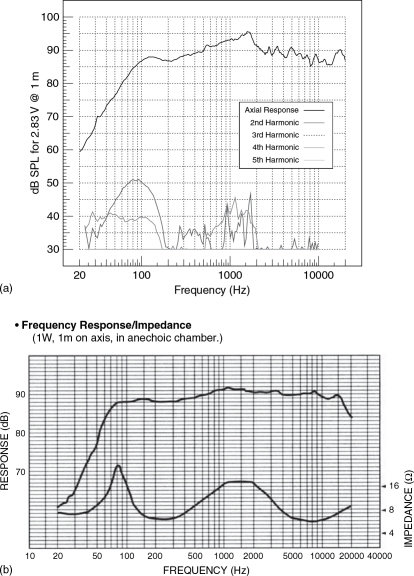
Figure 11.1 Frequency response presentations. (a) Unsmoothed anechoic response as measured in a large, reputable, acoustics research institute. Response ±5 dB, 85 Hz to 20 kHz. (b) Response of the same loudspeaker from the manufacturers’ literature, perhaps after the application of octave band smoothing. Frequency range quoted as 60 Hz–20 kHz, without specifying deviation limits. The plots suggest ±2 dB 85 Hz to 20 kHz, as opposed to the ±5 dB of the unsmoothed plot, (a). The version that relates best to what we actually hear is still a moot point
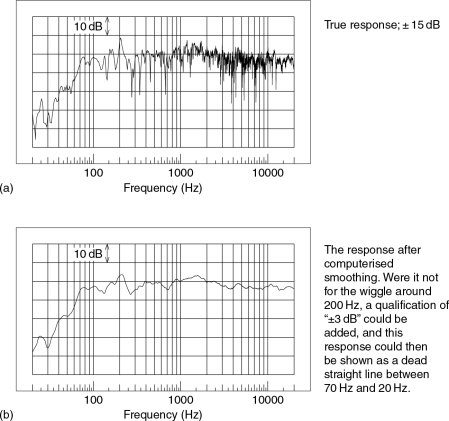
Figure 11.2 Smoothed and unsmoothed plots of loudspeakers in a normal room. (a) The pressure amplitude response of the same loudspeaker as in Figure 11.1, but this time measured at high resolution in a typical domestic room. (b) As in (a), above, but after the application of computerised response smoothing, as used by many manufacturers before publishing the plots in their brochures
Room reflexions and resonances all contribute to the overall response perceived by the listeners, but the additional acoustic loading provided by the room boundaries can cause major response changes at low frequencies. These can be in the order of up to 18 dB in the relative balance of the low and high frequencies between loudspeakers in the centre of a reasonably large room or placed on the floor in a corner of the same room. The variability in the frequency balance in different places in the room can be very great indeed. The situation is not only complicated by the nature of the radiation pattern of the loudspeaker with respect to frequency, but also the reflexion density and decay time within the room. Room resonances, and whether the source is monopole or dipole, also add their complications. Before going into detail about the individual effects, we can perhaps look briefly at them in order to get an impression of how they manifest themselves. They all form characteristic parts of a loudspeaker/room system, as it should be clear by now that the loudspeaker response, alone, does not describe what we will hear in practical circumstances.
11.2.1 Radiation Patterns
Figure 11.3 shows three polar plots of low frequency loudspeaker radiation. The first pattern (a) is that of a dipole source. This is the typical radiation pattern of a conventional woofer on a simple open baffle board. The effect is also typical of the flat electrostatic loudspeakers with open backs. When the diaphragm is driven forwards, a positive pressure is created in front of the diaphragm, and a negative pressure is created behind it. The lack of enclosure behind the loudspeaker allows the pressure to equalise, simply by travelling around the edges of the baffle. The size of the baffle board on which the loudspeaker is mounted determines the frequency below which the cancellation will be effective. For a listener directly in front of the loudspeaker the perceived frequency response will be flat (assuming a perfect source) down to the frequency where the cancellation begins due to the finite size of the baffle, below which a roll-off will begin, which will finally reach 18 dB/octave.
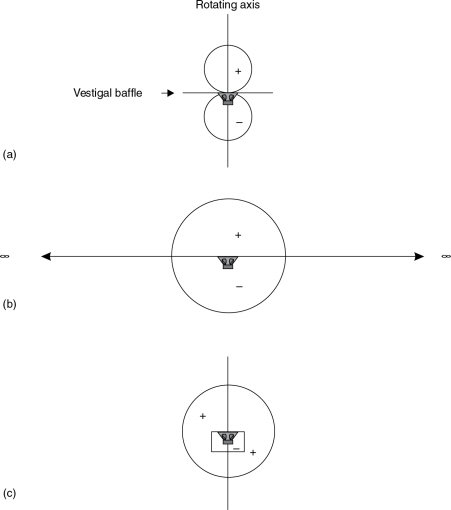
Figure 11.3 Loudspeaker radiation patterns at low frequencies. (a) Dipole source, (b) true infinite baffle, (c) monopole source (such as a sealed box)
For a listener on the extended line of the baffle, i.e. listening from side-on, the pressures radiated at the front and rear of the loudspeaker diaphragm will be equal and opposite, and hence they will cancel. This explains the null to either side of the source in Figure 11.3(a). If the baffle were to be extended to infinity in all directions of its plane, no such cancellation would exist. Hence, for the same drive conditions as shown in (a) the radiation pattern would be as shown in Figure 11.3(b). Here the areas of positive and negative pressure still exist at the front and rear of the driver, but the truly infinite baffle has prevented the cancellation from occurring around the sides. The radiation pattern becomes a sphere, with the baffle dividing the region of positive and negative pressure. [Incidentally, for non-native English-speaking readers, ‘to baffle’ means ‘to stop the progress of’. The phrase ‘I’m baffled’, is often used by people whose thought trains are not progressing, in other words they have no idea. In the case of a loudspeaker, the baffle impedes the progress of the equalisation of the pressures between the front and rear of the diaphragm.]
The term infinite baffle is often wrongly used to describe a sealed box loudspeaker. Figure 11.3(c) shows how the sealed box in fact resembles more a monopole source. A monopole source describes the radiation pattern of a small (compared with the wavelength involved) pulsating sphere. As the sphere expands, a positive pressure would be radiated in all directions and, indeed, when a loudspeaker cabinet is completely enclosed and in free space, a positive pressure in front of the diaphragm would also radiate in all directions at low frequencies, with the negative pressure being trapped inside the box as the diaphragm moved outwards.
As the frequencies rise to a point where the wavelength begins to equal the circumference of the radiating diaphragm, the radiation angle begins to narrow. This is shown diagrammatically in Figure 11.4. Here it can be seen that, at positions off-axis, the distance to the nearest and farthest points on the radiating diaphragm are such that the path length difference to the listening position becomes out of step by half a wavelength, and hence the radiation from these points cancel. Traditionally, when this point is approached, where the uniform forward radiating angle becomes too narrow, it has been customary to ‘cross over’ to a smaller loudspeaker, in order to avoid the forward ‘beaming’ of high frequencies. In most full range loudspeaker designs there is a gradual narrowing of the response towards the mid frequencies, and then, by means of selecting drivers of the appropriate source sizes, that response angle would be maintained until the highest frequencies. The typical radiation pattern of a conventional box loudspeaker is shown in Figure 11.5. The response pattern shown in the above figure is typical of by far the majority of loudspeakers designed for use in recording studios.
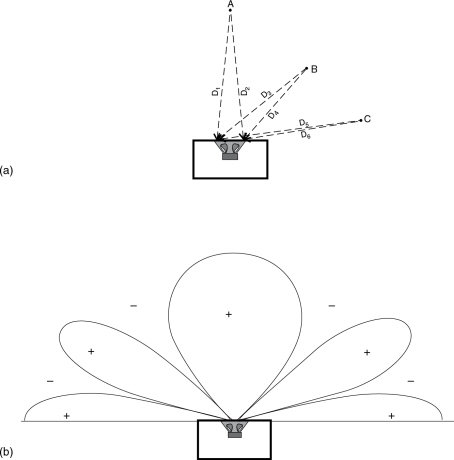
Figure 11.4 Radiation from a sealed box loudspeaker. (a) At point ‘A’, distances D1 and D 2 are equal, and both are very similar to the distance from ‘A’ to the centre of the cone. The radiation from all points of the cone will therefore arrive at ‘A’ substantially in phase, and so will sum constructively. However, the distances D3 and D4, from each side of the cone to point ‘B’, are not equal, and have, in the example shown, relative lengths of 5 to 4. If we assume D 4to be 1 m, then a frequency of 2000 Hz, which has a wavelength of about 16 cm, would travel six full wavelengths from the right hand side of the cone to position ‘B’. The path length from the left hand side of the cone to point ‘B’ is 125 cm, so a 2000 Hz sound wave would travel seven and a half wavelengths, arriving at point ‘B’; half a wavelength (180°) out of phase with the wave from the right hand side of the cone, and hence would cancel. Further off-axis, at point ‘C’, the respective distances to the left and right sides of the cone are 133 cm and 1 m. The distances represent about 8 and 6 full wavelengths at 2000 Hz, which means that the waves would once again be in-phase by the time that they reached position ‘C’. This continuously varying phase relationship as one moves around the front of a loudspeaker gives rise to the typical polar pattern shown in (b). (b) Response lobing. At frequencies with wavelengths less than the diameter of the radiating surface, the + and − signs show, at a given frequency, the regions where the radiation from opposite sides of the diaphragm superpose constructively or destructively. Each frequency will have its own particular pattern. [See Figures 11.22 and 14.3]. For this reason, it is customary to cross over to a smaller drive unit before the frequency reaches the point where the wavelength approximates to the radiating diameter of the diaphragm
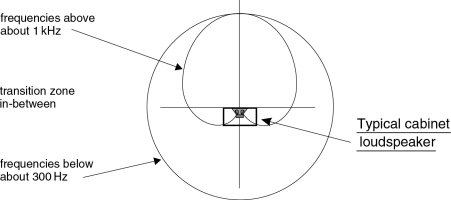
Figure 11.5 Directivity versus frequency
11.2.2 Loading by Boundaries
If we were to take a loudspeaker such as the one represented in Figure 11.5, and take it towards a room boundary, the effect at low frequencies would be as shown in Figure 11.6. The radiation pattern shown dotted is the reflected wave from the boundary. If the boundary were of a rigid, massive, highly reflective material, the reflected wave would be the same in all respects, except direction, as the section of the wave would have been had it been able to expand without the boundary (shown dashed). The main difference in the response at the loudspeaker is due to the fact that the reflected energy will superimpose itself on the direct energy instead of being lost by expansion. At low frequencies, where the distance from the loudspeaker to the wall is small compared with the wavelength, the reflected pressure will sum with the direct pressure. As the frequencies rise, however, frequencies will be reached where the reflected pressure arrives back at the radiating diaphragm out of phase with the source, and the pressures will then cancel. At even higher frequencies, the direct and reflective waves will go through regions of summation and cancellation as the wavelengths vary. The effect will be comb filtering of the response, as shown in Figure 11.7, so called because on a linear frequency scale the effect looks like a comb with many teeth.
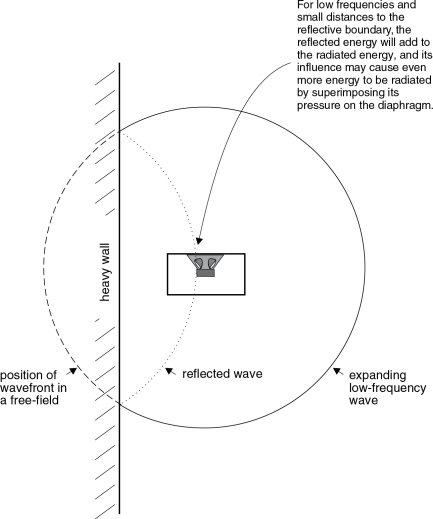
Figure 11.6 Reflective loading on a diaphragm
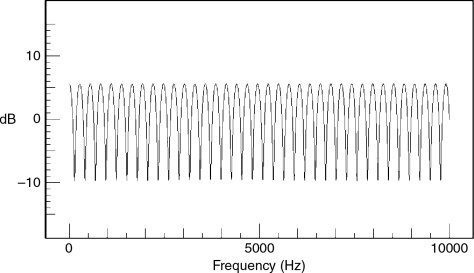
Figure 11.7 Comb filtering. The result of the superposition of the reflexion on the direct signal, as shown in Figure 11.6, will give rise to a frequency response as shown here, which plotted on a linear frequency scale clearly shows the origin of the term comb filtering
When we place a monopole loudspeaker as shown in Figure 11.6, the logarithmically scaled response will tend to look like the plot in Figure 11.8. At higher frequencies, the response is dependent upon the receiving position as well as the source position. At low frequencies, where the response is not dependent upon the receiving position, the effect would be a general boost in the pressure response. Every position for the source and reception points thus has its own individual response. In order to give some idea of the magnitude of the effects, Figures 11.9 and 11.10 show the way in which the received response of a loudspeaker can vary, solely according to where it is positioned within a room.
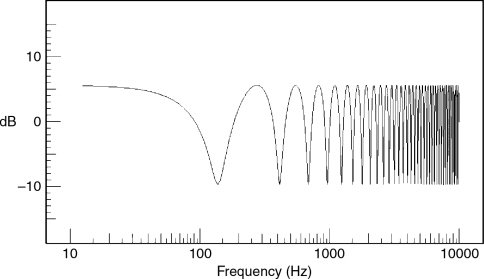
Figure 11.8 The same response as in Figure 11.7, but here plotted on a more conventional logarithmic frequency scale. This relates better to how we perceive the effect, but for analytical purposes it does not show the periodicity of the effect as clearly as the linear plot in Figure 11.7
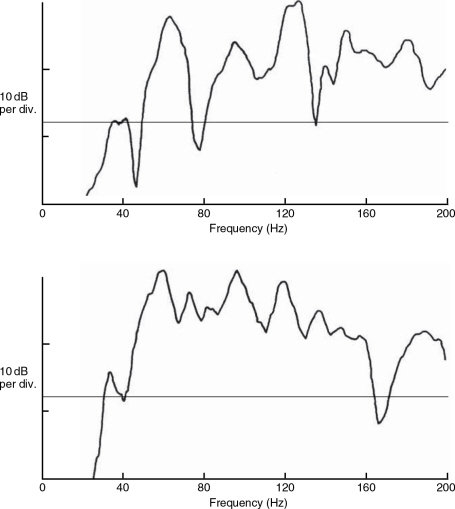
Figure 11.9 Low frequency response plots of one loudspeaker in one control room but in two different positions
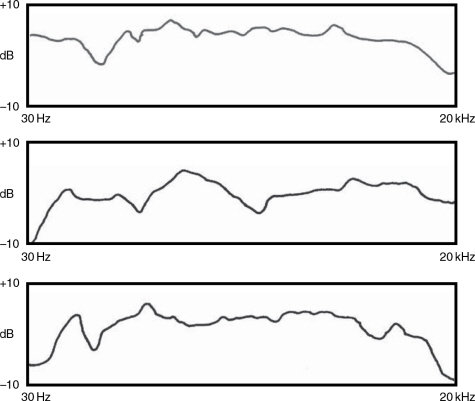
Figure 11.10 Response of one loudspeaker at three different locations in the same room. Differences are entirely due to room position
There is also another mechanism at work, besides the simple reflected superposition of the pressure waves. There is mutual coupling between the reflected surfaces and the radiating surfaces. When the reflected wave returns in-phase to the radiating diaphragm, it imposes a greater pressure on the diaphragm than would exist due to the ambient air pressure alone. The increased pressure gives the diaphragm more to push against, and so more work is done, which results in more acoustic power being radiated by the diaphragm. A conventional electro-magnetic, cone loudspeaker is a very inefficient device, largely because it is a volume-velocity source whose mass is great in respect to that of the local air upon which it is acting. Its velocity tends to be controlled by its own mass, and hence the volume of air that it moves is largely independent of the air pressure resisting its movement. Therefore if the air pressure on the face of the diaphragm is increased, the diaphragm speed will be unaffected. As the diaphragm becomes more heavily loaded it can exert more force on the air, consequently doing more work and radiating more power. The mutual coupling and the in-phase superposition of reflected pressures act together in the positive and negative senses. Pressure increases and decreases will both be augmented.
Figures 11.11–11.14 show the effect of the reflexions on the radiated sound power of a non-directional monopole source when placed near three mutually perpendicular boundaries in a room, i.e. close to a corner. In each case, the output in free space would be the 0 dB level. From these figures, it can be seen that the reflective loading effects of the room boundaries are enormous. Figures 11.15–11.18 show the effects on a dipole source, and it can be seen that the effects on the two types of sources are very different. The figures highlight clearly the consequences of the positioning of loudspeakers within rooms. This is the principal reason why loudspeaker manufacturers tend to publish only the free-field response, because what rooms can do to modify it is simply too variable for any general representation of an in-room response to be meaningful.
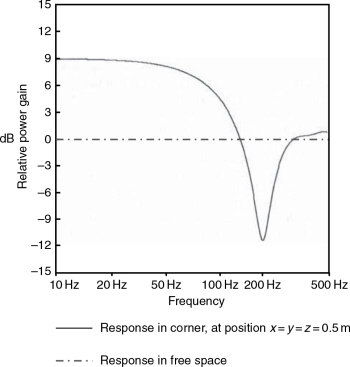
Figure 11.11 The sound power output of a non-directional sound source placed near three mutually perpendicular room boundaries, relative to the power output in free space, shown dashed. The source is positioned 0.5 m away from each boundary (x = y = z = 0.5 m)
The mirrored room analogy from Figure 4.5 also still holds true, because loudspeaker diaphragms mutually interfere in the same way that reflexions interact with diaphragms, and vice versa. We could place real loudspeakers at the image positions and the same response variations shown in Figures 11.11–11.18 would be exhibited. We could reduce the effect of the interference by turning down the drive signal to the image loudspeakers. If we turned them off, the loading effect would disappear. Acoustically we can simulate this by making the boundaries absorbent. In the 99.99% absorption of an anechoic chamber, the ‘image loudspeakers’ (the reflexions) would be turned down by 40 dB relative to the principle loudspeaker. [99.99% absorption means only 0.01% reflected energy; 0.01% = 1 part in 10,000 = −40 dB.] The single loudspeaker response would then return to what it would be in free-field conditions.
If the boundary has an absorption coefficient of 0.5, then half the energy would be reflected, which would equate to turning down all the image loudspeakers by 3 dB. Unfortunately, as can be seen from Table 4.1, the absorbent materials in normal rooms do not absorb uniformly with frequency. Therefore, all our ideal response modifications shown in Figures 11.11–11.18, which asymmetric placement presumed a set of reflexions from perfectly reflective walls (absorption coefficient 0 at all frequencies), would be further modified in real life due to the frequency dependent absorption by the boundaries. This could still be represented in the mirrored room analogy by not only providing the image loudspeakers with level controls, but also with equalisers. This concept is useful in that it helps many people visualise the complexity of the reflective coupling.
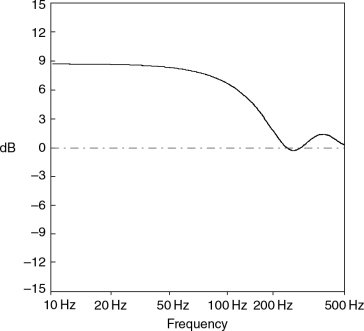
Figure 11.12 The sound power output relative to free-space loading, as for Figure 11.11, but for (x = 0.5, y = 0.35, z = 0.15 m)
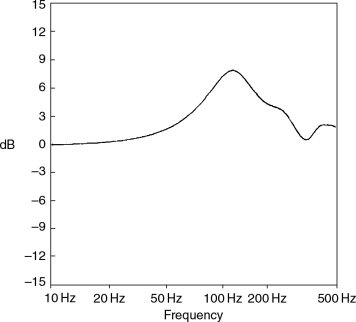
Figure 11.13 The power gain (the difference) obtained by moving a non-directional source from one position (x = 1, y = 0.7, z = 0.3 m) to a second position nearer the corner (x = 0.33,y = 0.23, z = 0.1 m). The increase in radiated power around 100 Hz is almost 9 dB
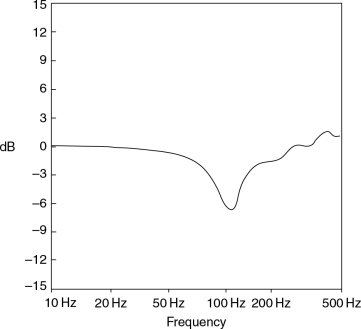
Figure 11.14 The power gain (the difference) obtained by raising a non-directional source from one position (x = 1, y = 0.7, z = 0.3 m) to a second position 0.5 m higher (x = 1, y = 0.7,
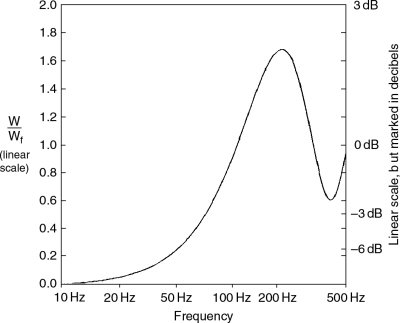
Figure 11.15 Sound power output relative to free-space loading of a dipole sound source with z = 0.8 m). Here there is a clear reduction in the radiated power around 100 Hz, although there is a slight increase around 400 Hz
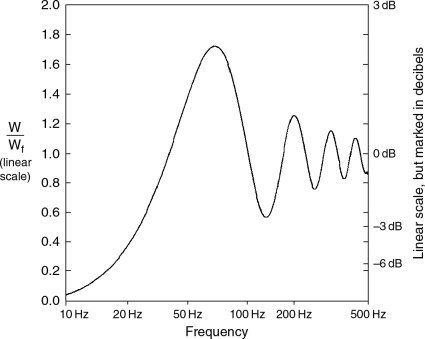
Figure 11.16 Sound power output relative to free-space loading of a dipole sound source with baffle parallel to a single solid boundary. Distance from boundary 0.5 m baffle parallel to a single solid boundary. Distance from boundary 1.5 m
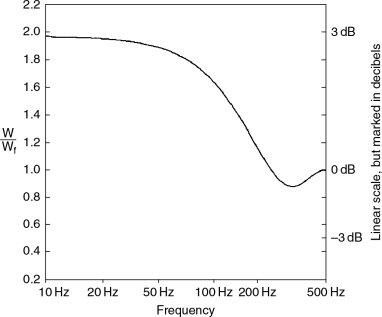
Figure 11.17 Sound power output relative to free-space loading of a dipole sound source with baffle placed at right angles to a single solid boundary. Distance from boundary 0.5 m
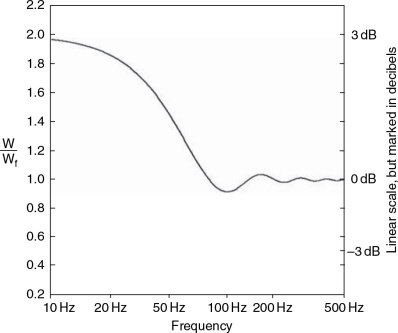
Figure 11.18 Sound power output relative to free-space loading of a dipole sound source with baffle placed at right angles to a single solid boundary. Distance from boundary 1.5 m. (For further study, see chapter by Adams in Loudspeaker and Headphone Handbook – details given in the Bibliography at the end of this chapter.)
11.2.3 Dipole Considerations
A comparison of the monopole response plots shown in Figures 11.11–11.14 with the dipole source plots in Figures 11.15–11.18 should make it evident that the two types of radiating sources behave very differently in rooms. Even though the on-axis anechoic responses may be virtually identical, the presence of boundaries affects their responses in very different ways, and the fact becomes even more pronounced when the loudspeakers are used in the stereo pairs.
Most stereo programme material has the majority of its low frequency content distributed within the mixes as central phantom images. Two monopole sources (such as most cabinet loudspeakers) radiate the low frequencies in all available directions. For relatively steady state signals, a standing wave pattern is produced by the interference field (see Glossary) and the two separate sources are very effective in exciting many, if not most, of the room modes to varying degrees.
By contrast, the bi-directional, figure-of-eight radiation patterns of the dipole loudspeakers principally tend to excite modes in the front/back axis only. They also excite the modes most strongly when they are on the velocity anti-nodes (the pressure nodes), which is the exact opposite of monopole source behaviour, because they are pressure-gradient sources, not volume-velocity sources. The modal excitation pattern is thus very different for the two types of radiation, and not least because the electrostatic dipole loudspeakers, with very light diaphragms, also tend towards being true pressure sources, whose output is independent of the pressure load on the diaphragm. Any increased work done by the extra loading (pressure on the diaphragm) will be offset by the resulting reduction in diaphragm displacement.
A further aspect of dipole radiation is that because in almost all practical cases the loudspeakers present their side-nulls towards the other loudspeaker in a pair, virtually no radiation from one loudspeaker can impinge directly upon the diaphragm of the other. Mutual coupling, the mechanism by which multiple drivers mutually boost each other’s output (see Chapter 14 and Glossary), can therefore only take place via the less energetic reflective pathways. The far-field response of dipoles, as compared to monopoles (in any given, typical room), therefore tends to be characterised by less modal density, but stronger excitement of some of the modes that are energised. Furthermore, except in central positions some distance in front of the loudspeakers, the mutual coupling boost at the lower frequencies, which is characteristic of monopole sources when radiating coherent signals, will be absent from the combined output of the dipole pair. This can lead to less low frequency content in the ambient response of the rooms.
These factors together, plus the fact that the dipole sources cannot drive a pressure zone (see Section 13.5) no doubt contribute greatly to the oft-held belief that many electrostatic loudspeakers, most of which are dipoles, have a tendency to be bass light, even when the individual on-axis anechoic responses compare quite closely with many monopole sources. It can therefore be concluded that great care must be taken in the siting of dipole loudspeakers with regard to any room boundaries, and the modal distribution within a room if a relatively uniform response is to be produced at the listening position. In fact, these considerations may well dictate the listening position.
11.2.4 Diffraction Sources
Figure 4.35 showed the diffraction effects due to obstructions, and spaces in obstructions, on sound propagation. Figure 11.19 shows the diffraction caused by the edges of loudspeaker cabinets. Effectively what happens is that the expanding radiated wave travels along the front surface of the loudspeaker cabinet until it arrives at a discontinuity, such as the cabinet edge. From this point on it suddenly has to expand more rapidly around the corner, but the same pressure cannot be sustained in the new, larger volume into which it expands. This sudden increase in expansion rate is due to a change in acoustic impedance, and any change in impedance will send back a reflected wave. (If there is a sudden pressure change at any point, then sound will radiate from that point. After all, a point source, or a tiny loudspeaker, is radiating power solely by virtue of the pressure changes that it creates.) The radiation that turns the corner is in-phase with the source, but the reflected wave, due to the sudden drop in pressure (as the wave reaches the corner it is free to expand more easily as it is less restrained), radiates back to the source out of phase. This gives the effect of a spherical type of wave expansion that appears to emanate from the corner discontinuity, giving the effect to the listener as shown in Figure 11.20. The total effect may be considered as though the loudspeaker were in an infinite baffle, but with additional sources mounted at the positions of the cabinet edges.
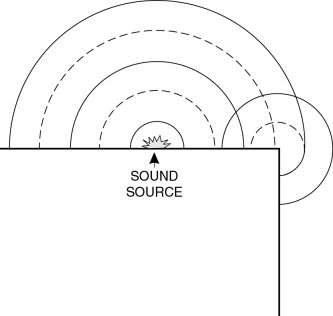
Figure 11.19 Diffraction sources. Representation of the sudden increase in the rate of expansion of a wavefront at a sharp edge. The diffracted wave in the region round the corner from the sound source has the same phase as the incident wave on the edge, but the diffracted wave, travelling back from the edge towards the source, is phase-reversed
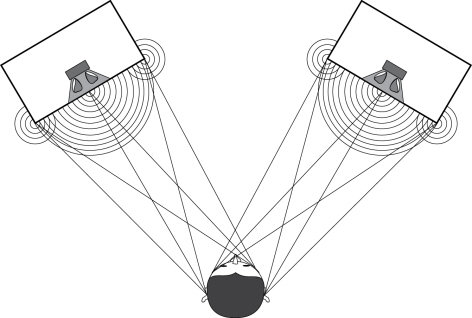
Figure 11.20 Cabinet diffraction. The sharp edges of loudspeaker boxes, mixing console meter bridges, and any other abrupt cross-sectional changes between the loudspeakers and the listener will form secondary diffraction sources that can smear the stereo imaging. It is to help to avoid this problem that many loudspeaker cabinets have rounded or bevelled edges
Objects in any room in which a loudspeaker may be positioned, and especially objects close to a loudspeaker, such as the mixing consoles on which they may be mounted, can all act as diffraction sources, disturbing in yet another way the free-field response of a loudspeaker. See also Section 4.8.
11.3 Room Reverberation and the Critical Distance
True reverberation exists as a diffuse sound field, with equal energy being present at any one time in any equal volume anywhere in the room. However, modal resonances, the juxtaposition of different surfaces, and the net energy flow away from the source ensure that in recording studio control rooms such a spacially diffuse sound field never exists. Nevertheless, especially in some control room designs, a reasonably diffuse decay field does normally exist, which means that after a sound is emitted by the loudspeakers, a quasireverberant sound field will develop in the room. There will therefore, at any time except immediately after a silence, be a mixture of the direct sound from the loudspeaker and the reflected sound field from the boundaries. In a large reverberant space, with a loudspeaker at one end and a listener at the other, the direct sound field will reduce by 6 dB for every doubling of distance from the source, whereas the reverberant field will be relatively uniform in all parts. Where the listener stands, the reverberant sound field may be 20 dB or more above the direct sound field, and the room response would clearly be the dominant source. This is shown diagrammatically in Figure 11.21, which shows that as one moves away from a sound source, in non-anechoic conditions, one will gradually leave the domain of the direct field and enter that of the reverberant field. The point where the two sound fields are equal is known as the critical distance, beyond which the level of the sound will soon tend not to reduce any farther as one moves away from the source.
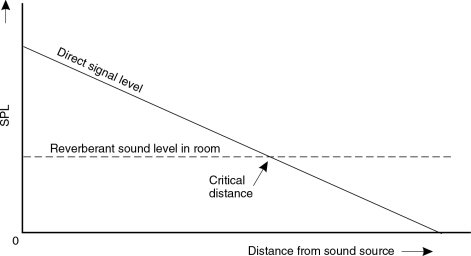
Figure 11.21 The critical distance concept. In a room, the direct sound decays with the distance from the source, but the reverberation level in the room is, by definition, evenly distributed. The critical distance is that at which the falling direct signal level (as one moves away from the source) reduces to such a level that it is equal to the reverberant level. At less than the critical distance, a listener is predominantly in the direct field, whereas beyond the critical distance, the reverberant field predominates
Figure 11.5 shows that the low frequencies tend to radiate omni-directionally, whereas the high frequencies are more directional, and principally travel forward from the source. The significance of this on the critical distance is that the low frequencies will strike more boundaries more rapidly, and hence they will drive the reverberant field more powerfully than the more directional high frequencies. The result is that the critical distance will be frequency dependent, and so the effect of moving away from the source will not be perceived equally at all frequencies. In fact, the critical distance is dependent only upon the room constant (R) and the directivity of the loudspeaker (Q). The room constant is given by:
|
(11.1) |
where S is the surface area of the room (m2) and α is the average absorption coefficient of the surfaces.
The Q is effectively given by dividing the area of a sphere by that portion of the area that is illuminated (insonified) in the direct field of the loudspeaker. The directivity index (DI) is the ratio in decibels of the sound pressure radiated along the forward axis of the loudspeaker, compared to the sound pressure that would exist at the same position if the equivalent sound energy were to be radiated omni-directionally. Consequently, for omni-directional low frequency radiation, the directivity index and the Q are both 1.
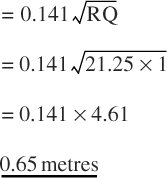
In a typical domestic room with a surface area of 85 m2, plaster walls and a moderate degree of furnishing, the average absorption coefficient could be about 0.2. In such a room, and with an omni-directional source, the critical distance can be given by the formula:
|
(11.2) |
The omni-directional loudspeaker has a directivity of 1, and the term R can be found from Equation 11.1:
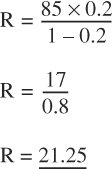
Therefore, the critical distance for the low frequencies in the room under discussion would be
|
(given in equation 11.2) |
If the directivity of the high frequencies was around 10, as would be the case for a pattern typically as shown in Figure 11.5, the critical distance (r) would be:
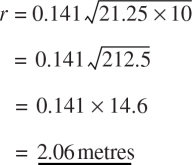
Figure 11.22 shows the increasing directivity-with-frequency from a typical piston radiator (such as a conventional cone loudspeaker). If these plots were spun round in the axis which runs through the page from top to bottom, one can imagine the spherical space and the proportion of the whole sphere taken by the reducing areas (or volumes if three-dimensional) within the directivity fields. One can imagine how the insonified volume in Figure 11.22(f) would occupy less than one-tenth of the solid sphere. Hence, less than one-tenth of the power would be needed to fill this space with a given quantity of sound, as opposed to that which would be needed to fill the entire sphere. It requires twice the power either to double the sound intensity over a given area, or to supply the same sound intensity over twice the area. It thus follows that it requires ten times the power (+10 dB) to maintain the same sound intensity over ten times the area, as is more or less the case under discussion here.
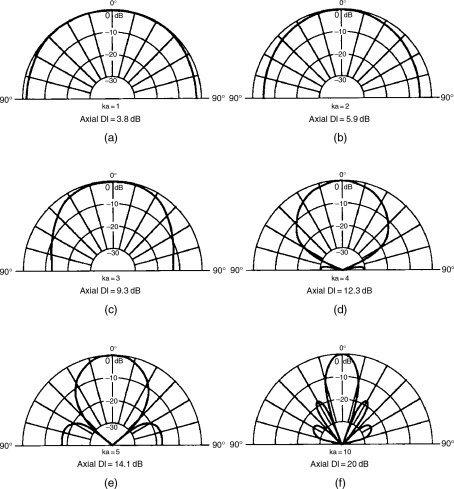
Figure 11.22 Directional response of a piston mounted in a large baffle. It can be seen that the directivity increases (the radiation angle decreases) with frequency. The effect of specific diaphragm sizes and frequencies can be calculated from the ka figure, where
A room of 5 m × 4 m × 2.5 m would have a surface area of 85 m2, which was the figure used in our previous calculations. As counter-intuitive as it may seem, the fact is that in such a room, with an absorption coefficient of 0.2, the room response will begin to dominate the overall low frequency response at listening distances greater than only 65 cm from the loudspeaker. At high frequencies, the distance would be 2 m, or thereabouts, with the loudspeakers described, but such is the case in many typical domestic listening rooms (and bad control rooms).
11.4 Sound Power Radiation
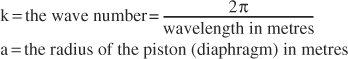
Figure 11.23 shows the on-axis pressure amplitude response (frequency response) of a loudspeaker in an anechoic chamber. Figure 11.24 shows the same loudspeaker response measured in a reverberation chamber, which integrates the total power output. The difference between the plots shows how more power is required in order to maintain a flat on-axis response with reducing directivity as the frequency lowers. In Figure 11.24, it is clear that about 10 times the power (10 dB more) is being radiated around 100 Hz compared to around 2 kHz, despite the fact that the on-axis levels are equal in Figure 11.23. This also means that more power is available to excite a room at low frequencies from this typical loudspeaker source, which gives rise to the shorter critical distance at low frequencies, as described in the previous paragraph.
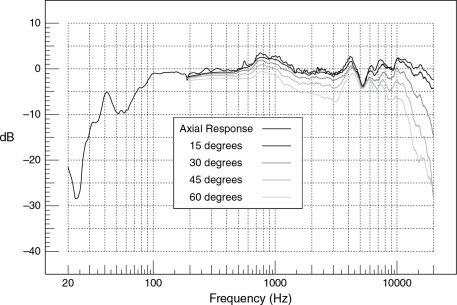
Figure 11.23 Axial and off-axis responses of a loudspeaker in an anechoic chamber
Figure 11.24 Total power response of the same loudspeaker as in Figure 11.23, but made in the reverberation chamber at the ISVR
In domestic circumstances, we often cannot (or at least we do not find it socially desirable to) exercise very much control over the acoustics of domestic living/listening rooms. We must therefore juggle with the things that we can easily change, and loudspeaker directivity is one of those things. In circumstances where reflective side walls are unavoidable, narrower high frequency directivity can help to avoid too many high frequency reflexions. This can help to maintain more detail in the sound by beaming more high frequencies directly at the listener. However, there would be a tendency for the reverberation to have a ‘dark’ character, because it would predominantly be driven by the greater amount of omni-directional low frequency energy. A loudspeaker that was omni-directional at all frequencies, such as some models by Canon and Bose, in a room with a relatively uniform reverberation time with frequency, would give a more ‘correctly’ balanced direct and reverberant response. However, the critical distance would be very short at all frequencies, and hence the more confused room sound could tend to mask much detail in the direct sound, which it would tend to swamp.
In an anechoic chamber there would be little difference on-axis between a flat response from a varying directivity loudspeaker or an omni-directional loudspeaker, except that the latter would need to radiate much more power at high frequencies because much of it would be uselessly radiating in unnecessary directions to no effect.
Many domestic loudspeakers have what would in professional use be considered an excessive amount of on-axis high frequencies. They are often designed this way specifically because many domestic situations have a large amount of soft furnishings that absorb the high frequencies much more than the low frequencies. The bright treble response is intended to help to counterbalance the darker, low-frequency-dominant reverberation in the room, but for serious listening such systems can be tiring. Nevertheless, the enormously wide ranges of loudspeakers that are available for domestic use are not only the result of marketing battles. They are necessarily available because of the even greater range of domestic acoustic conditions. When wishing to listen purely for pleasure, many people tend to choose a loudspeaker in a hi-fi showroom, which is often very different to their home listening conditions. This is the reason for the common complaint that the loudspeakers were disappointing when the customers took them home. Clearly, if the room response is so dominant, the ‘best fit’ to the acoustic conditions in the showroom may well not be the best fit in another room. The positioning within the room also plays a big part in this; for example, when the loudspeaker sounded well balanced in its position in the centre of a wall in the showroom, but bass heavy when placed in a corner at home. (See Figures 11.11–11.14.)
The variation in overall frequency responses and radiation patterns does allow some control over the domestic listening experience, and it is good that such choice exists. By judicious choice of both the loudspeakers and their positioning in a room, a balanced response can often be found. A bass light loudspeaker can be chosen if the only practical places for them in the home are the corners. However, if well-liked loudspeakers were moved into a new house, but were considered to be bass light in their initially chosen positions, moving them towards the corners may be able to augment the response sufficiently to restore an even overall balance. These are examples of electro-acoustic balancing. The objective of course is to deliver the desirable transfer function from the recording to the ear, and whether the bass is supplied more by the loudspeaker or the room loading is not too relevant unless other aspects of the response are upset.
11.5 Corrective Measures
Let us imagine the cellos and percussion sections of an orchestra, playing together and being auditioned via loudspeakers in a poorly controlled room. Let us also imagine that the listening position had a peak at 120 Hz due to a room resonance problem. If we were to use a ‘room’ equaliser to reduce the loudspeaker response boost at 120 Hz, at the given listening position, the effect of the resonance could be considerably reduced, and an unpleasant ‘boom’ each time the cellos were playing notes with a strong 120 Hz content would be removed. However, by reducing the 120 Hz region from the loudspeakers, we would also be robbing the percussion of the same frequency region. Now cellos and percussion are very different instruments. A cello tends to ‘speak’ as its response develops, so the steady state ‘continuous’ response of a listening room, as dictated by its modal activity, can be crucial for its accurate perception. By contrast, the character of a percussion instrument is largely in its attack, much of which will have died away before the room resonances fully take effect, so for percussion the direct signal from the loudspeaker will be of greatest importance. If the direct signal from the loudspeaker is altered, the whole character of a percussive instrument may be degraded. We thus, in this one instance alone, have conflicting interests with respect to the ‘correction’ of the room/loudspeaker combination, dependent upon the nature of the instruments.
The problem does not stop there, though. As air at room temperature has a speed of sound of around 344 m per second, 120 Hz will have a wavelength of 344 divided by 120, or just under three metres. The half wavelength would therefore be about 1.5 m. So if the listeners in our above room moved 1.5 m, in either direction, along the axis of the mode which caused the cellos to boom (away from the area producing the 120 Hz resonance peak at the anti-node), they would move from an anti-nodal region into a nodal region. The nodal region would exhibit a 120 Hz dip, which would be exaggerated by the reduction of 120 Hz in the equaliser feeding the signal to the loudspeakers. The cellos and percussion would both have had their 120 Hz content reduced in their loudspeaker drive signals, and from the new listening position, neither would receive any support from the room resonance. Whilst it could be argued that the equalisation had improved the response of the cellos at the previous position, albeit to the detriment of the percussion, neither of the instruments would benefit from the equalisation at the new position. In fact, both would have been degraded by the equalisation. From this it can be understood how room response ‘correction’ by equalisation of the drive signal to the monitor loudspeakers is both very position dependent and instrument dependent. Transient and steady state signals do not respond similarly.
Let us now consider the low frequency response boost created by placing the loudspeakers close to a wall, where we will observe a very different set of circumstances. There will be a boost which is a function of the room positioning creating a greater load on the diaphragm, and hence producing more power output from the loudspeaker. This response alteration is virtually instantaneous, and is equal for all places in the room. That is, if 100 Hz is 3 dB above 200 Hz at the loudspeaker, then for the direct signal it will also be 3 dB above at all places in the room. The loading effect would boost the cellos and percussion in identical manners, in their transient and steady state components, and would have the same relative effect in the drive to any reflexions and resonances in the room. Correction by equalisation of the drive signal will therefore tend to correct simultaneously all the response changes caused by the proximity of the wall. In this case, equalisation of the drive signal would be perfectly appropriate, though such equalisation in professional use is usually carried out by means of fixed filters, and not by any sonically questionable graphic equalisers. The above is thus a very different state of affairs from a situation where the response errors are created by complex reflexions and room resonances.
The general rules for the use of loudspeaker/room equalisation is that when a room affects the response of a loudspeaker directly, such as by loading the diaphragm, then corrective equalisation can be used. When the effect of a room is indirect, such as by the superposition of reflexions and resonances on to the direct signal, then equalisation will not tend to be corrective in any overall manner, and will be as likely to create as many response disturbances as it solves. The two situations are minimum phase, and non-minimum phase, respectively.
11.5.1 Minimum and Non-Minimum Phase
A response modification such as the low frequency boost experienced when mounting a loudspeaker close to a wall is a modification which takes place more or less simultaneously with the propagation of the sound waves from the source. In the case of flush mounted loudspeakers, the wall provides a block to the low frequency radiation that otherwise tends to be omni-directional, and reflects the sound pressure back towards the source. If the pressure wave cannot travel behind the loudspeaker, all the pressure is concentrated in the forward direction, so the normal forward propagation is augmented by the would-be rear radiation. What is more, the constrained radiating space restricts the ability of the air to move out of the way of the diaphragm movements. This increases the load on the diaphragm, which in turn increases the work done, and thus increases the radiated power as compared to free-space radiation. In either case, the effect is virtually instantaneous, it is equal throughout the space into which it radiates, and it can be considered a part of the actual loudspeaker response in those given conditions. A response modification of this nature is minimum-phase.
Alternatively, a non-minimum phase response modification would be produced by the multiple reflexions from room boundaries superimposing themselves upon the direct sound from a loudspeaker. In such cases, every different listening position would also receive a different balance of direct sound and reflexions from each boundary, and no causal filter (see Glossary if necessary) could correct the complex, spacially dependent response irregularities by equalising the loudspeaker response. Each frequency at each position would also exhibit a different phase relationship to the direct signal, as shown in Figure 11.25, and so they could not be generally equalised.
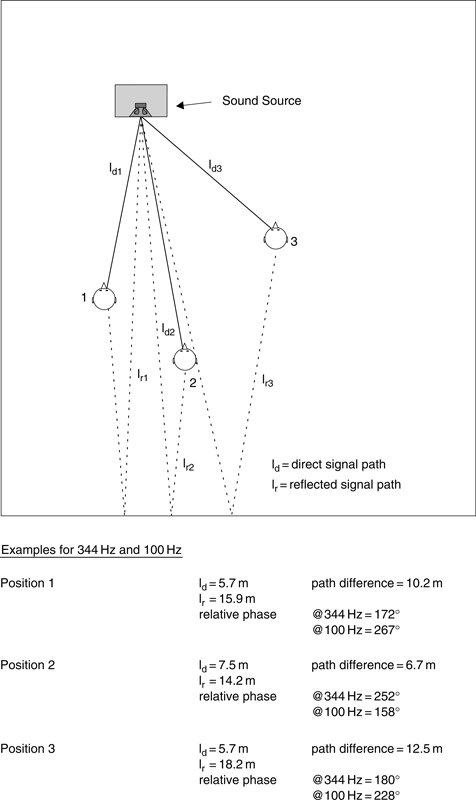
Figure 11.25 Position dependent phase relationship of direct and reflected waves
An important point to get across is that the term ‘minimum phase’ is a mathematical one, relating to how the amplitude and phase responses track each other. It has no relevance to the absolute quantity of a phase change. Essentially, a minimum phase response is one where every change in the amplitude response has a corresponding change in the phase response, and vice versa. When the restoration to flatness of either response does not restore the other, the response is said to be ‘non-minimum phase’, and cannot be corrected by a causal inverse filter. The degree of non-minimum phase deviation is known as ‘excess phase’, and excess tends to build up with the summation of many types of time-shifted signals, which even occur in the re-combination of most crossover filters. We will meet this again in Section 20.6.
Figure 11.26 shows a typical response modification from a minimum phase low frequency boost caused by the flush mounting of a loudspeaker. The relative response of frequencies x and 2x will be the same throughout the room, and so can be corrected by equalisation of the loudspeaker drive signal. Figure 11.27 on the other hand, shows the response of a non-minimum phase effect, where the relative responses of frequencies x and 2x are different at each position. Clearly, if they are different at each listening position, they cannot be universally corrected by equalisation of the loudspeaker drive signal. In fact, the disturbance caused by a single reflexion can be of a minimum phase nature, as the effect is somewhat dependent on the relative levels of the direct and reflected waves. However, if the reflected level exceeds the direct level, as can occur in some frequency bands with front wall reflexions from a rear surround loudspeaker, or when multiple reflexions are involved, the ‘excess phase’ builds up, and the overall response rapidly tends towards being non-minimum phase, and hence not correctable by conventional equalisation.
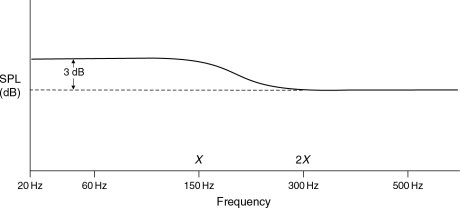
Figure 11.26 Example of a minimum phase effect, such as flush mounting a loudspeaker. Typical boost in output to be expected at low frequencies when a loudspeaker designed for free-standing is flush-mounted. The dotted line indicates the low frequency output when free-standing. For the direct output from the flush-mounted loudspeaker, at any position, frequency 2x is 3 dB down on frequency x. Equalising them to the same level at the loudspeaker will therefore correct the direct response at all positions in the room
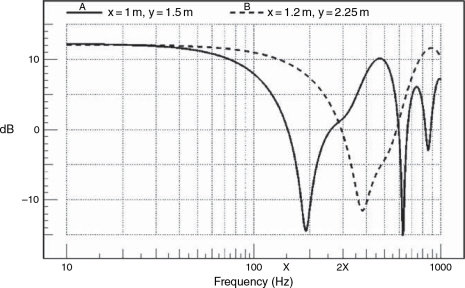
Figure 11.27 Example of a non-minimum phase effect, such as created by boundary reflexions. Measured response at two different microphone positions in a reflective room. The drive signal from the loudspeaker had a flat response. Frequencies x and 2x vary in relative level at each position in the room. At positions ‘A’ and ‘B’, the resultant total response is different, therefore loudspeaker equalisation cannot correct the response at anything other than one point. It cannot correct the response at both points simultaneously
Two other observations can be made from Figures 11.26 and 11.27. The minimum-phase effect in Figure 11.26 can be modelled by a relatively simple analogue equalisation circuit, the inverse of which can produce a mirror image of the amplitude and phase characteristics of the disturbed response. Such circuits can readily be used to return the transfer function to its original response (i.e., in this case, as it was before the wall-mounting boost was superimposed upon the free-field response). However, the response of Figure 11.27 is very difficult to mirror with analogue filters, and anyhow, as the problem is non-minimum phase (the result of time-shifted superposition) even perfect amplitude correction could not restore the original phase response by any known practical analogue means. Only by digital signal processing could an almost perfect response be restored. Attempts to ‘correct’ such responses by the use of one-third octave filters would perhaps create a slightly better overall amplitude response, but such quasi-restoration would inevitably produce phase absurdities. Any such phase anomalies contrive to distort the time response, which can lead to conflicts in the steady state and transient responses of a loudspeaker/room combination. It is in this area where typical third-octave equalisation of monitors fails badly. It is the lack of understanding of these general concepts that leads people to misapply ‘room’ equalisers, then wonder why the results are not satisfactory.
11.5.2 Digital Correction Techniques
We have, until now, been referring to correction by analogue means; but in the digital domain we can have more control over events. Adaptive digital filtering can model, very accurately, the inverse responses necessary to correct either the minimum or non-minimum phase components of a transient or a steady state response anomaly, although these systems, too, have limits to their abilities. By means of measuring-microphones, modelling delays (to allow the implementation of acausal [i.e. effect before cause] correction filters) and adaptive filtering processes, the digital systems can be made to ‘learn’ what a given room will do to a loudspeaker response, and apply acausal corrections to cancel the disturbances. The digital filters can be adjusted to give an almost absolute correction in the amplitude, phase and time domains at one point in the room, or they can produce a less accurate correction over a wider area. However, they absolutely cannot correct to a high degree of accuracy over a large area, and in any case, all corrections in one area are gained at the expense of response deteriorations elsewhere. The confusion of the reflective field of a room is ultra-complicated, and can only be dealt with at the boundaries themselves. To attempt to correct completely these complex problems by equalisation of the loudspeaker drive signal is futile. This is why acoustic engineering is such a fundamental part of good listening room design. An example of correction by adaptive digital filtering is shown in Figure 11.28.
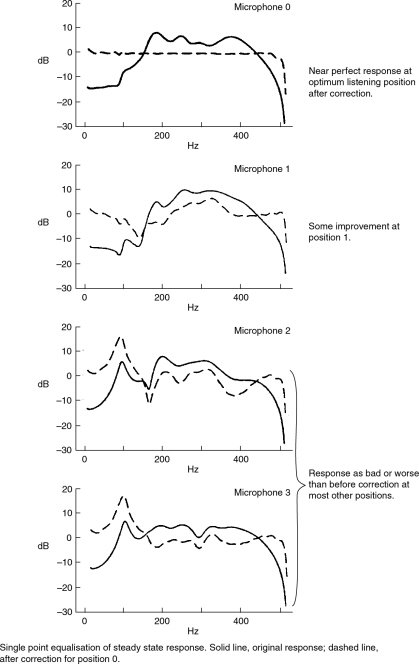
Figure 11.28 Room correction by means of digital active signal processing. At microphone position 0, the designated listening position, the correction can be made to be almost perfect. However, for other positions in the room, the response tends to be worsened as position 0 is corrected. [After Clarkson, Mourjopoulos and Hammond. JAES 33, 127–132 (1985)]
11.5.3 Related Problems in Loudspeakers
It should also be noted that there are frequently both minimum and non-minimum phase problems in the loudspeakers themselves, which are related to the room problems. The loudspeakers can have internal reflexion and resonance problems within both the cabinets and the drive units, and these non-minimum phase disturbances can lead to narrow-band response irregularities, which cannot be equalised out for the same reasons that some of the room boundary effects cannot be equalised. The summation of the outputs of multiple drive units in multi-way loudspeaker systems is a particularly common source of non-minimum phase problems, because the minimum phase summation of crossover outputs tends to be difficult due to group delays in the filters. These effects can be observed in the cepstrum responses which are described in Chapter 19. Nevertheless, as with the room response problems, the gradual boosts or roll-offs caused by the electro-mechanical characteristics of the drivers or their enclosures are of a minimum-phase nature, and can be equalised to benefit the overall response.
Any time (waveform) response can be represented by a unique combination of amplitude and phase responses (as in the Fourier Transform) so any disturbance in either of the latter responses will inevitably affect the time response, which also represents the transient response. Figure 11.29 shows an example of how a transient spike can be absolutely destroyed, solely by the manipulation of the relative phases of the component frequencies. This very clearly shows why attempts to correct responses in the amplitude domain only, whilst allowing phase responses to be further disturbed, can be disastrous to the transient response of any system to which it may be applied.
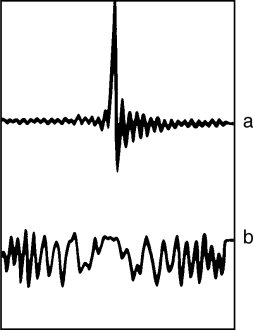
Figure 11.29 Effect of phase relationship on waveform. In the above plots, the relative levels of the component harmonics are exactly equal, only their relative phases have been changed. The effect on the waveform is gross. (After Schroeder Models of Hearing (1975) – see Bibliography)
A gradual roll-off in the high or low frequency response of a loudspeaker does not involve reflexions or response delays, but will still involve phase shifts and will consequently affect the transient response. As these are minimum phase problems, the correction of the amplitude response by electronic means will apply a phase shift in the opposite sense, and thus will tend to restore the phase and time responses to their correct values. However, to boost by 6 dB requires four times the power, so one can soon run into overload problems with equalised systems, because the overall response headroom will be lower as the flat response is extended.
11.5.4 Summary of Correct Applications of Equalisation
Corrective equalisation of a conventional form can be applied to room/loudspeaker response irregularities when those effects are of a minimum phase nature and are time and space invariant, such as loudspeaker roll-offs and rises, or room loading effects. It cannot be applied to irregularities that are the result of effects which are separated temporally or spacially from the initial event, such as reflexions or resonances. As the latter are the principal culprits in room response problems, they can only be dealt with by treatment of the rooms themselves. In such cases, the use of electrical filtering, other than of the digitally adaptive type, is a total misapplication of equalisation. The failure to appreciate this point has led to the ruination of many natural sounding loudspeaker systems in an alarming number of rooms. Equalisers cannot fix rooms; only acoustic control measures can do that.
11.5.5 The Modulation Transfer Function and its Implications for Electronic Room Correction
Since the first edition of this book was published, some manufacturers have begun to introduce monitor loudspeaker systems with built-in, electronic signal processing which is designed to improve the response in less-than-perfect rooms. Concurrently with these developments, a series of investigations has taken place using the concept of the modulation transfer function (MTF)1, 2, 3, 4, 5, 6 in an attempt to asses the limits of this type of processing. The basic concept is relatively simple to understand. A band-limited pink noise signal is modulated by a sine wave, and then passed through a loudspeaker system, or a loudspeaker system and a room, before being captured by a measurement microphone. The received signal is then compared with the transmitted signal and the accuracy of the modulation is graded on a scale from one to zero, one being identical to the transmitted signal and zero showing no resemblance whatsoever to the transmitted signal.
Figure 11.30 shows the MTF of a high definition, full-range monitor system in a control room with very heavily damped modal activity. Its MTF at distances of one metre and four metres is shown in (a) and (b). Two things are immediately noticeable: firstly, that the MTF score is generally high, even down to the lowest frequencies, and secondly that the scores at one metre and four metres are largely similar. Figure 11.31 shows the MTF scores of a small monitor loudspeaker in a recording room, much less acoustically damped than the control room of Figure 11.30. Again, two things are immediately obvious: firstly, the low frequency MTF scores fall at frequencies where the loudspeaker output cannot be maintained, and secondly that the MTF at four metres is much worse than at one metre. However, it should be noted that the MTF at low frequencies is not just a function of the pressure amplitude response (‘frequency response’) of the loudspeakers. Figure 11.32 shows the pressure amplitude and MTF responses of two loudspeakers, one a sealed box and the other a reflex enclosure with electrical protection filtering. The more accurate transient response of the sealed box enables it to exhibit a better MTF due to its more accurate signal waveform output at low frequencies. The time-smeared response of the filtered reflex enclosure, whilst maintaining the pressure amplitude response down to a lower frequency range, does so by time-distorting the signal (and thus the modulation) and therefore cannot maintain the modulation accuracy. The MTF can therefore be considered as a plot of quality against frequency, as opposed to the more normal plots of level against frequency.
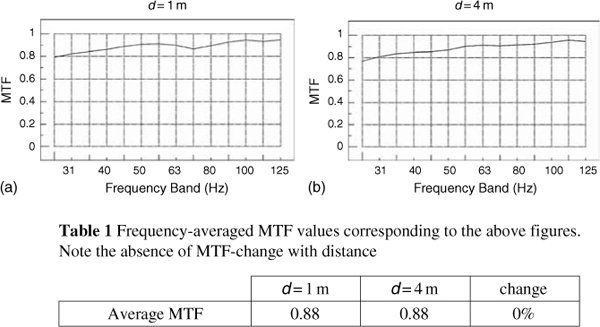
Figure 11.30 MTFs of a wide range monitor system in a very highly damped studio control room at different distances (d) from the loudspeaker
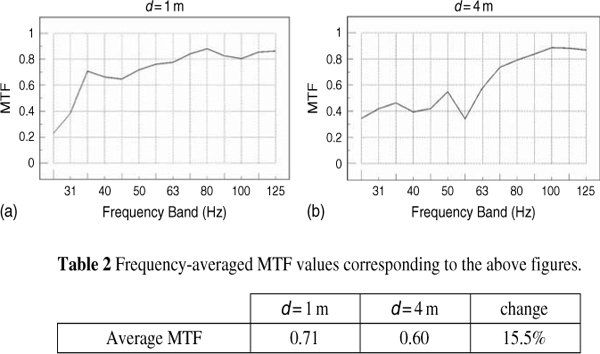
Figure 11.31 MTFs of a loudspeaker in a reasonably well damped studio recording room at different distances (d) from the loudspeaker
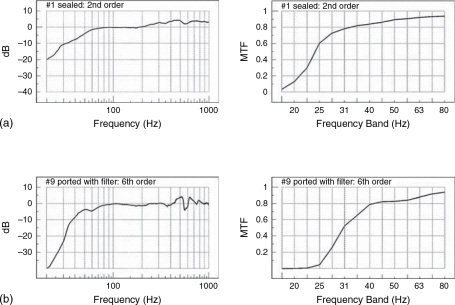
Figure 11.32 MTF Comparisons. The two frequency response plots, (the left hand plots) are generally very similar from 40 Hz to 800 Hz, but the MTF of the sealed box (a) remains high to a much lower frequency than the MTF of the filtered reflex enclosure (b), suggesting that at low frequencies the acoustic output from the sealed box is more faithful to the input signal than are the time-smeared low frequencies from the reflex enclosure
Figure 11.33 shows the MTFs of the same loudspeaker in the same room as shown in Figure 11.30. However, this time the responses have been subjected to simulated, perfect, real-time equalisation. Probably, the most noticeable aspect of these plots is that not a lot has changed when compared to Figure 11.30, other than that a few squiggles and bumps have been smoothed out. On the other hand, Figure 11.34 shows the MTF of the same loudspeaker and room asFigure 11.31, but again after simulated, perfect, real-time equalisation. In this case, two things are noticeable. Firstly, the MTF at one metre has been improved to a degree which makes it almost on par with the full-range system in the highly damped control room. The digital equalisation has worked very well indeed, although in practice the low frequency headroom would have been severely compromised by such high degrees of boost at low frequencies. By contrast, at four metres distance, the equalisation has not been able to improve the response accuracy very much because of the severity and non-minimum-phase nature of the room effects in the far field.
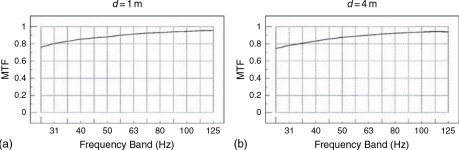
Figure 11.33 MTFs of a wide range monitor system in a very highly damped studio control room at different distances (d) from the loudspeaker, after equalisation. There is little difference from the plots shown in Figure 11.29
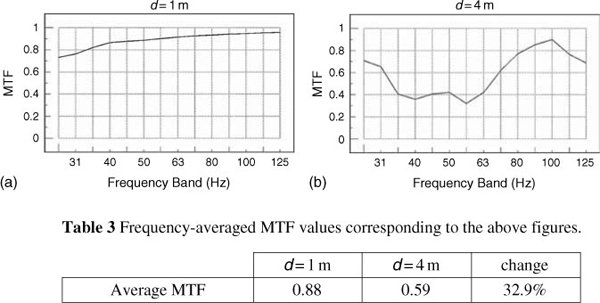
Figure 11.34 MTFs of a loudspeaker in a reasonably well damped studio recording room at different distances (d) from the loudspeaker after equalisation
The important implication here is that whilst room response correction may be possible in terms of flattening the response when measured in decibels, the flat response in the pressure domain may not necessarily mean that the response is accurately maintaining the information content of the signal. If the time response is smeared, then the information will not be accurately maintained, even despite the pressure amplitude being flat. Quantity is not the be-all and end-all.
Think of it this way: take the words ‘information content’ as an example, and think of the quantity of each letter in that term. These are, alphabetically, in what we could call the ‘alphabet response’:
a |
= |
1 |
c |
= |
1 |
e |
= |
1 |
f |
= |
1 |
i |
= |
2 |
m |
= |
1 |
n |
= |
4 |
= |
3 | |
r |
= |
1 |
t |
= |
3 |
By changing the ‘time response’ of the order of the letters we could write:
information content
infromation content
infrotmaion ontcent
infrtomaion ontecnt
frintomaoin tecontc
and so forth. The ‘alphabet response’ is the same in each case, as exactly the same numbers of each letter are used in each example, but as the time at which each letter arrives is more out of the original sequence, the information carried in the sequence of letters is gradually reduced. Whilst this is not a direct analogy, it does give some idea of the concept that the quantity of pressure that arrives at each frequency, which is what is measured by a typical ‘frequency response’ curve, may only very poorly relate to the information content which is being carried by the signal. The information in the musical signal will be degraded if the times of arrival of the relative frequencies are mixed up, even though the pressure response may be ruler-flat.
The MTF looks not only at how much pressure there is at each frequency, but by means of the modulation signal, measures the arrival times of the various components of the signal. The implication from what has been shown in the previous figures is that if equalisation is used to flatten a loudspeaker/room pressure amplitude response in the far-field, the influence of the delays and subsequent time jumbling of the room reflexions will not allow the information content to be maintained, despite the apparent ‘perfection’ of the pressure response. As can be seen from Figure 11.30, in a highly damped control room, in which reflexions have been kept to a minimum even in the far-field, the MTF is substantially maintained. Indeed, in the extreme, in an anechoic chamber, only the level would fall with distance. Whatever the MTF was at one metre would be maintained with distance.
As a consequence of the above, it would appear that electronic ‘room correction’ may well be able to flatten a frequency response curve, and at short distances, where the direct response from the loudspeaker dominates, make a general improvement to the fidelity even in a room with relatively poor acoustics. Nevertheless, in the far field, where the room response begins to dominate the direct response, quality (fidelity) losses are still to be expected. It would seem that, despite some of the claims in the publicity, room correction programs have not dispensed with the need for good room acoustic control where the highest fidelity is required over a wide and deep listening area. Nonetheless they have certainly made possible more accurate close-range monitoring in rooms of a more conventional nature, or in rooms such as television or video post-production rooms which are often sparsely treated and filled with racks of equipment which are not exactly ‘acoustic-friendly’.
Despite the fact that electronic room correction tends to be less than perfect, there do exist some means by which low frequency response problems in small rooms can be ameliorated by the use of tuneable electro-acoustic devices. Such systems can at least deal with the most troublesome modal resonances, even if they cannot achieve the overall response flatness of an acoustically controlled room. Devices such as the Bag End E-trap are essentially loudspeaker cabinets with integral amplification, microphone and processing. In the case of the E-trap, two individually tuneable frequencies can be simultaneously processed. These resonant room frequencies are then damped by the device, which is much smaller than any purely acoustic control structure which could be used for the same purpose. Where a room is not required for optimal monitoring, but work within the room is being hindered by one or two very offending resonant modes, devices such as the E-trap can be very useful indeed, especially when one considers that the size of this example is only about 45 cm × 33 cm × 25 cm. The small rooms in voice-over studios would be the sort of spaces which could benefit from such systems. Another means of electro-acoustically controlling low-frequency room modes is discussed in sub-Section 21.8.2, dealing with the application of processed multiple sub-woofers, but whereas the E-trap will work with an acoustic source, the latter will only with electrical sources.
11.6 Phase and Time
The precise effect that reflexions have on a direct signal depends upon their amplitude and phase. The reflexion amplitude is dependent upon the distance travelled and the coefficient of absorption of the boundaries. The phase is dependent upon the distance travelled, the wavelength, the absorbent or diffusive nature of the reflective surfaces, and on the angle of incidence. Hence, there are few simple ways to calculate the precise result of reflective superposition.
The time (t) taken for any reflexion to arrive at the listening position, after the direct sound, is given by the equation:
|
(11.3) |
where:
d1 = direct path (in metres)
d2 = reflected path (in metres)
c = speed of sound (in metres per second)
For any given frequency, the relative phase of the direct and reflected waves can be found from the equation:
|
(11.4) |
Ld = path length difference (in metres)
λ = wavelength (in metres)
For example, if a wave with a frequency of 172 Hz (having a 2 m wavelength) had a direct and reflected path length difference of 1 m, then this formula would give:
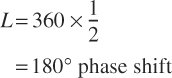
which means that the reflected wave would tend to cancel the direct wave. For a path length difference of 6 metres, the equation would give:
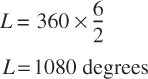
[For answers above 360, the result is simply divided by 360, and any remainder is the difference in phase angle.]
Now 1080° is 3 × 360°. In this case, the reflected wave would show a 0° phase difference, and thus would be in phase with the direct signal, meaning that it would add its pressure to that of the direct wave, but, the fact that it had travelled through three full revolutions of phase is a function of the arrival delay caused by the path length difference. Phase shifts due to distance travelled are frequency dependent, because they are wavelength related, and as sine waves are continuous (or at least quasi-continuous), 360°, 720°, or 1080° phase shifts all yield the same result: in-phase summation. However, the same case does not hold true for transient signals, which have phase slopes; i.e. a rate of change of phase with frequency, whereas a single frequency only has a rate of change of phase with distance.
The main difference between a phase shift of 360° and 3600° on a 172 Hz reflected signal would be that the latter reflexions would have travelled nine full cycles further. As each cycle of 172 Hz has a wavelength of 2 m, 9 cycles represent a distance of 18 m. This may be a significant factor in the degree to which a 360° or a 3600° reflexion sums with the pressure of the direct wave, because the 18 m extra distance which the 3600° reflected wave travels will also reduce its sound pressure level compared to the 360° reflexion (if reflected from similar surfaces). The strength of the returning reflected wave will also be dependent upon the absorption coefficient of the wall. Just for a single reflexion of a single frequency, therefore, we must consider its relative phase, the distance that it has travelled, and the reflexion coefficient of the reflecting surface before we can even begin to calculate its effect on the direct signal. To add a few complications more, remember that the absorption coefficient will be frequency dependent, angle of incidence dependent, and may itself affect the phase of the reflected wave. It is also worth noting here that whilst a reflected wave which is 6 dB down on a direct wave with which it superimposes itself will not affect the measured SPL, it may well still be very audible due to the spacial discrimination of the ear.
11.7 The Black Art
From this chapter it can be seen that the combination of a loudspeaker and a room is a complex interactive system that defies simple explanation. Every situation requires individual assessment if the best results are to be achieved.
Most rooms consist principally of four walls, a floor and a ceiling, but the capacity for variability, in this simple combination alone, is infinite. There are also rooms of many different forms, such as with circular walls or domed ceilings, and almost all rooms contain furniture. In general, the behaviour of sound waves in such spaces is not intuitively obvious, and the number, location and sizes of doors and windows further complicate matters. It is perhaps not surprising, then, that the room environment, which is the interface between the loudspeaker and the listener, can impose a great degree of its own character on the performance of any sound system within it. No doubt as a result of this, together with the limited degrees of response predictability and the few clear ‘rules of thumb’ which can be followed, the subject of room acoustics has come to be widely perceived as a ‘black art’. This situation is perhaps not helped by the fact that a good set of room acoustics for one type of music may be bad for another, and a room that is good for speech may be awful for an orchestra. Large rooms, small rooms, live rooms, dead rooms, conference rooms, theatres, sports halls and many others all have their unique design criteria, and rarely do those criteria coincide. The subject of the effects of rooms on loudspeakers is therefore truly huge, and whole books exist dealing with specific areas alone.
One chapter can hardly do the subject justice, but in the general context of this book, the most relevant area of study is the part played by relatively small rooms in the music production/reproduction chain. In fact, the performance of neither a musical instrument nor a loudspeaker can be wholly defined without knowledge of the room in which it will be used. This is because in any signal chain relating to music recording or its reproduction via loudspeakers, the room will be the final and the most variable link, possibly greatly affecting the overall transfer function from the recorded source to the ear. So, despite the frustrations inherent in the subject, we need to address it in some detail or our understanding of recording studio requirements will not be complete. The following chapter will begin to look at how to deal with the problems.
11.8 Summary
Rooms tend to change significantly the responses of loudspeakers located within them.
The radiation pattern of a loudspeaker greatly influences the degree to which various room effects will be perceived.
Rooms can actually increase the radiated output from loudspeakers, but the effects are frequency dependent.
The critical distance from a loudspeaker is that at which the direct and reverberant sound fields are equal in level. At low frequencies in a typical domestic room the critical distance can be as small as half a metre.
Some loudspeakers for domestic use have on-axis responses that rise with frequency. This is to try to achieve a more frequency-balanced overall effect in the common conditions of greater low frequency reverberation.
Attempts to correct room response problems by means of loudspeaker equalisation will tend to affect transient and steady state signals differently. No overall improvement may be possible by such means.
When a correction to an amplitude response irregularity also tends to correct the phase response (and hence also the time response) the effect is said to be minimum-phase.
When a correction to an amplitude response cannot also correct the phase response, the effect is said to be non-minimum phase.
Digital correction techniques can be used to correct a non-minimum phase problem in both amplitude and phase, but the correction can only be made accurately for one point in space.
The modulation transfer function may prove to be a useful tool in determining the limits up to which digitally signal-processed loudspeakers are able to compensate for room acoustic problems, and also to indicate where the subjective losses can become greater than the gains.
Loudspeaker crossover filters and the displacement of the drivers can also produce non-minimum phase responses.
Sine waves have phase shifts: a rate of change of phase with distance. Transient signals have phase slopes: a rate of change of phase with frequency.
The effect of reflective superposition on a direct sound wave is dependent upon many variables, such as distance (relative phase and level), degree of reflectivity of boundaries (relative phase and level), and boundary absorption with respect to frequency (frequency content, level and phase of reflected wave). The angle of incidence of the direct wave on the reflective boundary may also influence the relative frequency, phase and level proportions of the reflexions.
With all of these influences to consider, it is wise to think of a loudspeaker/room combination as a single system, and to treat it as such.
Some electronic solutions can now deal with the more gross irregularities of room responses.
References
1 Holland, Keith, Newell, Philip, Mapp, Peter, ‘Steady State and Transient Loudspeaker Frequency Responses’, Proceedings of the Institute of Acoustics, Vol. 25, Part 8, Reproduced Sound 19 conference, Oxford, UK (2003)
2 Holland, Keith, Newell, Philip, Mapp, Peter, ‘Modulation Depth as a Measure of Loudspeaker Low-Frequency Performance’, Proceedings of the Institute of Acoustics, Vol. 26, Part 8, Reproduced Sound 20 conference, Oxford, UK (2004)
3 Holland, Keith, Newell, Philip, Castro, Sergio, Fazenda, Bruno, ‘Excess Phase Effects and Modulation Transfer Function Degradation in Relation to Loudspeakers and Rooms Intended for the Quality Control Monitoring of Music’, Proceedings of the Institute of Acoustics, Vol. 27, Part 8, Reproduced Sound 21 conference, Oxford, UK (2005)
4 Fazenda, B. M., Holland, K. R., Newell, P. R., Castro, S. V., ‘Modulation Transfer Function as a Measure of Room Low Frequency Performance’, Proceedings of the Institute of Acoustics, Vol. 28, Part 8, pp. 187–194, Reproduced Sound 22 conference, Oxford, UK (2006)
5 Harris, L. E., Holland, K. R., Newell, P. R., ‘Subjective Assessment of the Modulation Transfer Function as a Means for Quantifying Low-Frequency Sound Quality’, Proceedings of the Institute of Acoustics, Vol. 28, Part 8, pp. 195–203, Reproduced Sound 22 conference, Oxford, UK (2006)
6 Newell, Philip, Holland, Keith, Loudspeakers for the Recording and Reproduction of Music, Focal Press, Oxford, UK (2007)
Bibliography
Borwick, John, Loudspeaker and Headphone Handbook, 3rd Edn, Focal Press, Oxford, UK, Boston, USA (2001)
Charalampos, Ferekidis and Kempe, Uwe, ‘Room Mode Excitation of Dipolar and Monopolar Low Frequency Sources’, presented at the One Hundredth Convention of the Audio Engineering Society, Preprint No. 4193, Copenhagen (1996)
Colloms, Martin, High Performance Loudspeakers, 5th Edn, John Wiley & Sons, Chichester, UK (1997)
Eargle, John M., Loudspeaker Handbook, Chapman and Hall, New York, USA, London, UK (1997)
Newell, Philip, Studio Monitoring Design, Focal Press, Oxford, UK (1995)
Schroeder, Manfred R., ‘Models of Hearing’, The Proceedings of the Institute of Electrical and Electronic Engineers (IEEE), Vol. 63, No. 9, pp. 1332–50 (September 1975)