CHAPTER 2
The Climate Before the Collapse
We have known for a long time that the climate is changing. Numerous ice ages and warming periods have shown that the Earth's climate is constantly undergoing change. In terms of human lifetimes, each of these periods lasted a relatively long time. In the more recent history of the Earth, ice ages have occurred about every 100 000 years, always interrupted by much shorter warmer periods, referred to as interglacial periods. Our current warm period, called the Holocene era, began about 11 700 years ago. As the previous interglacial periods on average lasted only about 15 000 years, we should be heading towards the next ice age.
The exact causes for the alternation between interglacial periods and ice ages can only be reconstructed to a point. Natural effects, such as changes in solar activity, changes in the geometry of the Earth's orbit, vulcanism, changes in the ocean currents and the shifting of continental plates are considered the main causes of climate change. When multiple causes occur at the same time, very abrupt changes are possible. This is confirmed by the climate history of the Earth. In this sense, the global warming that we have observed in recent years is nothing out of the ordinary. What is unusual, however, is that, for the first time it is apparently living things on Earth – namely, human beings – that are causing an abrupt change in climate.
2.1 It Is Getting Warm – Climate Changes Today
2.1.1 Accelerated Ice Melt
After the last ice age, global temperatures increased by around 3.5 °C. Due to the warming and thawing ice, sea levels rose by more than 120 m. During the last ice age, areas that are densely populated today were covered by ice sheets several metres thick, and landscapes which were once fertile have been swallowed by the sea. Over the last 7000 years, however, the climate conditions on Earth have been very constant. Sea levels have hardly changed at all and temperatures have only changed by a few tenths of a degree Celsius. This climate stability was one of the essential prerequisites for humanity's development. Our civilization, with its settlements and agricultural areas has adapted to the stable conditions. If we destroy this stability, it will profoundly impact life as we know it today.
A look at developments since the last ice age is also helpful when assessing future temperature changes. Figure 2.1 shows that even relatively small temperature changes can have major effects. A warming of 1 °C does not sound very dramatic to many people at first. However, if this is viewed in relation to the temperature increase since the last ice age, even such a seemingly small value is rather disturbing.
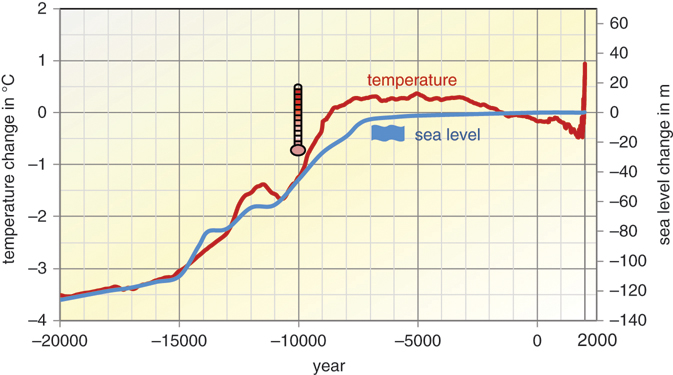
Figure 2.1 Changes in temperature and sea level between 20 000 BCE and 2016 CE.
Source: Data: [CDI16, Mar13, Sha12, Fle98], period 1951–1980 corresponds to zero.
Due to the influence of humans, the temperature has already risen by around 1 °C in the last 100 years, and the rise is accelerating more and more. You don't need to be a climate expert to realize that the recent increase cannot be a normal development. Climate experts are particularly concerned about the comparatively fast rate at which temperatures are rising. There is no natural explanation for this extreme increase.
If further major changes to climatic conditions occur, they will undoubtedly have an even stronger impact on the face of the Earth and our current way of life than any of the most dramatic historical events of the last few centuries have had. Experts therefore consider warming above 1.5–2 °C to be unacceptable. Therefore, today, combatting the greenhouse effect caused by humans and its associated warming is probably, by far, the most important task in preserving the lives of future generations.
![]()
- The global surface temperature in 2016 was already 0.94 °C above the average between 1951 and 1980.
- The 2000s were the warmest decade since temperature measurements began.
- The increase in temperature during the last 50 years was twice as high as during the last 100 years. The warming of the Arctic has been twice as fast.
- The temperatures of the last 50 years have been higher than at any time in the last 1300 years.
- Glaciers are shrinking worldwide, as are the ice sheets on Greenland and Antarctica. The Alpine glaciers have already lost two thirds of their volume between 1850 and 2010.
- Summer Arctic sea ice cover decreased from 7.5 million square kilometres in 1982 to 3.5 million square kilometres in 2012.
- Since 1993 the sea level has risen an average of 3.1 mm yr−1; during the twentieth century this amounted to a total of 17 cm. More than half of this is due to the thermal expansion of the oceans, about 25% to the melting of mountain glaciers and around 15% to the melting of the arctic ice sheets.
- The frequency of heavy precipitation has increased.
- The frequency and intensity of droughts have increased since the 1970s.
- The frequency of extreme temperatures has increased.
- Tropical cyclones have become much more intense since the 1970s.
Global warming is not uniform across the world. In the Arctic region, in particular, the temperature change has already exceeded 2 °C in places (Figure 2.2). Generally, the land warms up faster than the oceans. With an average temperature rise of more than 4 °C, some regions could develop literally into death zones where, due to the enormous heat, humans could not survive for long without technical aids.
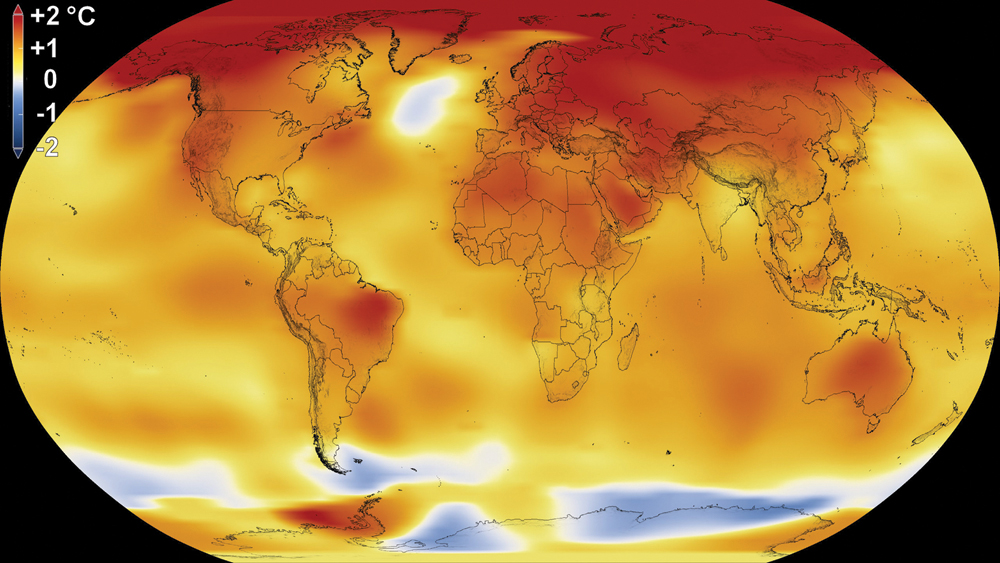
Figure 2.2 Temperature change between 2012 and 2016 compared to the long-standing average between 1951 and 1980.
Source: NASA/Goddard Space Flight Center Scientific Visualization Studio, http://svs.gsfc.nasa.gov.
The temperatures in the polar regions are rising even more quickly than in the rest of the world. The ice coverage in the Arctic has decreased by about 10–15% within 20 years (Figure 2.2). Ice cover in the Arctic has fallen by more than 50% within 30 years (Figure 2.3). Besides the ice masses of the Arctic, many glaciers are melting rapidly. The largest glaciers in the world, the Bering Glacier in the Arctic region of Canada, has shrunk by more than 10 km over the last century. Less than half the mass of the mountain glaciers in the Eastern Alps that existed in 1850 still remains today.
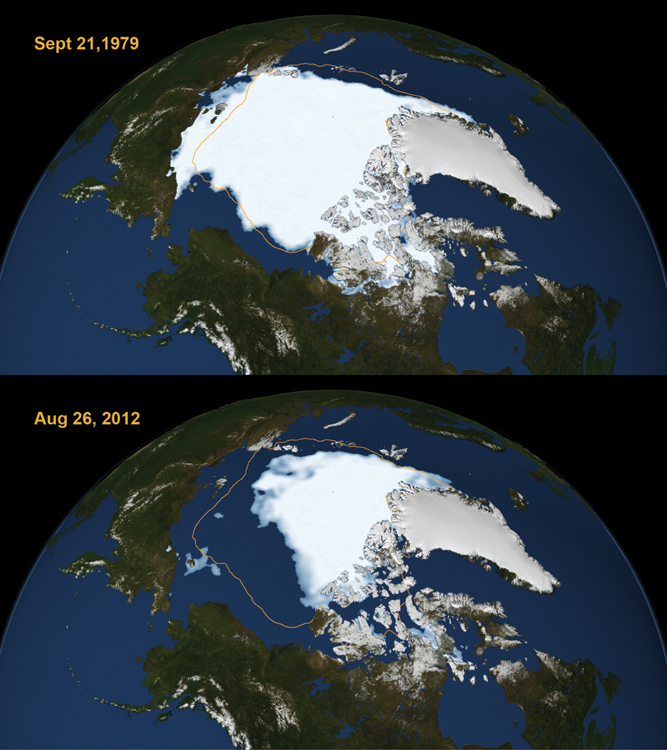
Figure 2.3 Arctic summer ice coverage in 1979 (above) and 2012 (below).
Source: NASA, http://svs.gsfc.nasa.gov.
So far, sea levels have only risen by around 20 cm in the last 100 years. However, should the continental ice on Greenland or Antarctica noticeably melt in the future, the rise in sea levels would accelerate noticeably.
2.1.2 More Frequent Natural Catastrophes
As global temperatures rise, extremes in weather are also occurring more frequently. Major differences in temperatures cause storms to be more violent, rainfall to be heavier and high tides and flooding to be more frequent than before.
Climate and weather-related events are already the main cause of human displacement (Figure 2.4). In 2016, 23.5 million people worldwide had to flee storms and floods. Between 2008 and 2016, the total number was 196 million [iDMC17]. A large proportion of the population displacement has already happened in Asia, Latin America, and the Caribbean, but this has now developed into a problem in Europe also and continues to feature in international news. However, Europe is unlikely to be spared from such movements in the face of rising climate change impacts. If global warming causes sea levels to rise by only 1 m in the medium term, around 100 million people will permanently lose their homes.
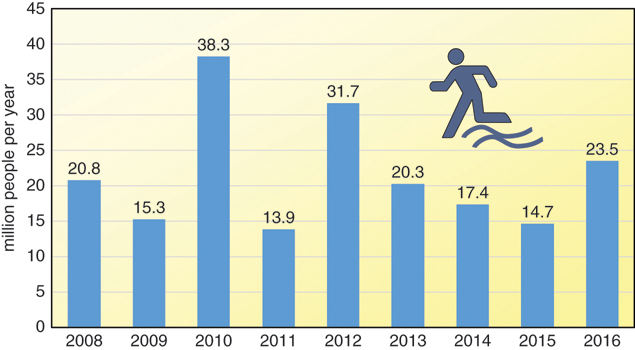
Figure 2.4 Number of people displaced worldwide by climate- and weather-related natural disasters such as storms and floods.
Data: iDMC [iDMC17].
![]()
- Winter 1990: The storms Daria, Herta, Vivian, and Wiebke kill 272 people in Europe and cause €12.8 billion in damage.
- 29 April 1991: A storm tide resulting from the tropical cyclone Gorky hits Bangladesh. 138 000 people die. The material damage at €3 billion is comparatively high in this poor country.
- 12 December 1999: Storm Lothar devastates large areas of Europe. As many as 110 people die. The damage amounts to €11.5 billion.
- August 2002: Unusually heavy rainfall of up to 400 l m−2 causes major flooding in Germany and some neighbouring countries. Overall in Europe 230 people lose their lives and the damage is €18.5 billion.
- August 2003: Europe's most extreme heatwave in recorded history takes 70 000 lives and causes damage close to €13 billion.
- August 2005: Hurricane Katrina wreaks havoc in the USA and destroys the city of New Orleans, resulting in the deaths of 1322 people. The most expensive storm of all time causes USD125 billion (around €95 billion) worth of damage.
- 18 January 2007: Hurricane Kyrill sweeps across Europe. Deutsche Bahn halts all train travel in Germany for the first time in history.
- October 2010: An unusual drought in East Africa causes dramatic crop failures. Around 260 000 people starve to death.
- October 2012: Hurricane Sandy devastates parts of the Caribbean and the US East Coast and also moves unusually far north, hitting New York hard. A total of 253 people die. The losses amount to USD66 billion (around €50 billion).
- June 2013: Eleven years after the flood of 2002, extreme precipitation once again causes massive flooding and record high water levels in Germany, Austria, and the Czech Republic. Again, there are fatalities and losses in the billions.
- July 2016: Extreme precipitation and flooding cause damage worth USD20 billion in China. 60 million people are affected, 237 die.
- September 2017: Hurricanes Harvey, Irma, and Maria destroy parts of the Caribbean and the US metropolis Houston. The losses are estimated at USD215 billion. 324 people die.
- January 2018: Hurricane Friederike, with wind speeds of up to 200 km h−1, claims 8 lives in Germany.
According to observations by Munich Reinsurance Company, the number of property losses is also increasing continuously, with the global total already exceeding €200 billion in record years.
Hurricane Katrina alone, which devastated the US city of New Orleans in 2005, caused damage worth around USD 125 billion and cost the lives of 1300 people (see also Figure 2.5). In 2017 Hurricane Harvey destroyed large parts of Houston. In some places, within a few days, more than 1500 l of rain per square metre had fallen and 200 000 houses were damaged or destroyed. The overall damage is estimated at USD85 billion.
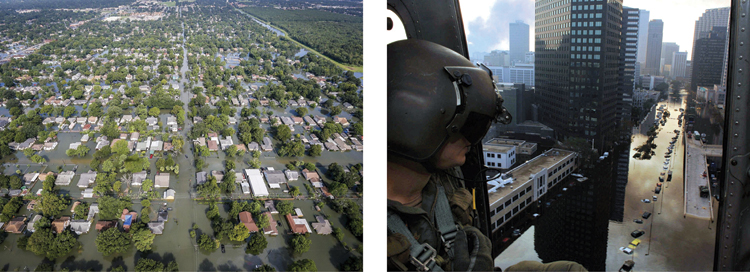
Figure 2.5 Damage caused by hurricanes in the USA.
Photos: US Department of Defense|Pixabay.
In Germany, too, extreme events have increased. Examples in recent years have been heavy rain and floods (Figure 2.6). Many people remember the record summer heat of 2003. Major heatwaves cause a decline in harvest yields. Extreme weather events also bring about a rise in the death rate. In the summer of 2003, some 70 000 more people died in Europe than in a normal year as a result of the intense heat. An estimated 7000 heat-related deaths occurred in Germany alone.
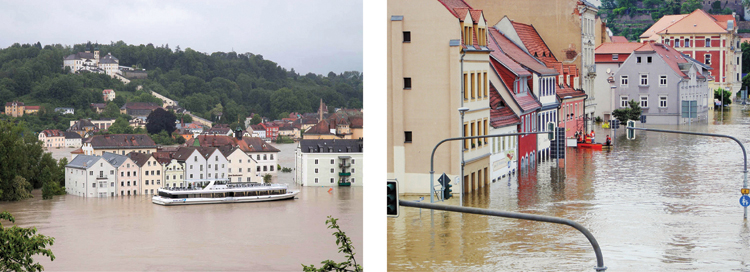
Figure 2.6 Damage caused by flooding and thunderstorms in Germany.
Photos: Wikimedia Commons – Stefan Penninger|Pixabay.
Although the financial damage resulting from natural catastrophes is still at present manageable in Europe, these figures are expected to rise dramatically by the end of the century. The German Institute for Economic Research DIW projects that the overall cost of climate change to Germany alone will amount to around 3000 billion euros by the year 2100, if global warming brings about a 4.5 °C rise in temperature [Kem07].
2.2 The Guilty Parties – Causes of Climate Change
2.2.1 The Greenhouse Effect
Without the protective influence of the atmosphere, the Earth's temperature would be around −18 °C. This means we would be living on an ice-bound planet (Figure 2.7).
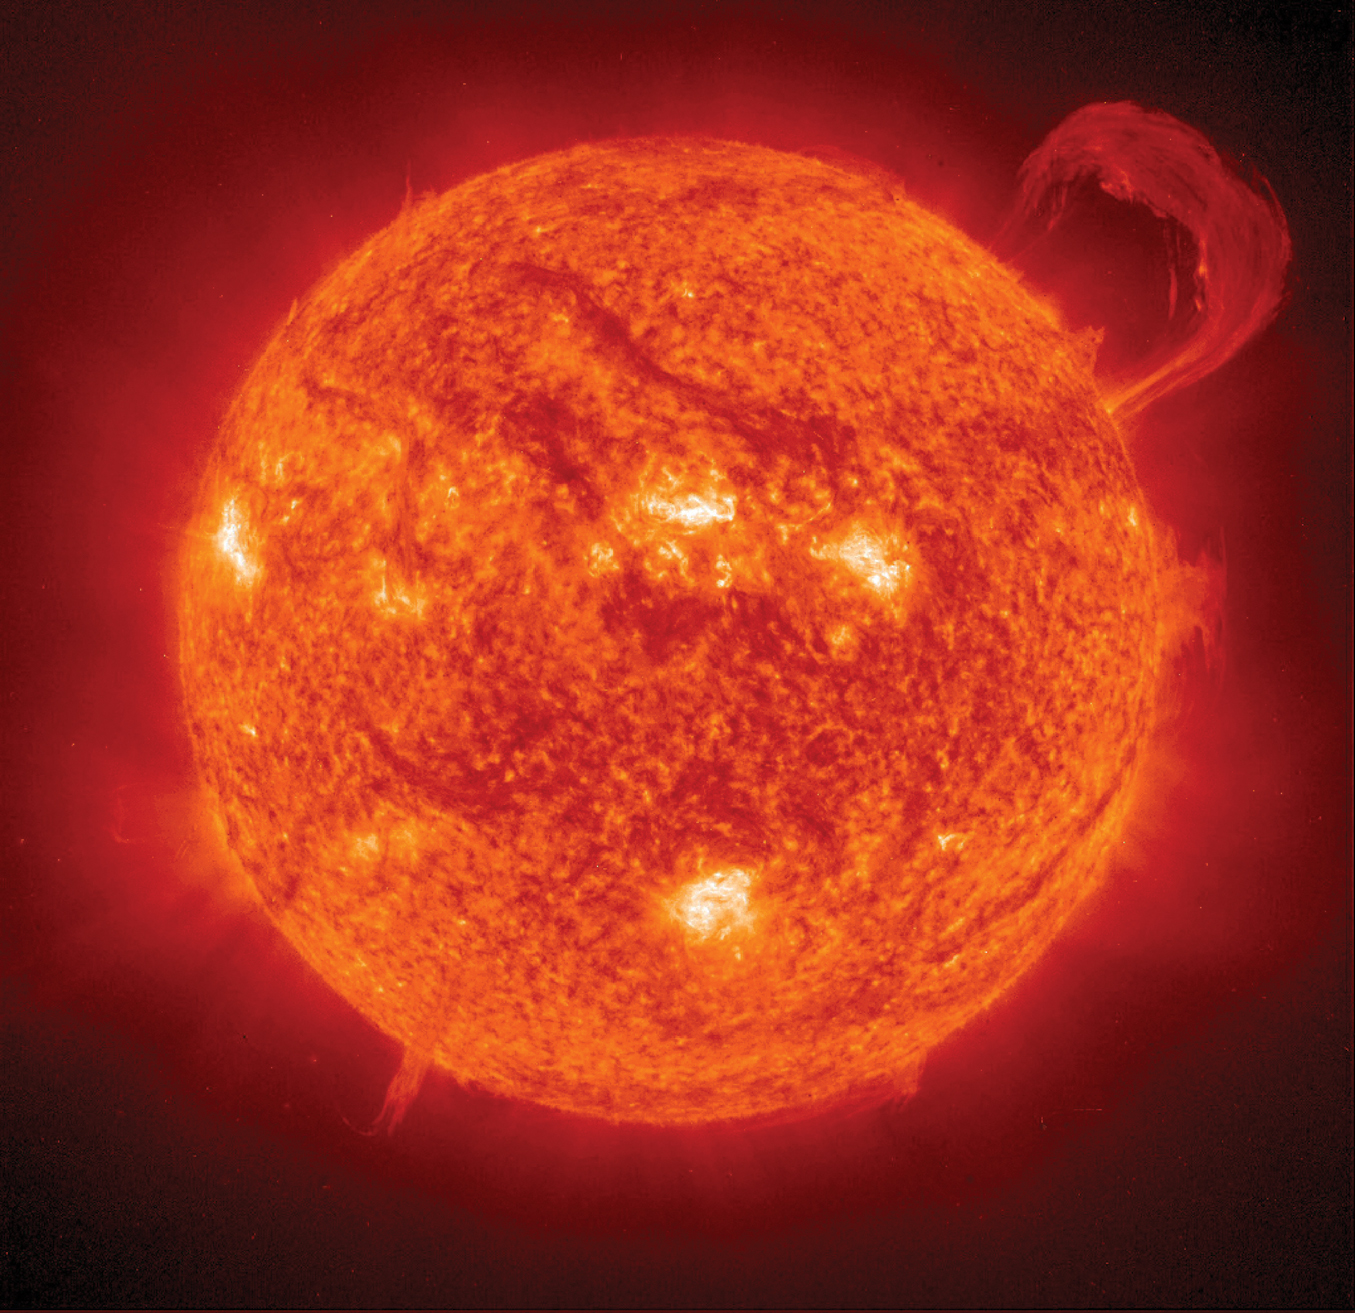
Figure 2.7 Changes in solar activity are responsible for only a fraction of global warming.
Picture: NASA.
Various natural trace gases in the atmosphere – such as water vapour, carbon dioxide, and ozone – prevent the Earth from emitting all incoming solar energy back into space. As in a greenhouse, these gases radiate part of this energy back to Earth. This natural greenhouse effect is the basis for life on Earth and as a result, the average temperature has settled at around +15 °C.
Many different possible causes for the observed climate change have already been discussed. For a long time, sceptics even questioned whether climate change was really taking place. Now that no one can seriously claim that it is not getting warmer, there are still some individuals trying to blame it on natural causes – for example, on solar activity. Apparently solar activity during the last few decades has been higher than in all the previous 8000 years. It has been demonstrated that the amount of radiation reaching the Earth has indeed risen slightly. However, scientists rule out the possibility that this is what is causing the high levels of warming today. At most, one-tenth of the observed increase in temperature is attributed to the rise in solar activity.
During the last few millennia, a balance has formed in the level of trace gases in the atmosphere, which has enabled life in the form that we know it today. The most plausible cause of warming is that the proportions of the trace gases have changed significantly due to human influences. The concentration of gases that have been proven to cause global warming has increased considerably in recent decades. Therefore, humans are causing an increase in the natural greenhouse effect. The greenhouse effect brought about by humans is also referred to as an anthropogenic greenhouse effect (Figure 2.10). But this is not a particularly new theory.
 Are We Ruining the Air that We Breathe?
The air that we breathe out contains around 4% carbon dioxide – about 100 times more than the air we breathe in. Every year, we each release around 350 kg of carbon dioxide into the atmosphere. When we light a campfire using wood, we are also guilty of releasing carbon dioxide. However, plants, animals, and people are all part of a biogeochemical cycle. People consume carbohydrates and breathe in oxygen and together these are converted into carbon dioxide, which they then breathe out again.
Plants in turn intake this carbon dioxide and then provide us with carbohydrates. Carbohydrates are organic compounds consisting of carbon, hydrogen, and oxygen and are produced in plants through photosynthesis. For example, grains and noodles comprise 75% carbohydrates. It is even possible that the wheat in Italian spaghetti has converted the carbon dioxide that we breathed out during our last Tuscan holiday into carbohydrates.
When a plant burns, rots, or ends up as a carbohydrate supplier, it generates just as much carbon dioxide as it previously extracted from the air. The natural cycles are therefore CO2-neutral and do not lead to an increase in concentration. However, this does not apply to the holiday trip to Italy and the transport of Italian spaghetti to other countries.
2.2.2 The Prime Suspect: Carbon Dioxide
In 1896, the Swedish scientist and Nobel Prize winner, Svante Arrhenius already worked out that doubling the carbon dioxide content (CO2) in the atmosphere would increase the temperature by 4–6 °C [Arr96]. The connection between observed climate warming and the increase in carbon dioxide following industrialization was already being discussed in the 1930s, but at the time there was no way of confirming this connection.
It was not until the late 1950s that scientists were able to prove that the concentration of carbon dioxide in the atmosphere was increasing [Rah04]. Today there is widespread proof that the increase in carbon dioxide concentration is the main cause of the observed warming.
Fossil energy use is the main cause of the increase in carbon dioxide concentration. If we burn fossil energy sources, this is regarded as oxidation from a chemical point of view. This reaction releases heat. We therefore use the effect of heat that results when the carbon from oil, natural gas, and coal is combined with the oxygen in the air. The waste product we get in return is carbon dioxide – and we get it in enormous quantities: currently well over 30 billion tons every year. The average human produces about 4500 kg yr−1. A corresponding amount of carbon dioxide would fill a cube with sides 13 m long, or around 2.3 million one-litre bottles.
As with energy consumption, the emissions in individual countries can vary a great deal (Table 2.1). For example, whereas someone from the Democratic Republic of Congo would tip the scales at only just 40 kg, i.e. 0.04 of a ton of CO2, per year, in China it is almost 7 tons per head. In Germany it is more than 9 tons, and in the USA, more than 16 tons. If the carbon dioxide generated by Germans each year were dispersed over the country's entire land area, every German would be standing in 1 m of CO2. In contrast, the carbon dioxide in the Democratic Republic of Congo dispersed over the country would not even form a layer 1 mm thick.
Table 2.1 The 10 countries on Earth with the highest energy-related carbon dioxide emissions (2015)
| Country | Mil. t CO2 | Mil. inhab. | t CO2/inhab. | Country | Mil. t CO2 | Mil. inhab. | t CO2/inhab. |
| 1. China | 904100 |
137100 |
6.5900 |
6. Germany | 73000 |
82 | 8.9300 |
| 2. USA | 499800 |
32200 |
15.5300 |
7. South Korea | 58600 |
51 | 11.5800 |
| 3. India | 206600 |
131100 |
1.5800 |
8. Iran | 55200 |
79 | 6.9800 |
| 4. Russia | 146900 |
14400 |
10.1900 |
9. Canada | 54900 |
36 | 15.3200 |
| 5. Japan | 114200 |
12700 |
8.9900 |
10. Saudi Arabia | 53200 |
32 | 16.8500 |
| World | 32 29400 |
733400 |
4.4000 |
133. DR Congo | 300 |
77 | 0.0400 |
Data: IEA [IEA17].
Yet, it is not that long since we have been able to claim with absolute certainty that the amount of carbon dioxide in the atmosphere is increasing on a yearly basis. The Mauna Loa Observatory in Hawaii has only been measuring the concentrations of carbon dioxide continuously since 1958. At that time the concentration amounted to 315.2 ppm, the following year it was already up to 315.8 ppm. The unit ppm stands for ‘parts per million’. Thus, there were 315 parts of carbon dioxide per million parts of air. The small increase during the first year could also have been caused by a measurement error or natural fluctuations. It was not clear until the values began rising constantly in subsequent years that the amount of carbon dioxide was increasing – and even accelerating. By 2017 the CO2 concentration had already risen to 407 ppm.
But, in comparison with the enormous size of the atmosphere, the high carbon dioxide emissions that occur when fossil fuels are burnt are minute. Furthermore, some of the carbon dioxide is absorbed again by the oceans and the plants. So, the question is how much can our emissions really change the composition of the atmosphere?
If we were to produce nitrogen instead of carbon dioxide when we use fossil energy sources, this would not pose a big problem. The reason is that our air consists of around 78% nitrogen and 21% oxygen but only 1% other gases – of which carbon dioxide makes up only a minuscule part. During the course of the Earth's history, the composition of the air has by no means been consistent. However, in the past few thousand years a balance of less than 300 ppm CO2 has established itself. The proportion of carbon dioxide in the atmosphere was thus less than 0.03%. However, this is also the reason why we are even able to bring about any relevant changes as these small quantities can be increased comparatively easily.
A study of the climate of the past few millennia requires a different approach. In the regions with permanent ice, fresh snow falls on the ice surfaces every year. Large quantities of air are trapped between the ice crystals. The new snow masses that form each year alongside the old ones increase the pressure on the old snow and ultimately press it down into pure ice. In the process the air does not escape totally but instead remains as small bubbles trapped in the ice. Today these air bubbles can be examined using modern techniques of analysis. The deposits of snow and the creation of ice repeat themselves each year with a regularity welcomed by scientists. All it takes is to drill a hole into the ice and draw up ice samples from deep down. This provides a silent witness to the past. The deeper that one probes into the ice, the further back in history one is able to look.
Different drill core studies unanimously find that the concentration of carbon dioxide before the period of industrialization was around 280 ppm (Figure 2.8). Studies have shown that the proportion of carbon dioxide in the atmosphere is higher today than at any other point in the past 650 000 years (Intergovernmental Panel on Climate Change [IPCC], 2007).
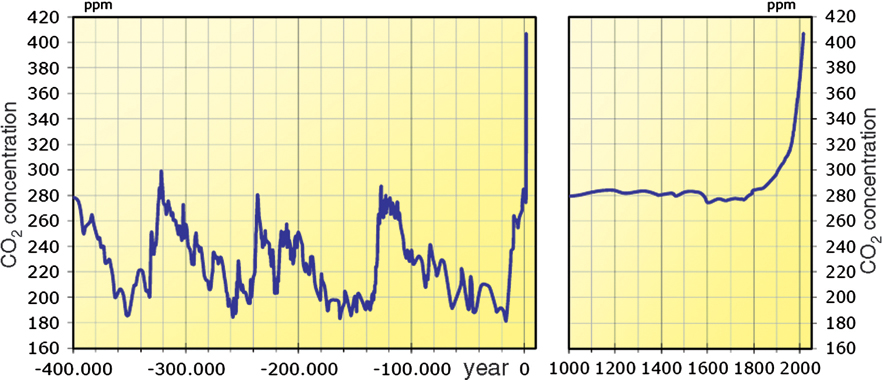
Figure 2.8 Time series of carbon dioxide concentration in the atmosphere over the last 400 000 years and in the recent past.
Data: CDIAC, http://cdiac.ornl.gov.
Once it was finally proven that carbon dioxide emissions are increasing, climate models were developed to establish a correlation between the burning of fossil fuels and the increase in CO2. Sources other than the emissions caused by humans were not considered as reasons for the increase. The models show that the CO2 concentration could still more than double, depending on the extent of the future consumption of coal, oil, and natural gas.
This discovery raised another question, namely what the consequences of such drastic changes would be. In high concentrations carbon dioxide is unhealthy for humans, and can even be life-threatening. However, to reach a level that would damage the health of humans, the concentration would have to increase a hundredfold and to cause any danger of suffocation, it would have to increase by a factor of 300. There is no way that we could reach such levels, even if we were to burn all the oil, natural gas, and coal available. At least any acute danger to the lives of humans can be ruled out.
Direct measurements of temperature have existed for well over 100 years. A comparison of global temperature changes with energy-related CO2 emissions shows a significant connection between the two (Figure 2.9). Yet sceptics find fault with this argument and point out that the temperatures actually fell slightly between the 1940s and the 1980s. Today there is an explanation for this. Aerosols from high dust and soot emissions in the burning of fossil energy sources reduce the solar radiation on Earth. They act, so to speak, like sunglasses and thus create a cooling effect. Today modern filtering techniques have eliminated a major proportion of these emissions. This again decreases the sunglasses effect. However, CO2 and the associated rise in temperature have remained.
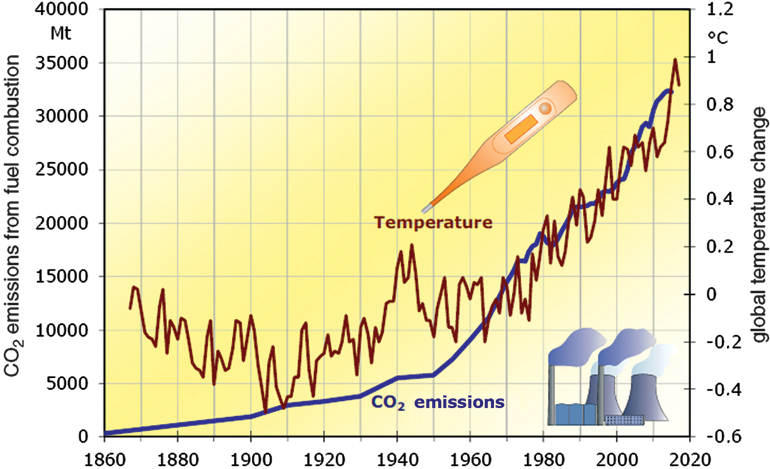
Figure 2.9 Progression of energy-related CO2 emissions and global changes in temperatures since 1860 compared to the average between 1951 and 1980.
Data: NASA, IEA.
As wood absorbs carbon dioxide during its growth, its burning then makes it carbon dioxide-neutral. However, this is only the case if the same quantity of plants is used and burnt as can grow back again. Tropical rainforests are currently being burnt at a much faster rate than their rate of regeneration. An area of woodland the size of the United Kingdom is disappearing every two years. Some of the forests being burnt are so large that they can easily be detected from space. If this does not change during the next few years, almost all the woodland in the world will be gone in about 100 years. During this time large quantities of carbon dioxide will be released, causing 10% of the greenhouse effect. However, the remaining CO2 originates largely from the burning of fossil energy sources.
2.2.3 Other Culprits
Fossil energy use is not the only culprit. Agriculture, the clearing of rainforests, and industry are also responsible for the additional greenhouse effect caused by humans (Figure 2.10).

Figure 2.10 Causes of the anthropogenic greenhouse effect caused by humans.
Aside from carbon dioxide, there are other substances released through the actions of humans that cause the greenhouse effect. Methane, hydrofluorocarbons (HFCs), ozone, and nitrous oxide are some of the key ones. Although the concentration of these elements in the atmosphere is considerably lower than that of carbon dioxide, they have a much higher specific greenhouse potential.
The greenhouse potential of methane is 21 times that of carbon dioxide. This means that 1 kg of methane causes just as much damage as 21 kg of carbon dioxide. Methane is the second most important greenhouse gas. The concentration of methane in the atmosphere has already more than doubled because of human activity. Methane is also emitted during the exploitation of fossil energies. It escapes during natural gas extraction and coal mining, as well as from defective natural gas lines, and refuse disposal sites are another source (Table 2.2).
Table 2.2 Characteristics of the most important greenhouse gases
| Carbon dioxide | Methane | HFC | Laughing gas (nitrous oxide) | |
| Chemical notation | CO2 | CH4 | Various | N2O |
| Concentration in the atmosphere in ppmc | 407 | 1.85 | <0.01 | 0.33 |
| Concentration in the year 1750 | 280 | 0.75 | 0 | 0.270 |
| Annual increase in concentrationc | +0.7% | +0.5% | Varies | +0.3% |
| Global warming potential compared to CO2a | 1 | 21 | >>1000 | 310 |
| Persistence in the atmosphere in years | 5–200 | 12 | Varies | 114 |
| Reflection in W m−2b | 1.68 | 0.97 | 0.18 | 0.17 |
| Percentage of anthropogenic greenhouse effectb | 74% | 16% | 2% | 6% |
aTime horizon 100 years.
b2011.
c2017.
Source: Data: IPCC, NOAA, CDIAC.
Interestingly, agriculture releases the largest proportion of methane. Livestock rearing, decaying biomass, and rice cultivation are the farming activities that produce the most methane. Unlike carbon dioxide, it is not integrated into a biological cycle. When ruminants digest green fodder, they create methane, which they belch into the atmosphere. A single cow or a herd would not pose a problem for the climate, but the number of cattle worldwide is now so large that they represent a real threat to the environment. Once again, it is the quantity that creates problems. Meat consumption per head has increased dramatically during the past few decades, as has the number of people, so that there are now more than 1.5 billion cattle on Earth.
Other greenhouse gases such as nitrous oxide (laughing gas) are created through farming due to an excessive use of nitrogenous fertilizers. Overall, agriculture contributes around 15% of the greenhouse effect caused by man.
Other key greenhouse gases include ozone, fluoride hydrocarbons (HFC and halons), water vapour, and sulfur hexafluoride (SF6). Air pollutants increase levels of surface ozone. These pollutants originate in part from motorized traffic and, therefore, are also a result of the burning of fossil fuels. The ozone problem has become a familiar one because of the health risk associated with summer smog. However, what is less known is the impact of the ozone on the greenhouse effect. SF6 is used in the electricity sector but the amount causing any greenhouse effect is relatively small.
Will the Hole in the Ozone Layer Keep Making Earth Warmer?
The ozone hole and the greenhouse effect are both global environmental threats. Yet they have very little relationship to one another.
With the ozone, a distinction must be made between the ozone layer at high altitudes and ozone at low level (at the surface of the Earth). The natural ozone layer with the ‘good ozone’ is located in the higher regions of the Earth's atmosphere – more precisely, in the stratosphere at an altitude of 15–50 km. The UV light of the sun is continuously converting air oxygen (O2) into ozone (O3) at this level. The ozone layer absorbs most of the dangerous UV radiation. Certain gases, such as chlorofluorocarbons (CFC) – from old refrigerators, air conditioners, and aerosol cans – decompose the ozone in the stratosphere. This is the reason why the ozone content in the ozone layer has decreased rapidly in recent decades. A hole in the ozone has formed, mainly over Antarctica. An increased amount of UV light now reaches the Earth and is contributing to an increase in skin cancer. International agreements have limited the use of CFC. Its use has been forbidden in new plants in Germany since 1995. In the meantime, a slow recovery has been observed in the ozone layer.
Yet the ozone in the ozone layer is itself a cause of the natural greenhouse effect. For that reason, the destruction of the ozone layer has actually produced a slight cooling effect.
‘Bad ozone’ close to Earth, on the other hand, occurs due to the reaction of nitrogen oxides, oxygen, and sunlight and causes the notorious summer smog. Ozone acts as an irritant and in large concentrations is very toxic to humans. In the natural ozone layer above an altitude of 15 km this is not a problem, but it is a problem in the troposphere close to Earth. Furthermore, the tropospheric ozone close to Earth also contributes to the greenhouse effect. Unlike what happens in the ozone layer, the ozone concentration close to Earth is increasing. Therefore, it is the ozone close to Earth that is warming up the Earth.
CFCs were used as coolants in air-conditioning systems and refrigerators. This not only contributed to the greenhouse effect, but also damaged the ozone layer. As a result, the Montreal Protocol stipulated an end to CFC production worldwide, allowing long periods of transition. HFCs are often used today as a CFC substitute. These substances no longer use chlorine as an ingredient. Although this means that they can no longer damage the ozone layer, HFCs are still a problem for the greenhouse effect. The HFC cooling agent, R404A has a specific greenhouse potential of 3260. Therefore, 1 kg of R404A is just as harmful as 3.26 tons of carbon dioxide. But there are substitute substances available that are not damaging to the climate. Unfortunately, these are currently only being used in a limited number of areas.
Scientists have now developed a relatively good understanding of the different effects of individual greenhouse gases and other factors on the Earth's warming. The greenhouse gases that result from human activities increase the absorption and retention of heat in the atmosphere, resulting in global warming. Figure 2.11 shows the contribution of the different gases. The rise in solar activity is also causing a slight increase in radiation. As described earlier, aerosols (e.g. dust and smoke) released through human activities and the resulting cloud formations to which they contribute provide a cooling effect. Even the ozone layer and changes in land use are producing a slight cooling. If one juxtaposes the cooling and the warming effects, it is the warming that predominates. An increase in greenhouse gases and a decrease in aerosols through further improvements to air quality could even cause a considerable increase in warming over the next few years.
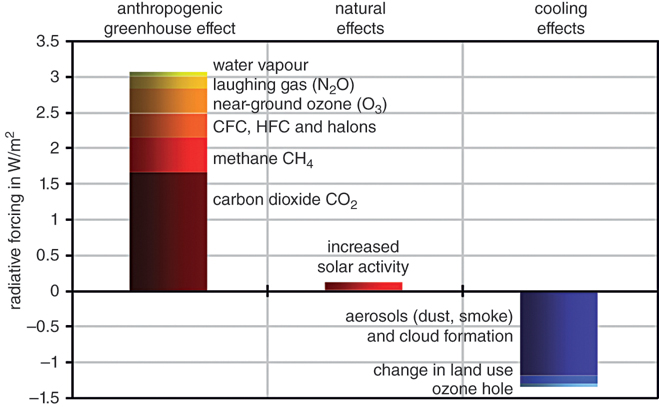
Figure 2.11 Causes of global warming.
Data: IPCC [IPC07], www.ipcc.ch.
2.3 Outlook and Recommendations – What Lies Ahead?
No one can predict how many greenhouse gases will be emitted in the future. However, climate models can indicate the effects of different emission levels. For this purpose, climate researchers have designed different models that describe the effects of changes in greenhouse gas concentrations. On the basis of these models, they have developed complex computer programmes. To check a computer model, one first tries to reconstruct the changes of the past. Much progress has been made in this area of scientific endeavour, so that projections about future trends can now be made with a high degree of confidence.
The IPCC regularly publishes reports on climate change and studies the effects of climate. The United Nations Environment Programme (UNEP) and the World Organization for Meteorology (WMO) initiated the IPCC in 1988. The most competent climate researchers in the world are involved in the preparation of the IPCC reports and, as a result, this group has a good reputation internationally.
![]()
|
Potsdam Institute for Climate Impact Research PIK Intergovernmental Panel on Climate Change United Nations Framework Convention on Climate Change (International specialist information on climate change) |
Climate sceptics regularly try to cast doubt on the results of climate researchers. Most of these are self-proclaimed climate experts with no relevant scientific background. They argue that climate researchers are developing and maintaining dubious theories in order to continue to obtain research funding. Climate sceptics are often in close contact with large energy companies that do business with coal, oil, and natural gas. If climate protection measures were to be effective, these companies would face severe economic disadvantages. The overwhelming majority of climate researchers are fully behind the scenarios produced by the IPCC.
It is virtually impossible to predict parameters such as population growth or the point when climate protection measures will be implemented. Therefore, the calculations in the models are restricted to certain scenarios. These indicate what can be expected in the best case and the worst-case scenarios. The conclusions of the climate researchers show that there is still time for us to have a drastic influence on future developments.
Climate change can no longer be stopped completely. However, decisive countermeasures could keep the consequences of climate change within manageable limits and largely save the Earth from vast perturbations to the climate. Of course, if there is no change in the coming years, climate change will very quickly reach a ‘point of no return’ and, in fact, would be unstoppable. Table 2.3 shows in which direction the course can still be set today. In the worst case, the entire Arctic ice melts. The melting of the Greenland ice sheet alone could cause sea levels to rise by 7 m in the next few centuries. This rise in sea levels will not be the same around the world. In Germany, the rise could be delayed. However, we will not be spared in the long term. Figure 2.12 shows the effects a sea-level rise of 7 m would have on Germany.
Table 2.3 Consequences of climate change – the climate can still be saved
| This is how the climate could develop if it were protected worldwide | This is what threatens us in the worst-case scenario |
|
|
|
|
|
|
|
|
|
|
|
|
|
|
|
|
|
|
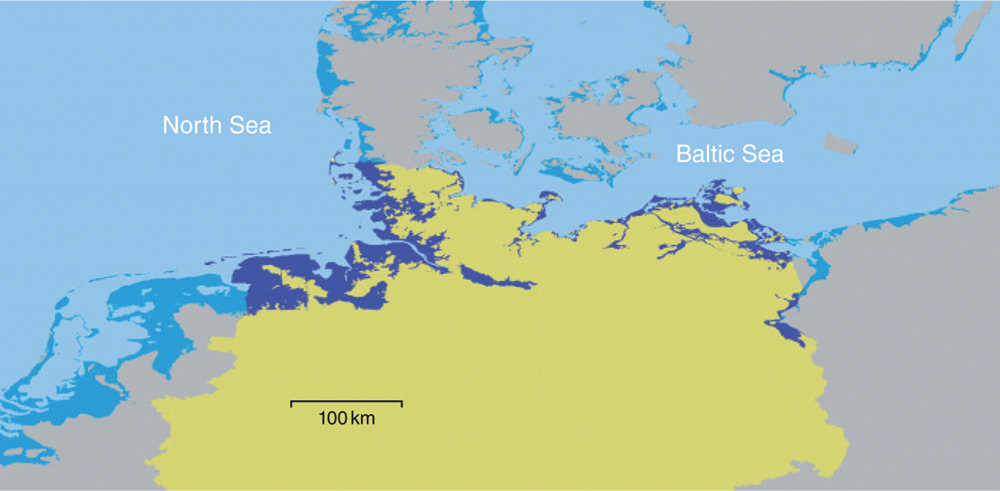
Figure 2.12 Threatened areas in Northern Germany if the sea level were to rise by 7 m in the long term.
Graphic: Geuder, DLR.
2.3.1 Will it Be Bitterly Cold in Europe?
The American climate researcher, Wallace Broecker wrote an article in 1987 entitled ‘Unpleasant Surprises in the Greenhouse’. The article caused quite a sensation at the time and warned about the potential for some seriously nasty surprises from the greenhouse effect: global warming could, paradoxically, turn Europe bitterly cold.
While studying the history of the climate from ice drill cores in the Greenland ice mass, climate researchers determined that the world's present climate is quite stable – but it has only been this way for about 10 000 years. The average annual temperature on Earth has never deviated more than one degree from the long-time average during this time. However, if one were to look back another 2000 years, one would find that major jumps occurred in temperatures even during short periods of only a few years. Until now it was always thought that temperature changes as well as the transition from ice ages to warming periods only happened very slowly. However, this opinion had to be corrected as a result of the drill core studies.
Today it is assumed that the climate tends to behave erratically on its own, thus making it a powerfully non-linear system [Rah99]. Linear systems are easy to understand. The stronger the attraction, the clearer the reaction. For example, a water tap approximates to a linear system. With two turns the amount of water that flows is double the amount from one turn. Climate is a complex non-linear system. It has a tendency to self-regulate and suddenly jumps into a different state when a critical point has been reached. The human body is an example of this self-regulation. It is able to keep its body temperature quite constant at 37 °C, even during major changes in ambient temperature. However, if a person becomes seriously hypothermic, their body temperature quickly drops at a certain point.
The Sahara is an example of very erratic climate change. Several thousand years ago the Sahara was green. The vegetation there absorbed moist air from the Atlantic and monsoon rains. Due to very minor changes in the Earth's orbit and in the inclination of the Earth's axis, the conditions for the monsoon rains deteriorated over a period of thousands of years. The vegetation managed to survive until a certain point around 5500 years ago. But then within a short period, the vegetation died, and the Sahara turned into a dry desert. A new stable state then developed, which continues until today. The populations of large areas had to flee due to the dryness of the terrain. The Egyptian Nile Valley was a refuge for the environmental refugees of the time, which contributed to the emergence of pharaonic high culture and was perhaps even the basis for biblical narratives.
![]()
KlimaLounge Blog Website of the climate researcher Stefan Rahmstorf at the Potsdam Institute for Climate Impact Research |
The origins of the erratic climate changes that occurred many years ago are suspected to lie in changes in ocean currents, which continue to have a major effect on our climate even today. For example, Berlin and London are located further north than Quebec in Canada. A comparison of temperatures shows that Western Europe is about 5°C warmer than it should be, considering its latitude. The reason for this is a gigantic self-regulating heat transport machine: the Gulf Stream.
In Central America the sun heats the water masses of the Caribbean Sea and the Atlantic. The Antilles Current and the currents from the Caribbean merge together to become the Gulf Stream, which is 50 km wide and transports enormous masses of warm saltwater northwards along the American coast. These currents are so large they can be seen from space. From North America the current then moves straight across the Atlantic, continues along the European coast towards Norway and ends in the European part of the North Sea. Some of the heat is absorbed by the air beforehand, and this air then moves with westerly winds towards Europe. This explains why winds from the West promise relatively mild temperatures to some parts of Europe.
In the North Sea between Norway, Iceland, and Greenland the warm saltwater merges with colder, less salty water, and cools down quickly. This water increases in density, becomes heavier, and consequently sinks to the bottom quickly. In the North Sea, every second 17 million cubic metres of water sink to a depth of 3000–4000 m. This corresponds to around 20 times the entire capacity of all rivers on Earth. The water masses then return to Central America as cold deep-water flow, to be heated up again there.
Due to climate warming, large quantities of meltwater (melted snow and ice) pour into the North Sea. This fresh water dilutes the warm saltwater. It has already been determined that the salt content has fallen considerably. If the salt content decreases even further, the weight of the water will not be sufficient in the future to allow it to sink down. The enormous Gulf Stream water pump would get out of step and could very suddenly come to a halt.
Climate researchers suspect this was precisely the cause of the temperature jumps 11 000–12 000 years ago. After the ice age enormous amounts of meltwater from the melting glaciers poured through the St Lawrence River into the North Atlantic. This diluted the sea water with fresh water, so that the uppermost layer of sea water became noticeably less salty and the water lighter. Therefore, the water no longer sank to the depths, despite strong cooling. The Gulf Stream was ‘turned off’ and for many years, large areas of Northern Europe and Canada were exposed to extreme cold and covered in ice. As a result, the amount of meltwater decreased again, the salt content of the water rose and the warm water heater, the Gulf Stream, started working again (Figure 2.13).

Figure 2.13 Principle of the Gulf Stream.
This is exactly the fate that we are facing again today. No scientist can accurately predict just how much global warming will have to increase before the Gulf Stream stops working. But the assumption is that the critical point will have been reached once worldwide warming increases by more than 3 °C. We already have increased the temperature by around 1 °C. The consequences for us would be catastrophic. Roland Emmerich showcased the topic in the blockbuster, The Day After Tomorrow. Even though many details are scientifically incorrect or strongly exaggerated, it nevertheless deals quite impressively with humanity's dangerous climate gamble. In reality, our climate would go crazy for years. Ultimately, it would be so cold and dry in Europe that any kind of farming would be impossible. Yet, according to the calculations of the climate researchers, this new climate state would then remain stable again for thousands of years.
2.3.2 Recommendations for Effective Climate Protection
Climate researchers consider a warming of 1.5 °C to be a critical threshold above which extreme and unmanageable consequences of climate change can occur. Only a very rapid reduction in greenhouse gas emissions can help to keep climate impacts within reasonable limits and avoid nasty surprises such as the disappearance of the Gulf Stream.
Of course, it is not possible to predict accurately to the year how much time will remain before the threshold is exceeded. In order to make statements that are as reliable as possible, climate researchers use sophisticated models on powerful mainframes to model the evolution of climate on Earth. The models have been continuously improved and can now also model many complex interrelationships. An example of this is ice albedo feedback. First of all, global warming causes the sea ice masses to defrost. Under the light-coloured ice, dark seawater appears, which absorbs sunlight better and the water heats up faster, resulting in even more ice melting.
However, despite all the improvements to the models, there are still some uncertainties. Therefore, in order to reproduce these correctly, the scientists work with probabilities where the greenhouse gas thresholds can be constrained by a certain date.
Climate sceptics like to use this to question the informative value of the models in general. However, there appears to be a lack of basic scientific understanding of future climatic changes. For example, if we try to determine when in spring the snow will have thawed in the low mountain ranges, we cannot predict the exact day when it will have completely disappeared. There is only a certain probability that it will have defrosted by mid-March, for example. However, this does not change the fact that the snow melts in spring and will have disappeared completely by a certain time with a certain time tolerance. Just because the researchers cannot give an exact date for the complete defrosting of the snow does not mean that the snow in the low mountain ranges does not thaw at all in summer.
As already described, carbon dioxide is by far the most important greenhouse gas. Between 1870 and 2011, around 1900 gigatons of carbon dioxide, or 1900 billion tons of carbon dioxide (Gt CO2), were emitted worldwide.
Table 2.4 shows which carbon dioxide budgets are still available until certain temperature thresholds are exceeded. If we want to keep global warming below the critical value of 1.5 °C with a probability of 50%, we can only emit 310 Gt CO2 from 2017. That is just one-sixth of all emissions emitted so far. But even with a 50% probability we risk a higher temperature rise than 1.5 °C.
Table 2.4 Cumulative CO2 emissions and remaining times to limit global temperature rise with different probabilities
| Maximum warming | <1.5 °C | <2 °C | <3 °C |
| Probability of meeting the target | High|medium|low 66%|50%|33% |
66%|50%|33% |
66%|50%|33% |
| Cumulative CO2 emissions since 2011 in Gt CO2 | 400|550|850 |
1100|1300|1500 |
2400|2800|3250 |
| Cumulative CO2 emissions since 2017 in Gt CO2 | 160|310|610 |
860|1060|1260 |
2160|2560|3010 |
| Remaining time in years with constant emissionsa | 4|8|15 |
22|27|32 |
54|64|75 |
| Remaining time in years with linear reduction in emissionsb | 8|16|30 |
43|53|63 |
108|128|151 |
aConstant CO2 emissions of 40 Gt CO2/a.
bImmediate stop of the increase and linear reduction of CO2 emissions to zero.
Source: Data based on: IPCC [IPC15].
Almost 38 Gt CO2 were emitted in 2011. According to official figures, about 32 Gt of this was caused by the combustion of fossil fuels and industrial processes and about 5.5 Gt CO2 by forestry and other land use. The slash-and-burn of the rainforest accounts for a very large proportion of this. In the meantime, total annual carbon dioxide emissions have risen to around 40 Gt CO2.
If emissions remain constant at 40 Gt CO2, the budget to keep the global temperature below 1.5 °C with a probability of 50% would be used up in eight years. If we start reducing emissions immediately, we should achieve zero emissions within 16 years.
If we accept that the temperature will rise above 1.5 °C but want to keep it below the much more critical threshold of 2 °C with a probability of 50%, then we would have 53 years left to reduce emissions linearly to zero (dashed curve in Figure 2.14). However, if emissions increase for a few more years, as in the past, or remain constant, the remaining time is noticeably reduced. Figure 2.14 shows this in terms of energy-related carbon dioxide emissions. Emissions from slash-and-burn deforestation would also have to fall accordingly.
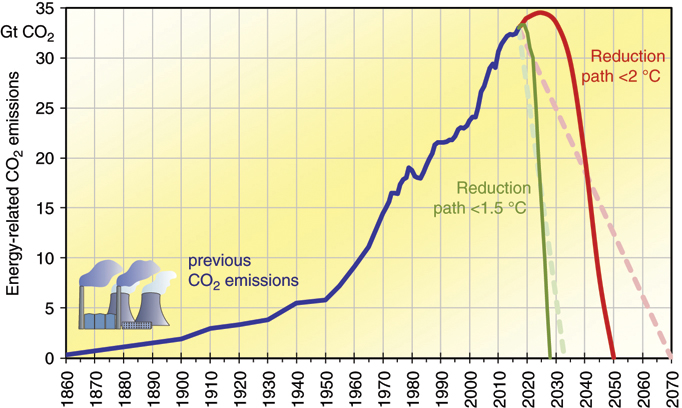
Figure 2.14 Previous energy-related CO2 emissions and reduction paths to limit the global temperature increase to 1.5 °C or 2 °C with 50% probability.
An immediate significant reduction in global emissions seems unlikely at present. The industrialized countries are currently causing the biggest per-head output of greenhouse gases. The developing and emerging countries justifiably want to catch up in terms of prosperity and energy use. That is why the industrialized countries must make the biggest contribution to reducing greenhouse gas emissions and serve as a model for the rest of the world. A responsible climate protection policy should therefore work towards reducing emissions in your own country to zero by 2040 at the latest. This probably makes it possible to limit the global temperature increase to below 2 °C. In order to comply with the 1.5 °C limit, emissions would have to fall to zero well before 2040.
To combat the greenhouse effect, radical technological change is needed worldwide. In the long term, the countries that will benefit most in economic terms are those that are leading the way in combating the greenhouse effect and are therefore the first to use the necessary sustainable technologies in their own countries.
2.4 A Difficult Birth – Politics and Climate Change
2.4.1 German Climate Policy
The realization that the consequences of an increase in global warming represents a previously unknown type of threat to mankind finally struck home for the politicians in the 1980s. At the time, the public was developing a keen awareness of the environment. Dying forests, respiratory illnesses due to air pollution, and the risk of nuclear power were topics that had a big impact on people. It was no longer possible to ignore global environmental problems.
In 1987 the German Bundestag (Lower House of Parliament) appointed the cross-party Enquete commission to deal with the issue of protecting the Earth's atmosphere. The commission studied the problems relating to climate change and drew up clear recommendations for reducing greenhouse gases [Enq90]. According to the report, emissions should fall by 25% by 2005 compared with 1990 levels, by 50% by 2020 and by at least 80% by 2050.
The first target of a 25% reduction by the year 2005 was adopted by the conservative government of Helmut Kohl. After reunification the policy was extended from West Germany to the unified Germany. After the change in government in 1998, the ‘Red-Green’ government, a coalition between the Green Party and Social Democrats, also adopted the climate protection targets for the year 2050.
The extension of the targets to the whole of Germany after reunification soon proved to be a wise move. According to statistics, German CO2 emissions had fallen by as much as 17% by 2005. As a result, Germany likes to present itself as a forerunner in climate protection on the international stage. However, a large part of the CO2 savings can be attributed to the effects of reunification. A major part of the industry in the former East Germany, with its high level of energy consumption and carbon dioxide emissions, collapsed. The output of greenhouse gases was thereby reduced to around half of what it had been, whereas in West Germany nothing much was changing in terms of climate protection. It was not until 2000 that the successes of the expansion of renewable energies had a noticeable impact on emissions.
However, the measures introduced were not adequate for an effective climate protection policy that would make the targets realistic. The first target of a 25% reduction by 2005 was missed by a long shot (Figure 2.15). The reduction target for 2020 was lowered to 40% and for 2030 to 55%, yet, in view of the large global increase in carbon dioxide emissions in recent years, significantly larger reductions would be required. However, the current measures are hardly sufficient to meet even the very conservative government targets for 2020 and 2030. The gap between government goals, an effective climate protection path, and real developments threatens to grow even further.
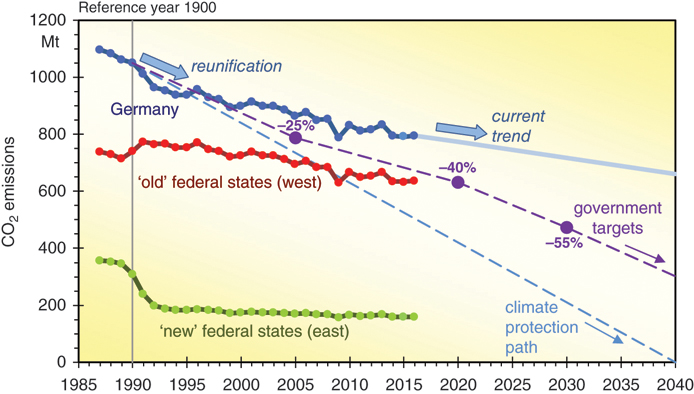
Figure 2.15 Energy and process-related carbon dioxide emissions in Germany.
2.4.2 International Climate Policy
In 1979 the main theme at the first UN Conference on World Climate in Geneva was the threat to the Earth's atmosphere. However, many special-interest representatives had fundamental doubts about the threat. So, it was initially agreed that further research would be needed before any particular measures could be considered.
In Rio de Janeiro in 1992 the members concluded for the first time that measures to protect the environment were now absolutely essential. The first targets for reducing greenhouse gas emissions were then agreed in 1997 for industrialized countries in the Kyoto Protocol. However, these goals were anything but sufficient for effective climate protection. Global greenhouse gas emissions continued to increase despite the Kyoto Protocol. The Paris Climate Protection Agreement of 2015 aims to stabilize the global rise in temperature to as little as 1.5 °C, if possible, involving all the countries of the world. To achieve this, however, greenhouse gas emissions would have to be reduced to zero well before the middle of the century, as already explained.
The Paris Climate Protection Agreement
The first world summit on climate, the UN Conference for Environment and Development (UNCED), took place in Rio de Janeiro in 1992. One result of the conference was the UN Climate Framework Convention on Climate Change (UNFCCC), where the signatories made a commitment towards preventing dangerous anthropogenic disruption to the climate system, slowing down global warming and lessening its consequences.
This rather vague agreement was followed by the Kyoto Protocol, which was drawn up in 1997 at the third conference of the treaty states of the UNFCCC in the Japanese city of Kyoto. It envisaged different reductions for the industrialized countries. The agreement expired in 2012 and only a few states reached their targets. Global greenhouse gas emissions continued to rise significantly despite the Kyoto Protocol, as the emerging and developing countries were not included in the agreement and many of the signatory states failed to honour their commitments.
In 2015, a new agreement was finally negotiated at the 21st Conference of the Parties to the UN Framework Convention on Climate Change (COP21) in Paris. The agreement came into force on 4 November 2016. The main goal is to keep the global temperature increase well below 2 °C and preferably not to exceed 1.5 °C. The agreement has been ratified by all states. However, under President Donald Trump, the US has announced that it will be the only country to withdraw from the agreement in 2020. Within the framework of the agreement, each country must implement self-defined measures that work towards the common goal and report every five years and, if necessary, intensify the measures. However, all the measures adopted so far at national level are still insufficient to keep global warming below the agreed limit values. Some countries, such as Germany, for example, are also clearly missing their self-imposed targets. It is to be hoped that the continuous negotiation process and the reporting obligations will increase the pressure continuously to achieve the goals and to continuously tighten the requirements in the sense of the agreement.
In the many industrialized countries, so far, the fight for our climate has been very tentative. Countries that have recorded definite reductions in greenhouse gas emissions include those that were formerly in the Warsaw Pact. The reason for this is due more to the economic upheavals of the 1990s than to a consistent policy on climate protection. (Figure 2.16). Despite the positive effects on emissions from reunification, Germany is only in the middle of the field in terms of emission reductions. Countries such as Canada and Australia, on the other hand, have even increased their emissions significantly.
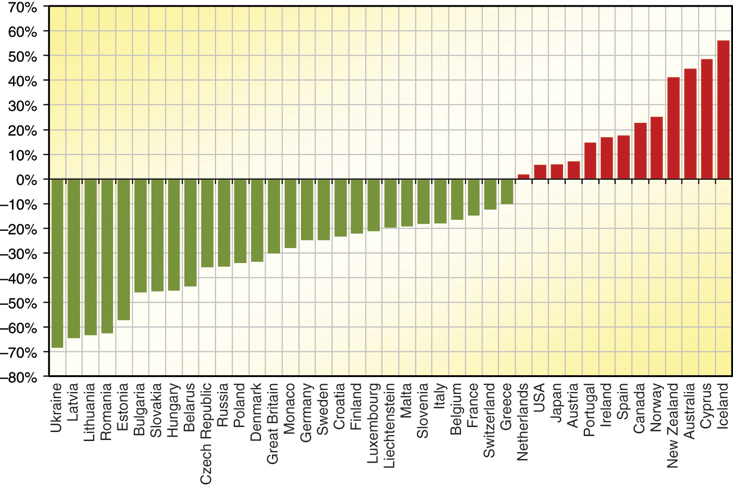
Figure 2.16 Changes in greenhouse gas emissions with no change in land use between 1990 and 2015.
Data: UNFCCC [UNF17].
Even though a number of Western countries such as Denmark, Sweden, Great Britain, and Finland have achieved significant savings, this is not enough for effective climate protection. The backlog in implementing alternative technologies in developing and emerging countries, many of which have more than doubled their emissions since 1990, is currently eating up all the savings we had previously made. Developed and developing countries can therefore only achieve effective climate protection with joint efforts. With a little hope, one can look to China, that has recently begun to make great efforts to protect the climate effectively.
However, the varying degrees of change in the individual countries in just a few years show that much is possible in terms of climate protection. With really serious climate protection efforts, it should still be possible to achieve the necessary reductions in greenhouse gases to limit global warming to well below 2 °C.
2.5 Self-Help Climate Protection
The governments of most countries today are taking a half-hearted approach to addressing the issue of climate protection. Certain special-interest groups would invariably suffer financially if consistent policies were pursued in this area. Therefore, these groups are trying to use their political influence to delay any serious implementation of climate protection measures. Reference is also often made to other nations that do even less for climate protection.
In extreme life situations such an approach seems unthinkable. Imagine a group of people sitting in a boat with a severe leak. Only by working together could the leak be sealed, and a disaster averted. But no-one does anything and everyone is discussing that one would only move towards the leak once everyone else gets up. Since this does not happen, everyone watches together as the boat slowly sinks. It is very likely that if one of them rolls up their sleeves and starts to plug the leak, the others will step in, one after the other, to help to prevent the catastrophe.
Therefore, climate change is no reason to lapse into lethargy. On the contrary: everyone has the chance to make a contribution towards protecting the climate. Savings of 50%, 80%, or even 100% in greenhouse gas transmissions are easily achievable right now. More and more people will then follow the good example, and the results of their efforts will help to protect the climate. But a single measure on its own is not enough to stop global warming. Instead it will take a combination of many different kinds of measures. These measures also drive investment in sustainable technologies and thus secure our long-term prosperity. Renewable energies in particular can play a major role here, as this book will show.
Active climate protection does not demand any major sacrifices. If everyone tried to implement the following measures, it would be enough to save the climate:
- Avoid buying products made of tropical woods that do not come from sustainable sources. The Forest Stewardship Council (FSC) label can help in a purchase decision.
- Avoid equipment and appliances (refrigerators, air conditioning units, heat pumps) containing coolants with HFCs because they contribute to the greenhouse effect. If such equipment is not available without HFCs (e.g. car air-conditioning systems or heat pumps), the buyer should put pressure on the manufacturer.
- Be consistent in recycling, reduce meat consumption, and increase the use of organic and local products.
- Avoid unnecessary consumption and buy durable equipment and products.
- Use public transport, bicycles, long-distance coaches, or trains, buy electric cars and avoid air travel.
- Be consistent in saving energy in all areas (see Chapter 3).
- Switch to an independent green energy supplier.
- Build and finance new renewable energy systems and installations (see Chapters 5–14).