CHAPTER 3
From Wasting Energy to Saving Energy and Reducing Carbon Dioxide
In modern industrial societies energy is still available at relatively moderate prices and without any restrictions. Whenever we want it, we can consume as much energy as we like. However, the general increase in energy prices in recent years has brought about a new awareness of the value of energy. High energy consumption is making more and more of an impact on our finances. Yet the equation is very simple: saving energy also means saving money. But the concept of saving energy is not totally new.
Until the 1970s it was accepted that real economic growth and increasing prosperity would also require the use of more energy. The concept of saving energy developed when the oil crisis of the 1970s led to an explosion in oil prices and put a brake on growth. Numerous tips, appeals, and stickers in the 1980s were aimed at encouraging citizens to save energy, and the trend towards stopping energy waste was indeed successful at the time. As prices started dropping again in the 1990s, the original goal was largely ignored, and energy was again thoughtlessly wasted (see Figure 3.1).

Figure 3.1 During the 1980s, energy saving was an important topic in Germany, and the “I'm an energy saver” sticker was a familiar sight. Rather ironically, it was particularly popular on gas-guzzling cars.
3.1 Inefficiency
High energy consumption is not a necessary prerequisite for maintaining our prosperity and our standard of living. In fact, energy use is coupled with enormous losses. Around 35% of the primary energy used is already lost in the energy sector through power plant waste heat or during transport even before it reaches the consumer. Various devices and machines then produce the desired usefulness, such as light, heat, and driving power for machines and vehicles. This too leads to high losses. Light bulbs and vehicle combustion engines are particularly inefficient and transform between 80% and more than 90% of the energy used into undesirable waste heat. Even ‘useful’ energy is often wasted, for example when lights are left on in empty rooms, poorly insulated buildings are heated, or people drive round and round the block to find a parking space (Figure 3.2). If one looks at all the losses incurred, it emerges that, at best, only 20% of original primary energy is being used efficiently (Section 3.1).
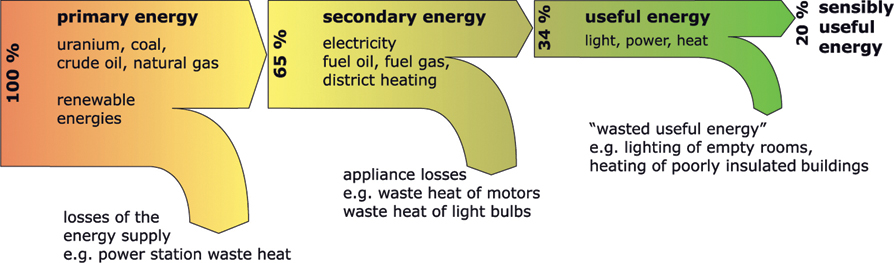
Figure 3.2 In Europe, around 80% of energy is lost or not used efficiently during transport or conversion.
When it comes to certain aspects of our lifestyles in industrialized societies, the percentage of energy used efficiently is even smaller still. However, the sort of person who tries to talk friends out of taking long flights or buying a new car with all the extras, or who keeps telling his family to turn down the central heating, tends not to be very popular. The choice of one's own lifestyle, finances permitting, is considered one of those individual freedoms that no one else has a right to influence. Therefore, saving the environment should not be about looking for scapegoats, but instead about seeking solutions that meet both lifestyle and environmental needs.
This does not mean that everyone can abuse his or her right to a certain lifestyle and thoughtlessly treat energy and the environment with disrespect. People are acting irresponsibly if they knowingly refuse to accept a technology that would enable them to retain their lifestyle but at the same time considerably reduce energy consumption and save the environment. This also applies to policies that do not strive towards a speedy introduction of the most optimal technologies.
Many small steps that could help create an environmentally compatible society are also not being implemented due to a lack of knowledge or appropriate awareness. Many of the problems related to energy use are extremely complex. Optimal solutions to these problems often depend on a number of different factors.
For example, one issue that is often debated is whether a gas or an electric cooker is more efficient. Compared to an electric cooker, a gas cooker produces more waste heat. Anyone who has ever scorched a potholder on a gas hob will be able to confirm this. Yet, gas has the reputation of being the ecologically better alternative. Conventional coal-fired, natural gas and nuclear power plants for the generation of electricity do not work efficiently. More than 60% of the primary energy used in these plants is lost as waste heat (Figure 3.3). If the electricity used to boil a litre of water comes from a coal-fired power plant, it is releasing 156 g of carbon dioxide. In contrast, burning natural gas on a gas cooker releases about 56 g of carbon dioxide. However, the losses that occur when gas is transported from the place of extraction to the end consumer are also a problem. Natural gas essentially consists of methane, which is considerably more damaging to the environment than carbon dioxide. Therefore, even the loss of a few grammes can be harmful. If transport losses are at the rate of about 10%, a gas cooker is still causing a lower rate of greenhouse gas emissions than an electric cooker using electricity generated by coal. However, the pipelines in the areas where natural gas is exploited are sometimes in very poor condition. The use of natural gas from these sources can completely cancel out the advantages of gas cookers.
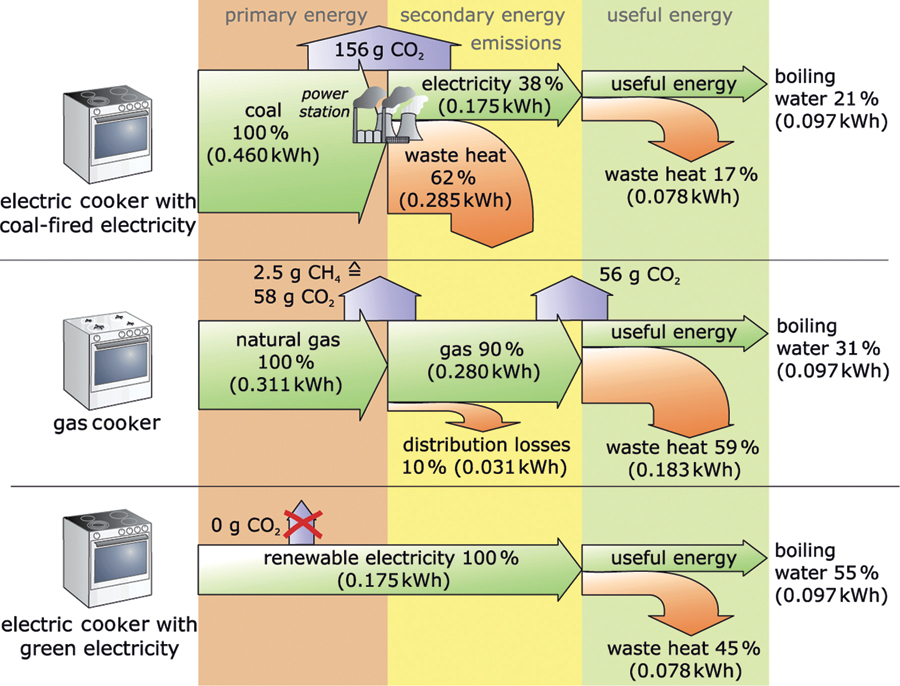
Figure 3.3 Energy and environmental balance of boiling water using an electric versus gas cooker.
In Germany, a gas cooker is a better alternative than an electric one, if the electricity comes from a conventional energy supplier. ‘Green’ electricity suppliers offer carbon-free electricity from renewable energy plants. Using this kind of electricity makes an electric cooker more environmentally-friendly than a gas cooker. In Norway, all electricity is supplied by renewable energy plants. In this case, electric cookers are generally the first choice. Finally, the use of an electric kettle to boil water is an efficient way to save energy and reduce carbon dioxide and puts the user ahead of the game.
![]()
|
Ok-Power label for ‘green electricity’ Green power label Information on changing supplier Suppliers of genuinely green electricity |
Anyone who worries generally about saving energy should first look at the sectors that use the most energy. What will come as a surprise to many is that private households in Germany use almost the same amount of secondary energy as industry and the transport sector do (see Figure 3.4). Over the last 20 years, no significant savings in final/secondary energy consumption have been achieved. In general, there are major fluctuations from year to year. But these are mainly due to the weather. Consumption is lower in mild winters and higher in cold winters.

Figure 3.4 Percentage of different sectors in final/secondary energy consumption in Germany.
Data: [BMWi18], 2016.
One reason for the stagnating energy consumption of households is the increasing number of electrical appliances. This increase is particularly noticeable in the areas of communication and entertainment electronics. But there are also many hidden energy guzzlers that have unnecessarily high energy use in standby mode. As the possibilities for saving energy in the household and transportation are particularly easy to implement, these options top the list of any analysis on energy savings.
3.2 Personal Energy Needs – Savings at Home
3.2.1 Domestic Electricity – Money Wasted
Europeans take the supply of electric energy so much for granted that we find it hard to imagine doing without electricity even for a short time. Televisions, telephones, computers, lights, refrigerators, washing machines and even heating do not function without electricity. It is hard to grasp, then, that around a billion people, one-seventh of the world's population, have no access to electric power.
In Germany, an average three-person household consumes around 3900 kWh of electricity at a cost of about €1100 yr−1. More than 10% of the carbon dioxide emissions from energy use in Germany come from the electricity needs of private households [UBA07]. Furthermore, inefficient electrical equipment accounts for a considerable percentage of electricity consumption. Anyone looking for ways to cut back on energy consumption can quickly find ways to save up to 30%, which equates to more than €300 a year. Therefore, protecting the climate can also pay off financially. An average US household consumes even more than 10 000 kWh yr−1. Hence, the potential for saving is much higher there.
 Standby Losses – Power Destruction Par Excellence
Many electrical devices work at low voltages. A transformer transforms down the mains voltage for this purpose. Most devices have a switch-off mechanism, but it usually only switches off part of the electronics in the lower voltage area. The transformer and major parts of the device electronics remain connected to the grid and continuously consume electricity, even when in a switched-off state; these are known as standby losses. As a result, over the course of a year a considerable amount of energy can be consumed even by low-power devices such as televisions. Power wasters like this can actually be identified using an energy consumption measuring device.
There are very few cases where, for technical reasons, a device should not be completely unplugged from the mains. Mains switches are a few cents more expensive than low-voltage switches. When large numbers of devices are involved, a manufacturer can easily save thousands of euros without fearing a loss of sales by installing the cheaper switches. Standby loss is currently not a major consideration in purchase decisions.
Computers and communication and entertainment electronics currently account for around one-fifth of electricity consumption in Germany and one-tenth in the USA. This kind of equipment often wastes electricity for no reason. Many devices have high standby consumption, which means they consume electricity even when turned off. A device with standby consumption of only 5 W uses a total of 43.8 kW h and costs €12 in electricity per year – just for the period when it is switched off and not being used at all. Some, usually older, devices even have standby losses of over 30 W. On average each household in Germany wastes around €120 yr−1 due to standby losses. The German federal environment office estimates that open-circuit losses in Germany cost about 5 billion euros per year and produce 14 million tonnes of carbon dioxide. This is more than seven times the amount of carbon dioxide emitted through energy use by the 20 million inhabitants of Mozambique.
This is something that is very easy to remedy. By using a switchable multipoint plug for their computer, television and stereo system, consumers can reduce their open-circuit losses in a switched-off state to zero. When buying new devices or equipment, consumers should ask questions about standby consumption values so that more pressure is placed on manufacturers to fit power-saving switches.
Around 10% of the electricity used in private households in Germany is for lighting. In the USA the percentage is about the same (see Figure 3.6). Here, too a great deal of energy, and money, is wasted. Due to inertia and unfounded prejudice against energy-saving bulbs, millions of conventional electric light bulbs are still being used. This is not only damaging the environment but also costing money. Modern low-energy or LED light bulbs produce the same amount of brightness using 80% less electricity. In contrast to first-generation low-energy light bulbs, advanced LED lamps do not contain mercury, and there is no irritating warm-up delay. An 11-W LED lamp or low-energy bulb saves about one cent an hour. If this kind of light bulb burns for two hours each day, the savings amount to seven euros a year. Over its lifetime a low-energy light bulb can save €150 and 300 kg of carbon dioxide. Therefore, the higher purchase cost is rapidly recouped. Good-quality LED lamps or low-energy light bulbs also tolerate frequent on- and off-switching well. Tiny, dimmable light bulbs open up possibilities to all kinds of uses (Figure 3.5). A consistent climate protection approach should include a gradual replacement of all light bulbs with LED lamps.

Figure 3.5 Low-energy light bulbs save energy, carbon dioxide and cash. LED lamps are particularly environment-friendly substitutes for conventional incandescent lamps.
Photos: OSRAM, Siemens press photo.
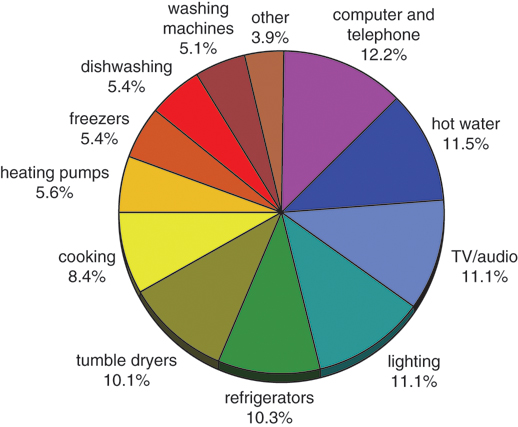
Figure 3.6 Breakdown of electricity consumption of private households.
Data: [Ene06].
Electric water heating is relatively expensive. Anyone who has an electric boiler should switch it off when leaving the house for long periods.
A considerable amount of energy can also be saved with large electrical appliances, such as washing machines, dishwashers, refrigerators, and freezers. Efficiency should be an important criterion, especially in the selection of new appliances. Energy efficiency rating labels and the consumption values included with these labels provide an indication of the efficiency and economy of use of the different appliances.
Unfortunately, the efficiency ratings have not always provided clarity in the past. The original intention was to assign the letter A to efficient devices and less efficient devices the letters B to G. Since the devices have been increasingly improved in recent years, those having an efficiency rating A had become average at best. Better devices were assigned new efficiency ratings from A+ to A+++. It was not easy to keep track. The best washing machines were able to beat the values required for A+++, while for a long time A+ was the best for LED lamps. In order to end the confusion, the EU has decided to return to the old labelling with the letters A to G from 2019.
In any case, if you always buy the most efficient appliances, you can save a lot of money and carbon dioxide over their service life. If you are unsure about how much energy a device or appliance consumes, there are energy-saving monitors available for hire or purchase, which test appliances for energy waste. It is advisable to take particularly inefficient appliances out of service as quickly as possible.
![]()
List of efficient households appliances Overview of efficient appliances Electricity saving tips |
A savings potential also exists in the way household goods are used. If a refrigerator is standing right next to a cooker, it must work harder because of the heat loss from the cooker. Refrigerators with poor ventilation and iced-up freezer compartments also use a large amount of extra energy. A lid on a pot when cooking can save an appreciable amount of energy, as can a pressure cooker. Selecting the lowest temperature possible on a washing machine or a dishwasher saves energy and money. With tumble dryers the laundry should first be spun at the highest spin speed available. But the good old clothes line is the best option for saving energy.
The following energy-saving tips summarize the key points discussed:
- Track energy guzzlers using an energy consumption measuring device.
- Switch off unnecessary electrical devices and lights.
- Switch off all devices with standby mode using a switchable multipoint switch.
- Replace incandescent light bulbs and halogen lamps with LED lamps.
- When buying electrical goods, pay attention to their energy consumption ratings.
- Always buy the most efficient domestic appliances.
- Do not place freezers next to heat sources (ovens, radiators).
- Try to thaw frozen goods in a refrigerator.
- Defrost refrigerators and freezers regularly.
- Only run washing machines when they are full and operate them at the lowest possible temperature and set to a high spin speed.
- When cooking, use lids on pots and frying pans, or use pressure cookers.
In many countries the lion's share of secondary energy consumption in private households comes from heating. Around three-quarters of secondary energy in households is used for this purpose. However, reducing heat in a home does not necessarily mean having to cope with frosty temperatures. With good insulation and modern building technology, pleasant room temperatures can be achieved with energy savings of up to 90%. In other words, 10 energy-efficient buildings can be kept warm with the same amount of energy it takes to heat the average poorly insulated old house. At the same time the carbon dioxide emissions and heating costs drop to one-tenth. Many people live in rented accommodation. This can cause a dilemma, because energy-saving measures are usually linked to investment. This is a cost that the landlord first has to bear, with the renters becoming the beneficiaries – and because they did not pay for the measures in the first place, they do not have any particular incentive to implement them. However, from the standpoint of saving energy, even actual homeowners lag behind, when it comes to making use of the options that are available. Yet, not all energy-saving measures cost money. The following changes to heating behaviour can save a considerable amount of heat energy and, consequently, reduce heating costs:
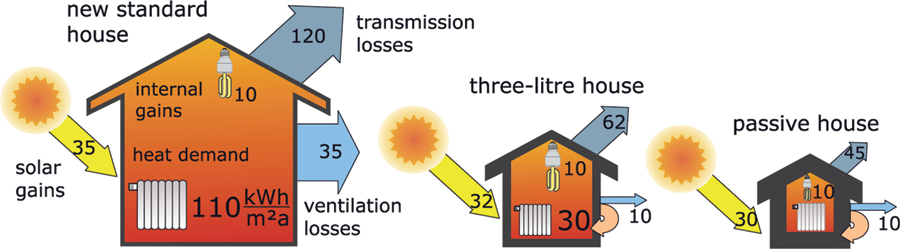
Even minor investments can help reduce energy use considerably. Appropriate measures can include draught-proofing windows and doors and upgrading thermostat valves. In the case of three-litre and passive houses, heating requirements can be slashed to as little as one-tenth of what is normally needed in conventional houses. The heating required in an average apartment block in Central Europe is around 150–200 kilowatt hours per square metre of living area per year (kWh/(m2 a)). Old buildings with poor insulation can even show usage values of over 300 kWh/(m2 a). In contrast, a three-litre house only needs 30 kWh/(m2 a), whereas a passive house gets by with even less than 15 kWh/(m2 a) (Figure 3.7). Figure 3.7 Comparison of heating energy demand and heat loss in houses with different insulation standards in kilowatt hours per square metre of living area per year in Central European climates (kWh/(m2 a)). Anyone interested in building a low-energy house will first have to grapple with a variety of different terms and concepts that sometimes confuse even the experts. The following should help to unravel some of this confusion. … Building insulation and window type have an important effect on heating energy demand (Figure 3.8). The U-value is a comparison value for the quality of heat insulation. This value indicates the heat loss per square metre of wall and window space and per degree of temperature difference between indoors and outdoors. Low U-values therefore mean low heat losses. Figure 3.8 Effect of window type and insulation on heat loss. Compared to non-insulated outer walls, walls with high-value heat insulation can achieve a reduction of the U-value by more than a factor of 10 in an optimal case. Conventional insulation against heat loss of around 20 cm would be required. This is easily achievable with prefabricated houses using a wood frame construction. Vacuum-insulated materials with a thickness of around 2 cm that provide the same insulation results have recently been developed. With this type of insulation a core material of pyrogenic silicic acid is packed and evacuated into an airtight foil. It is important that the special foil of the vacuum heat insulation prevents any air from seeping in over long periods of time. However, this insulating material is quite expensive. Along with the insulation of the walls, the structure of the windows is also an important element. Compared to conventional thermal double glazing, triple glazing can reduce heat loss from windows by over 40%. Vacuum glazing is a new technology on the market in which air is evacuated from the gap in the double glazing to create a vacuum. A perfectly sealed edge prevents any penetration of air. Small spacers set between the layers of glass provide the necessary stability, so that the exterior air pressure does not crush the two glass panels together. Spacers made of glass are hardly noticeable. In addition to the type of glazing selected, the type of window frame is also important. Therefore, for the U-value a differentiation is made between a UG-value (g for glass) for the actual glass panel and the UW-value (w for window) for the whole window, including the frame. Some manufacturers only provide a general U-value. In most cases, they mean the UG-value. Windows are not just sources of heat loss. They also let in sunlight, which in the winter helps to heat rooms. For an optimization of solar energy gain, south-facing windows in colder climates in the Northern hemisphere should be as large as possible, whereas those facing north should be smaller. Exterior shutters or blinds on the sunny side are important to prevent well-insulated buildings from becoming too hot in the summer. Buildings with optimal insulation are comparatively airtight. For good air quality in the winter, fresh air should be let into rooms frequently. But airing rooms also causes considerable heat loss. This is remedied through the use of controlled building ventilation systems (Figure 3.9). Fans blow fresh air into living areas and extract stale air from kitchens and bathrooms. The stream of fresh air is run from outside through a cross-heat exchanger past the exhaust air. The stale air emits up to 90% of its heat to the cold, fresh air from outside, thereby keeping the heat in the building. Figure 3.9 Principle of control ventilation with heat recovery. Controlled ventilation is often perceived as having a negative effect on living conditions, but the opposite is actually the case. A gentle draught from such a system is barely noticeable. Constant optimal ventilation prevents dampness forming in walls or mould building up. An air filter in the ventilation system will keep out some of the pollutants in the outside air and also make it difficult for insects to get inside. Of course, anyone who feels that it is necessary can open the windows anyway – even if this is really no longer necessary from a practical point of view. An air supply system can also be combined with a ground heat exchanger. This involves laying a pipe through the soil in the garden to supply incoming air. In winter the soil heats the fresh air and in summer it cools it. An ultra-high energy-saving house requires an outlay of additional costs, but over the years these costs pay for themselves as energy prices rise. In some countries, such as Germany, banks offer particularly good low-interest loans to promote energy-saving measures in new houses and in the renovation of old buildings.
Independent energy-saving advice Passive House Institute Information on KfW Bank programmes In principle, those who want to keep heating requirements carbon-neutral have the following options:
Solar thermal systems usually supplement other types of heating. Later chapters in this book discuss these different variants in detail. As the potential for certain possibilities such as biomass heating is limited in many countries, the other options for saving energy described above should be implemented as far as possible before renewable energies are used. The transport sector is responsible for about one-fifth of carbon dioxide emissions from energy use. Whereas it seems that major savings can be achieved relatively quickly with electricity use and in heat generation, the transport sector is more problematic. In recent years increased mobility and the travel bug have managed to cancel out any savings in the fuel consumption of cars and aeroplanes. Cheap airlines that sometimes offer plane tickets for the price of an underground fare, and the trend towards petrol-guzzling SUVs, are prime examples of this development. Added to this are the even longer distances involved in transporting goods around the world as a result of globalization. Turning back the clock and reducing the number of cars, planes, trucks, and ships would be a hopeless undertaking. Modern economies and modern lifestyles have become so fast-paced that they demand increased mobility. Holidays tend to be short, so air trips are necessary in order not to eat into travel time. Weekend breaks by air provide relaxation in hectic schedules. Our economic growth also is based on high levels of exports and reasonably priced raw materials, both of which are associated with long-distance transport. Nevertheless, to reduce carbon dioxide emissions, we simply must transfer them from A to B using less energy. In the medium term, carbon-free transport must be available to cut out emissions completely. Selecting the right means of transport is the best option for a quick reduction in energy requirements and emissions in traffic. For example, per passenger kilometre the secondary energy requirement of a train is less than one-fifth that of a car. To compare the two modes of transport, the energy consumption of the train is divided by the average number of passengers. While the railways in Norway or Switzerland are already almost climate-neutral due to the high proportion of hydropower, rail traffic in Germany still generates significant emissions (see Figure 3.10). This is because over 30% of the electricity used by trains comes from climate-damaging coal-fired power plants. In 2016, around 17% of the electricity came from nuclear power plants and more than 40% from renewables. Figure 3.10 Energy consumption and greenhouse gas emissions per person for different means of transport with an average use load (data for trains is estimated from the German electricity grid). The calculations shown here are based on average values. The average carbon dioxide emissions of new cars in Europe are currently around 120 g of CO2 per kilometre. Older vehicles and thirsty new cars have higher emissions, whereas economical small cars sometimes have considerably less. In addition, greenhouse gas emissions are generated proportionately during oil extraction, fuel production and fuel transport. Not only the type of car, but also the way in which it is driven has a major impact on how much petrol is consumed. The following energy-saving tips will enable savings of up to 30%:
The capacity utilization of a car has the biggest effect on energy use. On average three to four seats in a car are empty when it is being driven. With four people in a vehicle and careful driving, the carbon dioxide emitted per person can be even lower than with a train. Capacity utilization also plays an important role with other forms of transport. Trains have particularly low energy consumption. As the utilization of local public transport is on average lower than that of long-distance transport, carbon dioxide emissions are also slightly higher here. A coach filled to capacity is particularly economical in energy use. Air traffic produces the highest carbon dioxide emissions. Long-haul flights cause the most harm to the climate, because the exhaust gas of planes is more damaging when emitted at high altitudes. If this factor is calculated into carbon dioxide emissions, these rise to 400 g km−1. The car industry is investigating numerous solutions to enable climate-neutral mobility in the medium and long term. These include:
Although the natural gas vehicles currently being marketed emit slightly lower levels of carbon dioxide than before, they really do not offer an alternative for protecting the climate worldwide. Biofuels may be able to replace oil relatively easily and are sometimes added to conventional fuels. However, the problem is that not enough biomass is available to provide an adequate supply. Even if all the farmland in places like Germany and Britain were used to plant the raw materials needed for biofuels, this would not come close to covering the current fuel needs of motor vehicles in those countries. On closer inspection, even renewable hydrogen poses some problems. (Biofuels and hydrogen will be covered in detail in Chapters 12 and 13, respectively.) Until now the main obstacle to electric cars has been limited battery life. Long charging times and the short distances that can be driven on a single charge are preventing the widespread use of these cars. In the meantime, however, enormous progress has been made, making electric cars an interesting alternative. The only way to achieve climate neutrality in transport by 2040 is to switch consistently to e-mobility. Assuming a service life of 15 years for cars, the last car with an internal combustion engine should actually roll off the production line in 2025. In order for e-mobility to offer a real alternative from a climate protection perspective, however, the electricity used to charge the batteries and manufacture the electric cars must come from renewable power plants. It is widely believed that industry and the energy companies are mostly to blame for greenhouse gas emissions and so private individuals cannot do much about the problem. But looking at the situation more closely, one sees that they are only complying with what the customers want. Therefore, ultimately it is the consumers who are responsible for the emissions because of the products they are demanding. If all electricity customers were to switch to suppliers or tariffs that only offer electricity from renewable energies, the power supply would very quickly be carbon dioxide free. The only problem the energy suppliers would then have is being able to build enough renewable power plants as quickly as possible to accommodate this sudden demand. Due to their choice of products, consumers are failing to exert pressure in the right places for a sustainable type of economy. The production of any type of product – whether a food item or consumer goods – requires energy and therefore causes carbon dioxide emissions. The higher one's personal consumption, the higher the use of energy and the higher the carbon dioxide emissions. Yet even those who completely renounce consumption will not be able to reduce their energy needs to zero, because high emissions are caused during practically all food production. Each consumer can have an important impact on indirect energy consumption through product selection:
Even if users follow all the energy-saving tips provided, they will probably find that the carbon dioxide emissions for which they are responsible are still quite high. This section enables readers to do a self-assessment by explaining how to calculate the carbon dioxide emissions an individual is personally responsible for. The easiest way to determine which emissions are the result of one's own activities is to look at how much oil, natural gas, petrol and electricity one has used. It is relatively simple to establish the amount of energy consumed per year by checking bills and invoices:
Based on this information, the following calculation method can be used to determine the emissions resulting from one's own activities. The average values for Germany are highlighted and can be overwritten with your own values. Specific consumption values may have to be adapted to a person's own particular circumstances. In electricity generation in Germany on average 0.566 kg of carbon dioxide is produced per kilowatt hour (kg CO2/kWh) of electric power, and the value in the USA is roughly the same. Those who get green electricity from renewable power plants can cut their emissions from electricity consumption to zero. In Germany, all electricity suppliers are obliged to inform their customers about the composition of the electricity supplied and its environmental impact. The precise CO2 emission values per kilowatt hour should therefore be available from the electricity supplier. Emissions from heating can vary considerably. If heat is generated electrically, the emissions are the same as explained under electricity. Modern natural gas heating systems produce 0.2 kg CO2/kWh of heat, modern oil heating systems 0.28 kg CO2/kWh. With old, inefficient heating systems the emissions can rise from 0.25 to 0.35 kg CO2/kWh. Heating with biomass at most generates indirect carbon dioxide emissions due to processing and transport. With wood pellets the value is around 0.06 kg CO2/kWh. The carbon dioxide emissions specific to a person's own car can be calculated on the basis of average fuel consumption (see Planning Guide, p. 85). With air travel an emissions calculator makes it relatively easy to calculate emissions precisely, according to air route.
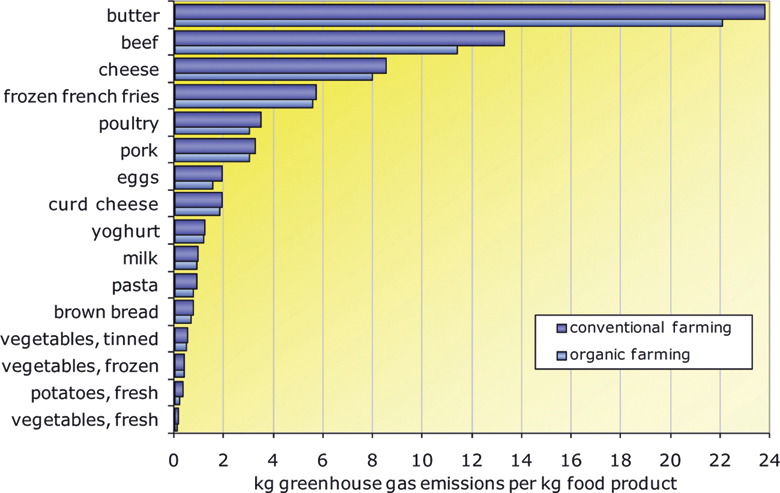
Atmosfair emissions calculator for flights Comparison of means of transport Comparison of means of transport In addition to the emissions a person has caused directly, everyone is also indirectly responsible for other emissions. Energy is consumed in the production, processing, and transport of foodstuffs, consumer goods, and other products, and this in turn causes carbon dioxide emissions. The public sector, including government offices, schools, the police, the fire brigade, as well as the departments responsible for highway maintenance, also need energy and therefore cause carbon dioxide emissions. About one-sixth of emissions are attributed to public consumption. This is an area where there are not many possibilities to make personal reductions. About 1.3 t of carbon dioxide per person is produced every year due to our individual food consumption. Figure 3.11 compares the greenhouse gas emissions of different foodstuffs. In addition to carbon dioxide, the chart takes into account other greenhouse gases, such as methane and nitrous oxide, and converts these values into carbon dioxide equivalents according to how harmful they are to the environment. Beef, butter, and cheese do not come out favourably. Ruminant cows release large amounts of methane that have a high greenhouse effect. Subsequent freezing of the meat also adds to the energy toll, so that people who prefer frozen meat to fresh meat increase greenhouse gas emissions by another 10–30%. Figure 3.11 Greenhouse gas emissions converted to CO2 equivalents for the production of different foodstuffs. Data: [Fri07] The amount of processing that food requires also has a considerable effect on the climate. For example, fresh potatoes hardly tip the scales of greenhouse gas emission. However, the energy-intensive further processing required to make frozen French fries increases the greenhouse gas emissions contained per kilogram of food almost 30 times. As women normally eat less than men and older people eat less than young people, clear differences exist from person to person. Going on a permanent diet is certainly not the right approach to reducing carbon dioxide emissions. However, people who buy seasonal products from local organic farms, reduce their consumption of meat, and largely avoid tinned and frozen foods can significantly reduce emissions resulting from food intake. Reductions of up to 30% can easily be achieved this way. However, those who need a large number of calories, because they do a lot of physical work or sport, and then obtain these calories mainly from frozen products and fast foods, could find they double their greenhouse gas emissions just from what they eat. Personal consumption is responsible for around 2.9 t of carbon dioxide. This is mostly from the production, storage, and transport of all products that do not fall under the category of food supply. Included in this group are clothing, furniture, machines and equipment, paper products, cars, and housing. Each German uses about 240 kg of paper each year, each Briton 200 kg or more, and each US citizen around 300 kg. The production of 1 kg of new paper produces about 1.06 kg of carbon dioxide. This means that almost 10% of personal consumption is attributed to the use of paper. The energy consumption with the production of recycled paper drops by around 60% and the carbon dioxide emissions by about 16%. Whereas recycled paper was very popular in the 1980s, many distributors no longer carry it at all – even though its benefits to the environment have not changed. The reason is weak demand on the part of the consumer because of unfounded claims that recycled paper destroys printers and copiers and is even damaging to one's health. The rule generally is that anyone who is a consumer is also contributing to high emissions. On average around 4–5 kg of carbon dioxide is created for each euro spent by consumers. Here, too there are many ways to make reductions. High-quality long-life products almost always produce low amounts of carbon dioxide. Although they are usually more expensive initially, in the long run they actually protect the wallet as well as the environment because of their long useful life. Increasing the use of natural materials may not always be less expensive, but it does usually reduce greenhouse gas emissions. For example, building a new solid house is almost as expensive as putting up a prefabricated house. However, if a wood frame construction is used for the prefabricated house, the additional use of wood as a building material will save around 20–30% in carbon dioxide emissions. As a result, the savings potential quickly runs into several tons. In the following calculation method, the indirect greenhouse gas emissions can be inserted in the spaces shown. With the exception of public consumption, the average values are again highlighted in a lighter and can be changed individually upwards or downwards.
Once the personal direct and indirect emissions have been determined, they can be added up to get a figure for all personal carbon dioxide emissions. At 9.6 t, almost 10 t of carbon dioxide per capita and year were still generated on average per person in Germany in 2015. In Great Britain the figure is 8.9 t and in the USA more than 19 t. If other greenhouse gases, such as methane and nitrous oxide, are taken into account and converted into carbon dioxide equivalents based on how damaging they are to the climate, then the total greenhouse gas emissions in Germany increases to more than 11 t per head per year. These results are, however, limited to carbon dioxide.
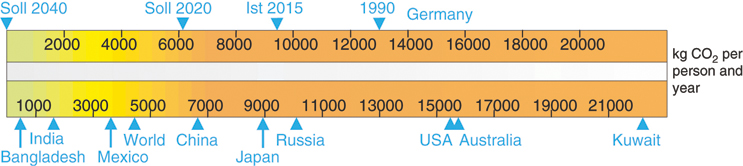
An even more precise calculation of personal emissions can be made using the emission calculators on the Internet. Figure 3.12 enables a comparison of one's own carbon dioxide emissions with the reduction targets and emissions of other countries. The colour scale in the figure shows how the emissions should be evaluated. Figure 3.12 Scale of emissions of carbon dioxide per head and year.
We may be able to make major reductions in our own direct and indirect emissions. However, in most industrialized countries it will still be relatively difficult to move emission levels into the ‘green’ zone. Some emissions, such as those related to public consumption, lie well beyond one's personal sphere of influence. Other reductions can only be achieved through radical changes in lifestyle or relatively high investment. People who still want to make further reductions can use the emissions trade to compensate for their own emissions. This idea is even being practised on a large scale by states that want to reduce their overly high emissions as part of their commitment at the international level. The modern emissions trade is slightly reminiscent of the Medieval church's practice of selling indulgences. However, as the expression ‘sale of indulgences’ has negative connotations, the term joint implementation (JI) was invented. Whatever is planned on a grand scale at the state level, and has partially already been implemented, can also be done in the private sphere. For instance, you could give your neighbour an inexpensive low-energy light bulb as a gift. This bulb could save up to 300 kg of carbon dioxide emissions over its lifetime. If you gave away enough low-energy light bulbs, you could conceivably save your total emissions in another area – at least theoretically. The actual personal emissions continue to accumulate and would then have to be transferred to the emission results of your neighbour. In pure calculation terms, the neighbour's emission results would remain constant. However, if the neighbour's emissions are also too high, he will not have an easy option for reducing his emissions himself. Furthermore, due to the savings in electricity costs, the neighbour will end up with more money in his household budget. If he then invests this money in a couple of litres of petrol for an extra jaunt in the car, then the whole exercise has ended up being highly counterproductive. The situation is different if a low-energy light bulb is given to a school in a developing country with emissions in the green zone. In this case the gift of the light bulb will reduce already low emissions even further. Naturally the prerequisite even here is that the school is not in a position to buy the bulb itself. If the school is already planning to buy a low-energy bulb as an example of reducing electricity costs, the bulb given as a gift will not really represent a savings effect. Practised on a large scale, this type of investment is known as the Clean Development Mechanism (CDM).
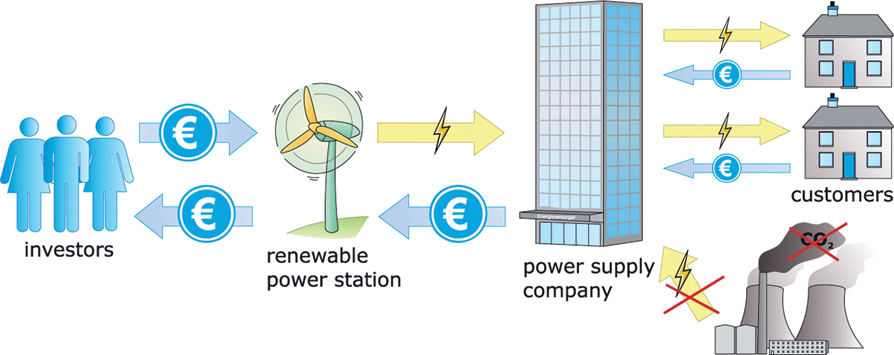
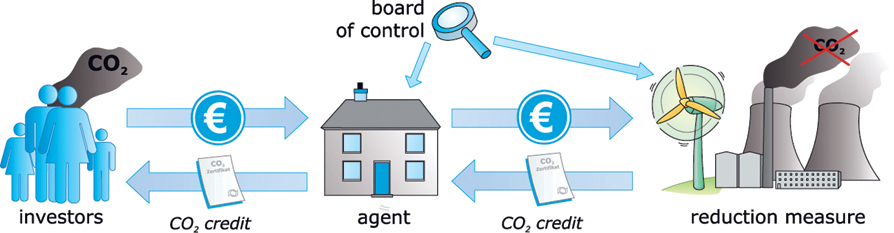
It is difficult for a private individual to meet these criteria. However, various companies offer professional services for implementing climate-protecting projects. Even major projects are possible if a large number of customers join forces. However, an independent auditing authority should always be available to monitor that the process is being followed correctly (Figure 3.13). Atmosfair is an example of a company that offers a programme for offsetting emissions from plane trips. One of the projects in their programme involved replacing diesel stoves in large kitchens in India with solar mirrors. Figure 3.13 Principle of private emissions trading. Currently about €20–30 should be allocated to compensate for the emission of 1000 kg of carbon dioxide with clean development projects. Thus, it will cost a person €10 each month to prevent the emission of 5000 kg yr−1. Protecting the climate is really not that expensive. Naturally emissions can be offset through renewable energy projects at home. In countries such as Germany, for example, anyone who invests in a wind farm in a good location or installs a large photovoltaic system on an optimally orientated roof can even make a small profit. Germany's Renewable Energy Sources Act (EEG) makes this possible. This law establishes the subsidy levels for electricity from renewable energy suppliers, such as wind farms, photovoltaic systems and biomass, geothermal and hydropower plants. These subsidy levels are normally higher than regular subsidies for electricity from conventional power plants. The energy supply company into whose grid the plants feed their electricity is allowed to split the extra costs among all its electricity customers (Figure 3.14). This means that all customers – whether they want to or not – are helping to finance the renewable energy plants. Figure 3.14 Principle of financing renewable power plants through the Renewable Energy Sources Act (EEG) in Germany. These power plant projects thus reduce the average emissions of electricity generation in Germany. However, they cannot be used to improve one's own carbon footprint. Although an investment in a renewable energy plant for electricity generation in Germany bears the entrepreneurial risk, the financing of a plant running according to plan is the responsibility of the general public. Anyone in Germany who wants to improve their own CO2 balance and not that of the general public by building a renewable energy plant must invest in plants whose remuneration is not regulated by the Renewable Energy Sources Act. However, this does not mean that most investments in renewable power plant projects in Germany would be pointless. On the contrary, the German Renewable Energy Sources Act is the most successful instrument worldwide for promoting the rapid development of renewable energy. It aims to involve everyone equally in the social task of restructuring the energy sector – be it as investor, operator of renewable energy plants or financier for the reimbursement of electricity from existing plants.3.2.2 Heat – Surviving the Winter with Almost No Heating
![]() Not All Low-Energy Houses Are Equal
Not All Low-Energy Houses Are Equal


![]()
3.2.3 Transport – Getting Somewhere Using Less Energy

![]() Determining Carbon Dioxide Emissions Based on Fuel Consumption
Determining Carbon Dioxide Emissions Based on Fuel Consumption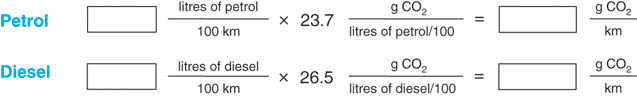
3.3 Industry and Commerce – Everyone Else is to Blame
3.4 Your Personal Carbon Dioxide Balance
3.4.1 Emissions Caused Directly by One's Own Activities
![]() A. Calculation of Annual Private Direct Carbon Dioxide Emissions
A. Calculation of Annual Private Direct Carbon Dioxide Emissions
![]()
3.4.2 Indirect Emissions
![]()
Paper recycling initiative
![]() B. Calculation of Annual Indirect Carbon Dioxide Emissions
B. Calculation of Annual Indirect Carbon Dioxide Emissions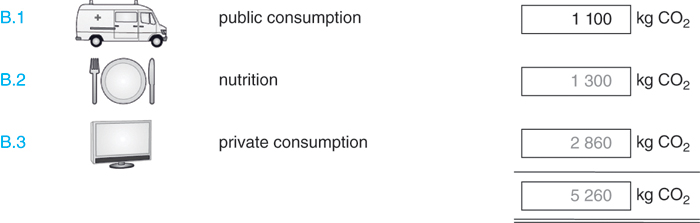
3.4.3 Total Emissions
![]() C. Calculation of Annual Total Personal Carbon Dioxide Emission
C. Calculation of Annual Total Personal Carbon Dioxide Emission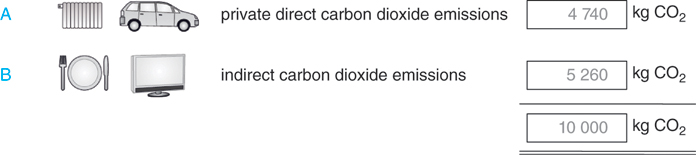
![]()
Online CO2 calculators for Germany
3.5 The Sale of Ecological Indulgences
![]()
Various services for reducing carbon dioxide emissions through climate-protection projects