Lesson 14 Sorting, Filtering, and Summing Up Line-item Reports
This is the first of two lessons on customizing the layouts and contents of line-item reports. It deals with the procedures for sorting, filtering, and summing up their data.
Line-item reports are the typical format for the output of list-display transactions, which generate lists of related objects (see the Coda at the end of this book) as well as the hit lists of code searches (see Lesson 10). They are also found on the initial and output screens of some create, display, and change transactions, including many purchasing and human resources transactions.
Each row in a line-item report displays the data about a single object, such as a vehicle, material, or business expenditure. The data are arrayed in columns, which are capped by headers that identify the data, and the rows are usually organized vertically by default according to the contents of the first column.
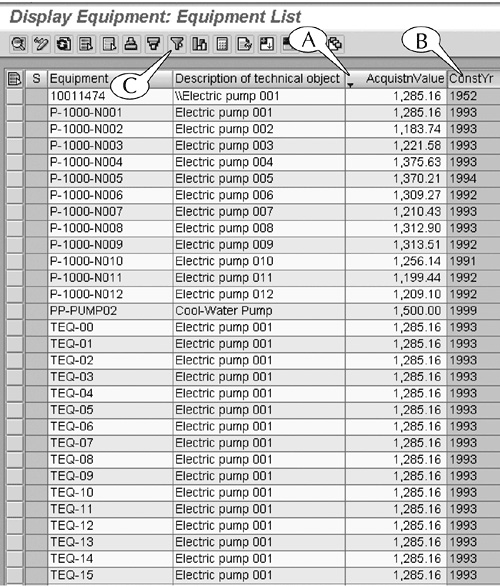
For example, we demonstrate some of the procedures in this lesson on the output of the IH08 list-display transaction. This output consists of a line-item report on mechanical equipment that is operated and maintained by physical plants in a company. When we run this transaction for plants in our company, the default output contains four columns of data (Figure 14.1):
![]() Equipment (that is, an equipment type code)
Equipment (that is, an equipment type code)
![]() Construction Year
Construction Year
![]() Description of technical object
Description of technical object
![]() Acquisition value
Acquisition value
Figure 14.1 The default version of the output of the IH08 transaction is a line-item report with four columns of data. Each line displays the data on one piece of equipment.

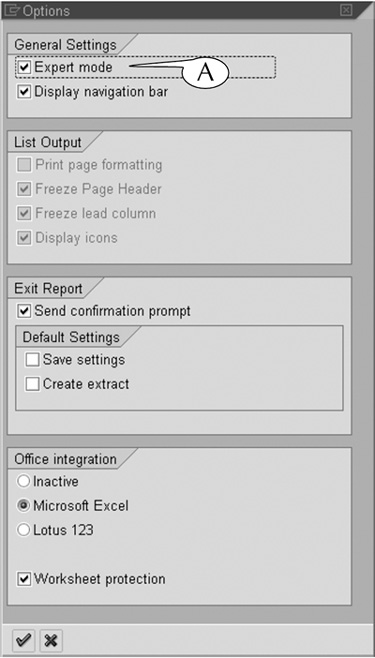
However, you can change the default layout and content of a line-item report directly on its output screen in several ways. For example, we customized our sample report in these ways, which are shown in Figure 14.2.
![]() We arranged or sorted the line items in order of their equipment code, then clustered those line items with the same code so that they appear as groups in the first column.
We arranged or sorted the line items in order of their equipment code, then clustered those line items with the same code so that they appear as groups in the first column.
![]() Within each group, we sorted the line items in order of their construction year, then clustered those line items with the same construction year so that they appear as subgroups in the second column.
Within each group, we sorted the line items in order of their construction year, then clustered those line items with the same construction year so that they appear as subgroups in the second column.
![]() We filtered the report to eliminate line items with an acquisition value of less than $1,000. (Notice the absence of any dollar value less than $1,000 in the Acquisition value column.)
We filtered the report to eliminate line items with an acquisition value of less than $1,000. (Notice the absence of any dollar value less than $1,000 in the Acquisition value column.)
![]() We attached a grand total for the acquisition values of all the equipment to the very bottom line of the report (A).
We attached a grand total for the acquisition values of all the equipment to the very bottom line of the report (A).
![]() We subtotaled the acquisition values for each equipment-code group (for example, B) and construction-year subgroup (for example, C).
We subtotaled the acquisition values for each equipment-code group (for example, B) and construction-year subgroup (for example, C).
Figure 14.2 Our version of the output of the IH08 transaction, after we customized the line-item report with filters, sorts, and sums.

We demonstrate in this lesson the procedures for customizing line-item reports in these ways, using examples from several initial screens, output screens and the hit lists of search screens.
The sorting function rearranges the rows of line-item reports according to the contents of one or more selected data columns (which we call the sorting columns). You can rearrange these rows in either alphanumerical (for example, A to Z or 1 to 1000) or reverse alphanumerical order in one of two ways.
The first method makes use of the Sort ascending (A) and Sort descending (B) buttons (Figure 14.3). We demonstrate their use in the next three examples.
Our first example demonstrates a single-column sort on the output of the Cost Center Actual/Plan/Variance (A/P/V) transaction1 (Figure 14.4). This transaction displays the budget of a department (or cost center) in a line-item format.
Figure 14.4 The default output of the Cost Center Actual/Plan/Variance transaction, with the rows sorted in order of increasing cost element code.

Each row of the A/P/V report shows the budget for a single cost category or cost element, which is identified in its first column (Figure 14.4). Each row displays the actual and planned costs for a cost element and the difference or variance between them in dollar values and percentages. The report is organized in order of the cost element code, which ranges from 400000 to 799000. This sorting column (the first) is automatically highlighted to distinguish it from the other data columns.
We can sort the contents of this line-item report according to the contents of another column by using the Sort ascending and Sort descending buttons in its application toolbar (A). For an example, we can rearrange the rows in order of their actual costs, with those rows with the highest costs at the top of the report and those with the lowest at the bottom, by following this two-step procedure.
Procedure
Single-Column Sort of a Line-item Report
Step 1. Click the header of the Actual costs column (Figure 14.4B) to select and highlight it.
Step 2. Click the Sort descending button.
This procedure reorganized the report so that its rows are organized in order of descending actual costs (Figure 14.5). In addition, it placed a sort-descending icon in the header of the Actual Costs column (A) to indicate that the report is arranged in that order.
Figure 14.5 The customized output of the Cost Center Actual/Plan/Variance transaction, with the rows sorted in order of descending actual costs.

End Procedure
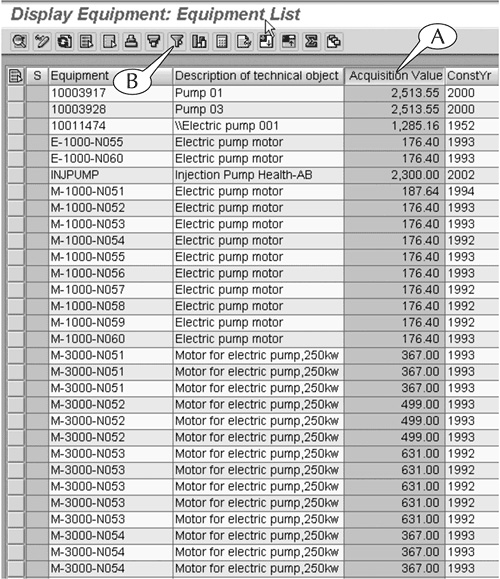
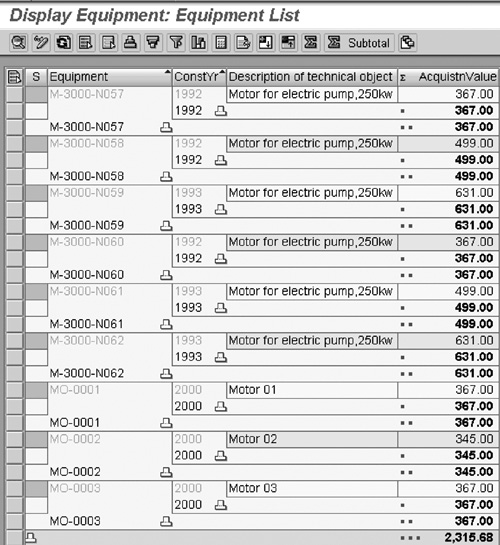
This second example demonstrates a multiple-column sort on the output of the IH08 transaction, which displays data about equipment in a line-item format. The rows in the default version of this report are organized in order of the equipment code, which appears in the first column (Figure 14.6).
Figure 14.6 The default output of the IH08 transaction, with the rows sorted in order of increasing equipment code.

We can rearrange this report so that the rows are organized first in order of increasing equipment code (we will call this the “primary sorting column”), then in order of increasing construction year (we will call this the “secondary sorting column”), by following this next procedure.
Procedure
Multiple-Column Sort of a Line-item Report
Step 1. Click-and-drag across the headers of the sorting columns (if they are next to one another) to select and highlight them (A).
Note: When you use this method, the first (left) column becomes the primary sorting column, the second becomes the secondary sorting column, and so on. See the next lesson for instructions on rearranging the orders of columns if it is necessary.
or alternatively
Press and hold the Ctrl key on your keyboard, click the headers of the sorting columns to select and highlight them, then release the Ctrl key.
Note: When you use this method, click the primary sorting column first, the secondary sorting column second, and so on.
Step 2. Click the Sort ascending button (B) in the application toolbar.
This procedure had three effects on the line-item report (Figure 14.7):
![]() It clustered all the rows with the same equipment code into groups (A), and sorted the groups in order of increasing code.
It clustered all the rows with the same equipment code into groups (A), and sorted the groups in order of increasing code.
This grouping occurs automatically whenever there are rows with the same data in the sorting columns.
![]() It clustered all the rows in each group with the same construction year into subgroups (B), and sorted the subgroups in order of increasing year.
It clustered all the rows in each group with the same construction year into subgroups (B), and sorted the subgroups in order of increasing year.
![]() It placed icons in the headers of the Equipment and Construction Year columns (C) to indicate that they are sorted.
It placed icons in the headers of the Equipment and Construction Year columns (C) to indicate that they are sorted.
Figure 14.7 The customized output of the IH08 transaction, with the rows grouped and sorted by model number and construction year.

End Procedure
This third example demonstrates the method of sorting the hit lists of search screens.
Search hit lists are usually displayed in a line-item format, and occasionally you will see the Sort ascending and Sort descending buttons somewhere on their screens (see Figure 13.13 on page 163 for an example). When this occurs, you can use the same procedures that were described in the last two examples to rearrange their contents.
When the hit list screen does not display these two buttons, you can still rearrange their contents by simply double-clicking the header of a data column.
For example, the hit list for a search for plant codes is a two-column line-item report (Figure 14.8A). However, it is organized in order of the plant code, and the plant names are randomly organized. When you scroll through the hit list, it is hard to find a plant by its name because of this lack of organization.
Figure 14.8 The hit list for a plant code search, in the default order (A) and reorganized in order of plant name (B).

You can solve this problem by double-clicking the header of the Name column: One double-click reorganizes it in alphabetical order (B), and a second click reorganizes it in reverse alphabetical order (not shown here).
The filtering function edits the contents of line-item reports and shortens them by removing rows that contain certain data values, or filtering criteria, in specified columns.
You can filter a report whenever you see the Threshold button (also called the Set filter button on some screens) in the application toolbar of the output screen of a report (Figure 14.9). To start this procedure, click the header of the column that contains the filtering criteria to select and highlight it, then click this button.
This action calls up the Determine values for filter criteria screen (Figure 14.10), which contains data entry fields for each filtering criteria that you want to apply to the report. You can search for and enter codes and texts in these fields, attach selection options to them, and enter multiple codes and ranges, by following the procedures that were described in Part III of this book.
Figure 14.10 Enter your filter criteria on the Determine values for filter criteria screen as you would enter them on any initial screen.

The base of the filter screen contains a row of command buttons, including the Enter button (A), which has the same effect as hitting the Enter key on your keyboard, and the Cancel button (B), which erases the screen and returns you to the main screen. You can delete one filtering criterion by clicking inside one of its data entry fields and then clicking the Delete row button (C), or you can delete all the filtering criteria on the screen by simply clicking the Delete button (D).
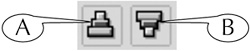
Don’t see the Threshold button on your screen? Follow the menu path Settings > Options to call up the Options screen (Figure 14.11), select the Expert mode option (A) and hit the Enter key on your keyboard.
We now illustrate the filtering of line-item reports with two examples.
Once again, we use the output of the IH08 transaction, which displays data about equipment, to demonstrate the procedure for filtering a line-item report. The report is generated by a list-display transaction, and it was originally set up to display data on every pump operated and maintained by a physical plant (Figure 14.12).
Suppose we want to limit this line-item report to all those pumps in our plant that cost between $1,000 and $2,000. We can edit it along those lines by following this next procedure.
Procedure
Filtering a Line-item Report
Step 1. Click the header of the Acquisition value column (A) to select and highlight it, then click the Threshold button (B).
Step 2. The Determine values for filter criteria screen appears with data entry fields for the acquisition value (Figure 14.13).
![]() Enter 1000 in the first field and 2000 in the second field. Do not use commas or dollar signs.
Enter 1000 in the first field and 2000 in the second field. Do not use commas or dollar signs.
![]() Hit the Enter key on your keyboard.
Hit the Enter key on your keyboard.

Step 3. The line-item report returns, and now displays only the data for pumps with an acquisition value of $1,000 to $2,000 (Figure 14.14). A small icon also appears in the header of the Acquisition value column (A) to indicate that the report is filtered according to the contents of that column.
Suppose we want to further limit this report to all pumps that were constructed after 2001. We would continue in this way:
Step 4. Click the header of the Construction year column (Figure 14.14B) to select and highlight it, then click the Threshold button (C).
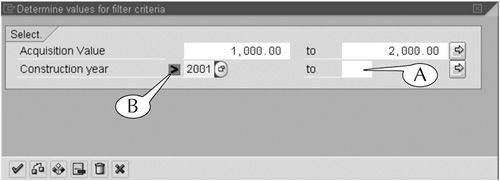
Step 5. The Determine values for filter criteria screen returns with a second set of data entry fields for the construction year (Figure 14.15A).
![]() Double-click inside the first of the two Construction year fields to call up the Maintain Selection Option screen (see Figure 12.3 on page 144), and double-click the green greater than (>) option to attach it to the Construction year fields (B).
Double-click inside the first of the two Construction year fields to call up the Maintain Selection Option screen (see Figure 12.3 on page 144), and double-click the green greater than (>) option to attach it to the Construction year fields (B).
![]() Enter 2001 in the first Construction year field.
Enter 2001 in the first Construction year field.
![]() Hit the Enter key on your keyboard.
Hit the Enter key on your keyboard.
Figure 14.15 Adding a second filter to the output of the IH08 transaction, this time using a selection option.
Step 6. The line-item report returns, and now displays only the data for those pumps that were acquired after 2001 at a cost of $1,000 to $2,000 (Figure 14.16).

End Procedure
We return to the output of the Cost Center Actual/Plan/Variance (A/P/V) transaction (Figure 14.17) to demonstrate the use of a second filtering screen that you may encounter in some modules.
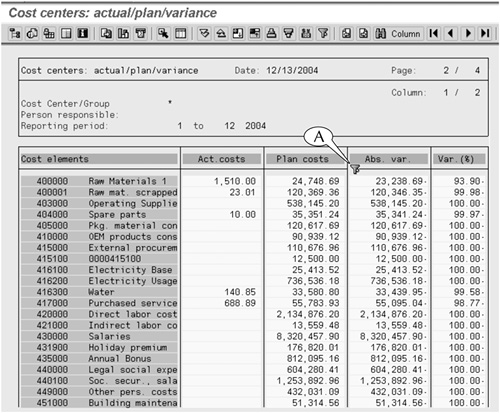
Figure 14.17 The default output of the Cost Center Actual/Plan/Variance transaction. Notice that there are positive and negative dollar values in the Abs var column.

We filter this line-item report according to the contents of the Abs variance column (A), which shows the numerical differences between the actual and planned costs of cost elements. Notice that some of the values in this column are positive, and some are negative. We can apply a filter to the report that removes those line items with variance values less than $5,000, regardless of whether they are positive or negative, by following this next procedure.
Procedure
Filtering Positive and Negative Values in a Line-item Report 1
Step 1. Click the header of the Abs var column to select and highlight it (Figure 14.17A), then click the Threshold button (B).
Step 2. The Maintain Threshold Value Conditions for Selection 001 screen appears (Figure 14.18). It contains two sets of identical field areas in which you can apply one or two filters. We use the first set of field areas in the top half of the screen to apply one filter in this procedure.
Figure 14.18 The Maintain Threshold Value Conditions screen contains field areas for two separate filters. We use it to apply one filter to the report.

![]() Select the Active option (A) to activate the top filter.
Select the Active option (A) to activate the top filter.
Step 3. Enter the greater than or equal to (>=) condition code in the Condition field (B) by doing the following.
![]() Click inside the field to call up the Threshold value condition search screen (Figure 14.19).
Click inside the field to call up the Threshold value condition search screen (Figure 14.19).
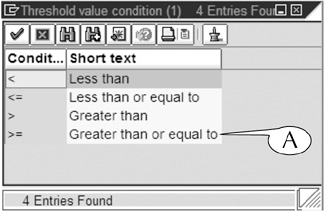
![]() Double-click the greater than or equal to condition code (A), and it is entered in the Condition field (Figure 14.18B).
Double-click the greater than or equal to condition code (A), and it is entered in the Condition field (Figure 14.18B).
Step 4. Enter 5000 (again, without a dollar sign or comma) in the Threshold value field (Figure 14.18C).
Step 5. Verify that the correct filtering column is entered in the Ref column field (D). If it is not, click its search button to call up a list of columns, and double-click the correct one to enter it there.
Step 6. Select the Ignore +/- sign option (E). This action sets the filter to remove all line items with variances less than $5,000 whether they are positive or negative.
Step 7. Hit the Enter key on your keyboard to return to the output screen, where the filter is now applied to the line-item report (Figure 14.20). Notice that a filter icon (A) is attached to the header of the Abs var column.
Figure 14.20 The filtered output of the Cost Center Actual/Plan/Variance transaction, with all line items with variances less than $5,000 removed.
End Procedure
Once you apply a filter by this procedure, you can remove it by recalling the Maintain Threshold Value Conditions screen and deselecting the Active option (Figure 14.18A).
The Maintain Threshold Value Conditions for Selection 001 screen (Figure 14.18) is associated with only a few output screens in SAP. However, it is quite convenient for filtering numerical data with both positive and negative values, thanks to the Ignore +/- option.
You may encounter positive and negative numerical values on other line-item reports where you have the usual Determine values for filter criteria screen at your disposal for filtering them. In these cases, filtering positive and negative numerical values is a little more cumbersome.
For example, consider the example of the line-item report on the Display Actual Cost Line Items for Orders screen (Figure 14.21). This report contains the Val in rep cur column (A), which displays both positive (credit) and negative (debit) dollar values. If you want to filter this report according to the contents of this column, you will find that the Determine values for filter criteria screen contains data entry fields for these dollar values, but no handy Ignore +/- option (Figure 14.22).
Figure 14.21 The line-item report of the Display Actual Cost Line Items for Order screen contains the Val in rep cur column, where you will find positive and negative dollar values.
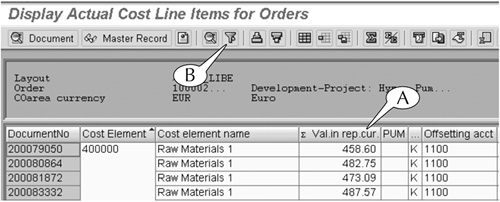
Figure 14.22 Use the multiple selection screen of the Val in rep cur fields to filter a data column of positive and negative values.
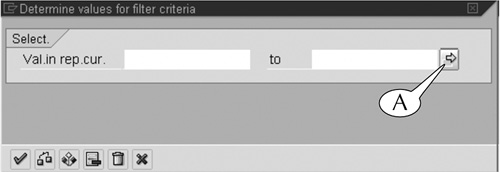
To apply a filter to these dollar values that takes into account their positive and negative values, you must use the multiple selection option on the Determine values for filter criteria screen.
For example, if we wanted to apply the same filter that we used in the previous example, we could click the multiple selection button for the Val in rep cur fields on the filter screen (Figure 14.22A) to call up a multiple selection screen (Figure 14.23), and then do the following.
![]() Click the green Single vals tab (Figure 14.23A).
Click the green Single vals tab (Figure 14.23A).
![]() Enter 5000 in the first field of that screen, and attach a greater than or equal to selection option to it. This action filters out all positive values less than $5,000.
Enter 5000 in the first field of that screen, and attach a greater than or equal to selection option to it. This action filters out all positive values less than $5,000.
![]() Enter -5000 in the second field of that screen, and attach a less than or equal to selection option to it. This action filters out all negative values greater than $5,000 (that is, between 0 and -5000).
Enter -5000 in the second field of that screen, and attach a less than or equal to selection option to it. This action filters out all negative values greater than $5,000 (that is, between 0 and -5000).
![]() Hit the Copy button (B) to save your entries and return to the Determine values for filter criteria screen.
Hit the Copy button (B) to save your entries and return to the Determine values for filter criteria screen.
![]() Hit the Enter key on your keyboard to save your filter and return to the output screen, where the data would be filtered.
Hit the Enter key on your keyboard to save your filter and return to the output screen, where the data would be filtered.
Figure 14.23 Setting up the multiple selection screen to filter out dollar values less than $5,000, whether they are positive or negative.

We could also set up the multiple selection screen in this way (Figure 14.24):
![]() Click the red Interval tab (A).
Click the red Interval tab (A).
![]() Enter -5000 and 5000 in the first line of paired fields. This action filters out all values within this range.
Enter -5000 and 5000 in the first line of paired fields. This action filters out all values within this range.
![]() Hit the Copy button (B) to save your entries and return to the Determine values for filter criteria screen.
Hit the Copy button (B) to save your entries and return to the Determine values for filter criteria screen.
![]() Hit the Enter key on your keyboard to save your filter and return to the output screen, where the data would be filtered.
Hit the Enter key on your keyboard to save your filter and return to the output screen, where the data would be filtered.

You can attach grand totals beneath the bottom lines of data columns, as well as subtotals beneath the bottom lines of groups and subgroups, in line-item reports. This is possible whenever you see the Summation button in the application toolbar of the output screen for the report (Figure 14.25A). This button can only be applied to columns with data such as dollar values and total quantities. It cannot be applied to columns with dates, model number, object codes, text, and the like.

For example, we can attach a grand total for the acquisition value beneath the bottom line of the line-item report of the IH08 transaction with this two-step procedure (Figure 14.25).
Procedure
Summing Up Data in a Column of a Line-item Report
Step 1. Click the header of the Acquisition value column to select and highlight it (B).
Step 2. Click the Summation button (A), and the grand total for the selected column appears in a highlighted line at the very bottom of the screen (Figure 14.26A).
Figure 14.26 A grand total appears for the Acquisition value column at the bottom of the line-item report.

End Procedure
As soon as we added a grand total to this report, the Subtotal button (Figure 14.26B) appears in the application toolbar of its screen. We can use this button to simultaneously group and subtotal line items in this same report.
For an example, we group and subgroup the line items in our sample report by equipment code and construction year, respectively, and subtotal their acquisition values by following this next procedure.
Procedure
Grouping and Subtotaling Data in a Line-item Report
Step 1. Click-and-drag across the headers of the Equipment code and Construction year columns to select and highlight them (C), or
Press and hold the Ctrl key on your keyboard, click the headers of the two columns to select and highlight them, then release the Ctrl key.
Step 2. Click the Subtotal button (B). The line items are automatically grouped and subgrouped, and subtotals for the acquisition value appear on the bottom line of each group and subgroup (Figure 14.27).
Figure 14.27 Groups and subgroups of line items, each with their own bottom-line subtotal of acquisition values.
Note: If the line items were already grouped and subgrouped before you began this procedure, you could still use the Subtotal button for this same result.
End Procedure
1. We have not used the transaction code in this name because it is very long and clumsy: S_ALR_87013611.