Chapter 24
Ten Professional Development Projects for SPSS Users
In This Chapter
![]() Challenging yourself with more advanced SPSS projects
Challenging yourself with more advanced SPSS projects
![]() Taking your SPSS knowhow to the next level
Taking your SPSS knowhow to the next level
When you’re ready for intermediate-level material, this chapter is for you. Here, we take you beyond what this one book can do, and introduce you to a whole world of SPSS knowledge out there waiting for you.
 For some of these topics, SPSS Statistics for Data Analysis and Visualization, by Keith McCormick and Jesus Salcedo (Wiley), can be a big help.
The Case Studies
The case studies in the Help menu are an absolutely wonderful resource, and many new users simply don’t find them. They’re chapter-length, step-by-step, detailed walk-throughs of the techniques, accompanied with practice data. In terms of free resources, you simply can’t get any better than this. The only limitation, perhaps, is that for the more sophisticated techniques, you encounter a lot of jargon (so you may find yourself searching for more information online).
If you happen to have a good grounding in statistical jargon already, jump right in! If you’re just starting out, start with the case studies that support the techniques in Part V of this book. As for the jargon, this book’s Glossary will get you started.
Syntax
Syntax is a big topic, and for many people (okay, most!), it’s a little dry. But syntax is very powerful, and you won’t learn it by osmosis. SPSS doesn’t force you to learn syntax — you have to force yourself. The medicinal taste won’t go away right away, but soon you’ll be saving time, and that will motivate you to keep going! At first, it may seem like it’s taking more time, but your persistence will pay off.
Here are a few things you can do to get started:
- Go to any procedure under the Data, Transform, or Analyze menus. Complete the dialog box as if you were going to run the technique. Before you click OK, click the Paste button. The Syntax appears in the Syntax Editor. Now you can look up the command in the Syntax Reference Guide (located within the Help menu) to learn more about it.
- Take a simple formula like body mass index (BMI), gross domestic product (GDP), or something from your field, and try doing the calculation in the Syntax window. Eventually, you’ll find that many calculations are faster this way, especially if you’re doing lots of similar calculations, which is very common in the SPSS world.
- Read the opening chapter of the Syntax Reference Guide (located within the Help menu). There are a couple of other chapters worth taking a peek at, but you can mostly use it as a dictionary. Don’t try to read the whole thing — it’s a door stopper.
- Create a simple project: open a file, add labels, add a variable or two, produce a table, produce a graph, and each time before you click OK, click the Paste button, which produces the Syntax in the Syntax Editor. Now you have a copy of the Syntax and you can run it, but more important, you can save it so you can redo all these techniques at a later point (with new data). Force yourself. It may take a few hours or even a whole day. You might hate us for suggesting it, but you’ll be glad you followed through. Soon, you’ll be working at three times your old speed.
IBM SPSS Tables
For years and years, the Table module has been the most popular module in SPSS. And you can easily see why! The Table module is easy and powerful. Plus, marketing and survey researchers just love it, and they’ve made it popular. You don’t have to work in either of these areas to benefit from the Table module, though.
Get a free trial copy of the complete SPSS Statistics with all the modules, and force yourself to spend a solid day using it. See if there is any aspect of reporting that you’re already doing that you could do faster with the Table module. Force yourself to reproduce a recent report, and see how much time you might save.
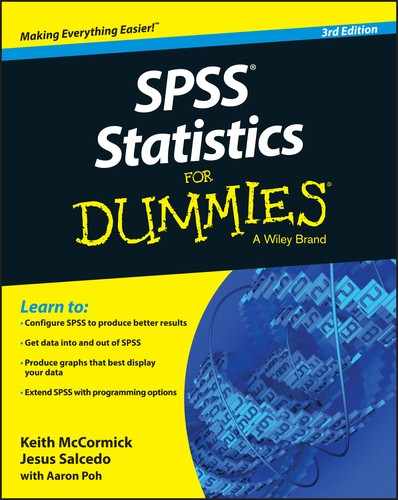
The following two figures were in previous chapters. In Figure 24-1, you see a simply Frequencies showing two variables. Note that the categories for both variables are the same. In Figure 24-2, you see the same data, but here the table was created using the SPSS Table module: this is a much better table.
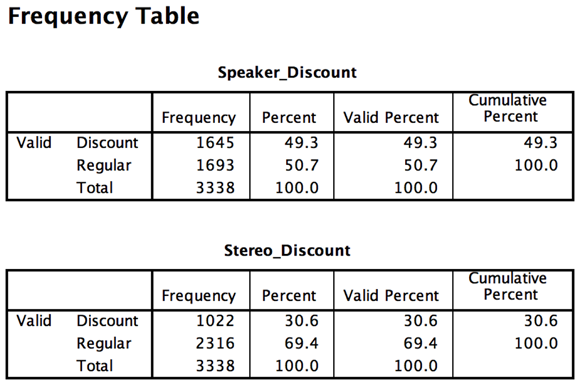
Figure 24-1: Frequencies table of the discount variables.
Figure 24-2: Custom table of the discount variables.
If you’re producing the table for yourself, it doesn’t matter. But if you’re putting the table in a report that will be sent to others, you really need the SPSS Table module. By the way, with practice it takes only a few seconds to make the custom version, and you can use Syntax to make it even better!
Data Visualization
This topic has inspired a cottage industry of advice. Unfortunately (or maybe fortunately), they aren’t all SPSS point-and-click books. Why fortunately? Well, it may be a good idea to broaden your horizons and think about good design, and not worry, at first, about how you’re going to make it. Have a little faith that SPSS can do it. Here are some resources to get you started:
- The Visual Display of Quantitative Information, by Edward R. Tufte (Graphics Press), is a classic.
- Visualize This: The Flowing Data Guide to Design, Visualization, and Statistics, by Nathan Yau (Wiley), is great. FlowingData is the name of Yau’s blog, which is also excellent.
- The Wall Street Journal Guide to Information Graphics: The Dos and Don’ts of Presenting Data, Facts, and Figures, by Dona M. Wong (W. W. Norton & Company), is a great book written by an admirer of Tufte. You may even want to read this book before Tufte’s because it’s shorter and can be applied to your work more easily.
- Hans Rosling is a master of story telling with statistics. His presentations can be found at
www.ted.com/speakers/hans_rosling. Note Rosling’s use of the bubble chart style of graphic (see Chapter 12), which he has helped popularize. Impressive charts resembling what Rosling shows (without the animation) can be done with Graphics Production Language in SPSS.
Better Presentations
You’ll likely have to present your analysis in a slide presentation someday. Most slide presentations are terrible, and you don’t want to add to the world’s inventory of bad presentations. You simply can’t be an exceptional SPSS Statistics user if no one understands what you’re trying to say about your results.
Check out the following books, and then spend an afternoon watching TED videos with some ice cream or popcorn or beer:
- slide:ology: The Art and Science of Creating Great Presentations, by Nancy Duarte (O’Reilly Media), in many ways started the wave of writing on this subject. Resonate, also by Nancy Duarte (Wiley), is an equally good companion piece.
- Presentation Zen: Simple Ideas on Presentation Design and Delivery, 2nd Edition, by Garr Reynolds (New Riders), is full of great advice.
- Talk Like TED: The 9 Public-Speaking Secrets of the World’s Top Minds, by Carmine Gallo (St. Martin’s Press), has reduced the secrets of the 18-minute TED-style presentation to nine key points.
- The Cognitive Style of PowerPoint: Pitching Out Corrupts Within, 2nd Edition, by Edward R. Tufte (Graphics Press), is a deservedly famous 32-page rant against bad PowerPoint.
R
That isn’t an abbreviation. It’s the whole name of a programming language. If you’re a statistics major or minor, you’ve almost certainly heard of it. R is incredibly popular. You may have even had friends compare R to SPSS and talk about how it’s powerful and free. R is powerful and free, but there is no need to make it compete with SPSS. You can use R right in the Syntax window of SPSS, giving you the best of both worlds.
R has a much steeper learning curve than SPSS does. Many books on R focus on the basics, but as an SPSS user, you don’t need all that. The basics are more easily done in SPSS. The power of R in the Syntax window is that you’ll never be without a feature that you need in SPSS. If something brand new comes out, and it often appears in R first, you can access it through SPSS while still taking advantage of the very easy point-and-click interface of SPSS. Make no mistake: R is programming.
Graphics Production Language
Graphics Production Language (GPL) is programming, and we know that for some people, that’s a strike against it. GPL is powerful, though. It will transform your notion of what is possible with SPSS graphics. GPL is probably the only way to be able to follow the advice of folks like Nathan Yau and Edward Tufte in SPSS. Sure, you can take their advice and do all kinds of clever things, and make some major improvements to your graphics, but if you really want to get serious about it, you’ll have to learn how to code. That’s true of everyone who wants to do serious graphics.
Output Management System
Output Management System (OMS) changes everything. When you grow to be a sophisticated user of SPSS, there is simply no reason to be manually cutting and pasting all your results, one at a time. That’s a frequent mistake new users make as they learn more and more SPSS. Cutting and pasting makes a lot of sense when you have one table or one graph, but you don’t want to use this approach for 30 tables or 81 graphs.
The whole idea behind OMS is that you can automatically route results to just about any format in one step just by telling SPSS what you want routed and where you want it to go. Next thing you know, your Regression Q-Q Plots will all go to PowerPoint. Voilà! There’s more to OMS, of course, but not so much that you can’t figure it out in a few hours or less. If you produce a lot of output, learn this approach as soon as possible. It may save you many days each year.
Python Programs
Years ago, and we mean many years ago, there was a feature in SPSS called Macros. Some folks still like Macros, just like some folks still like making ice cream by manually turning a crank. Python is the way to go, if you want to be a true power user when it comes to SPSS programming. Have no fear. If you enjoy programming, and you’re feeling brave, a free book called SPSS Programming for SPSS and SAS Users can help. As of this writing, the most recent update is for version 20, but it will give you what you need.
In the SPSS Help, you’ll also find Python Integration Package for IBM SPSS Statistics and Introduction to Python Programs, both of which are great resources.
Python Scripting
Python scripting is quite different from Python programming in SPSS Statistics. Scripting has its own Help section, Python Scripting Guide for IBM SPSS Statistics. The main difference is that Python programs allow you to do more powerful things with syntax. Python scripts help you manipulate the interface — the output window, results in the output window, the graphical user interface, and so on. Scripts are very powerful, but if you aren’t a programmer, start with Python programs first.