
3.1. Disk configuration
As hardware components simultaneously increase in speed and capacity while falling in price, one of the consequences is a tendency to spend less time analyzing the precise performance requirements of a database application. Today's off-the-shelf/commodity database servers from the major system vendors are both powerful and flexible enough for almost all database implementations. Given that, regardless of the available power, one of the fundamental truths of any computing system is that there will always be a bottleneck somewhere (and in most cases, particularly for SQL Server systems, the bottleneck is usually in the disk subsystem), making disk configuration an important DBA skill.
Multicore CPUs and higher-capacity (and cheaper) memory chips have made CPU and memory configuration reasonably straightforward. Disk configuration, on the other hand, is more involved, and for a disk-intensive server application such as SQL Server, correctly configuring disk storage components is critical in ensuring ongoing performance and stability.
As well as being the most complicated hardware bottleneck to fix once in production, incorrectly configured disks and poor data placement are arguably the most common cause of SQL Server performance problems. Chapter 9 will tackle disk management from a SQL Server data placement perspective. For now, let's focus on disk configuration from a hardware and operating system perspective. In this section, we'll take a look at disk drive anatomy, partition offsets, allocation unit size, using multipathing software, and configuring storage cache.
3.1.1. Creating and aligning partitions
Preparing disks for use by SQL Server involves configuring RAID arrays, creating partitions, and formatting volumes. We'll examine each of these tasks shortly, but first let's cover some of the terms used when discussing the anatomy of a disk drive:
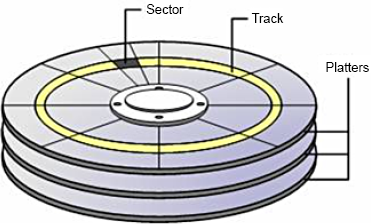
Each physical disk is made up of multiple magnetized platters, which are stacked on top of each other, with each platter storing data on both sides (top and bottom).
A track is a ring of data storage on a disk platter. Tracks are numbered beginning with zero, starting from the outermost to the innermost ring.
Each track consists of multiple sectors, which cut the track into portions similar to a pie slice. Sectors typically have a fixed size of 512 bytes, and represent the smallest accessible unit of data on the disk.
Earlier disks had a fixed amount of sectors per track. Considering the smaller length of tracks toward the center of the disk platters, sectors on the outer tracks were padded with blank space to keep the sectors per track at a fixed ratio. Modern disks use various techniques[] to utilize the blank space on the outer tracks to increase disk capacity.
[] The most common technique is zoned-bit recording (ZBR), which uses more sectors on the outer track.
Disk heads, positioned above and below each platter, move in and out from the center of the disk. This motion, together with the spinning of the disk platters on their central axes, allows the disk heads to access the entire surface of each disk platter.
An allocation unit is the smallest file allocation size used by Windows. The default allocation unit size is 4K, which equates to eight sectors. Smaller allocation units reduce the amount of wasted space for small files but increase fragmentation. Larger allocation units are useful for larger files and reducing fragmentation.
Figure 3.1 illustrates some of these terms.
Figure 3.1. Anatomy of a hard disk. (Reproduced with permission: Rui Silva, "Disk Geometry," MSExchange.org, http://www.msexchange.org/tutorials/Disk-Geometry.html.)
In chapter 2 we discussed commonly used RAID levels such as RAID 0 and RAID 10, both of which stripe data across multiple disks. Striping works by dividing data to be written to disk into chunks and spreading the chunks over the separate disks in the RAID array. When the data is read, the RAID controller reads the individual chunks from the required disks and reconstructs the data into the original format.
The RAID stripe size, not to be confused with the allocation unit size, determines the size of each chunk of data. Setting the stripe size too small will create additional work for the RAID controller in splitting and rejoining requested data. The best RAID stripe size is a contentious issue, and there's no single best answer.
Storage vendors, particularly for their enterprise SAN solutions, typically optimize the stripe size based on their expert knowledge of their systems. In almost all cases, the best option is to leave the existing default stripe size in place. Changes should be verified with the storage vendor and undergo thorough tests to measure the performance impact before making the change to a production system.
Once the RAID array is built, the next task is to create one or more partitions on the array that prepares the disk for use by Windows. As you'll see shortly, disk partitions should be built using the diskpart.exe tool, which provides a method to offset, or align, the partition.
Track-aligned partitions with DiskPart
The first part of each disk partition is called the master boot record (MBR). The MBR is 63 sectors in length, meaning the data portion of the partition will start on the 64th sector. Assuming 64 sectors per track, the first allocation unit on the disk will start on the first track and complete on the next track. Subsequent allocation units will be split across tracks in a similar manner.
The most efficient disk layout is where allocation units are evenly divisible into the tracks—for example, eight 4K allocation units per 32K track. When a partition isn't track-aligned, allocation units start and finish on different tracks, leading to more disk activity than would be required in a track-aligned partition. For RAID arrays, similar alignment problems exist with the stripes, increasing disk activity and reducing cache efficiency. Some estimates suggest up to a 30 percent performance penalty—a significant amount, particularly for disk-bound systems. Figure 3.2 illustrates the before- and aftereffects of offsetting a partition.
Figure 3.2. Track-aligned partitions. Without specifying an offset during partition creation, partitions incur I/O overhead. Using DiskPart with an offset allows partition alignment and more efficient I/O.

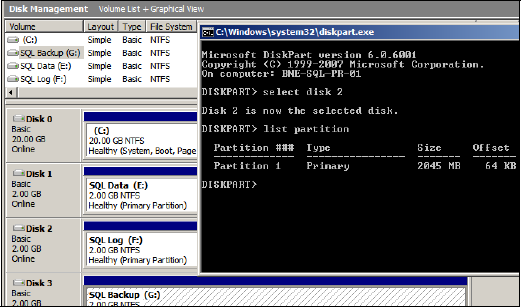
The task, then, is to offset the partition's starting position beyond the MBR. Starting in Windows Server 2008, all partitions are track-aligned by default. In Windows Server 2003 and earlier, partitions are track-aligned on creation using the diskpart.exe tool or diskpar.exe prior to Windows Server 2003 Service Pack 1. As shown in figure 3.3, the DiskPart tool can also be used to inspect an existing partition's offset.
Figure 3.3. DiskPart can be used to track-align partitions and inspect the offset of existing partitions.
A common offset used for SQL Server partitions is 64K, or 128 sectors. Using DiskPart, you achieve this by using the Create Partition command with an align=64 option. Windows Server 2008 (and Vista) automatically use a 1024K offset, a value chosen to work with almost all storage systems. If unaligned partitions are used by these operating systems—for example, after an upgrade from Windows Server 2003—then the partition overhead remains until the partition is rebuilt.
As with the RAID stripe size, check the offset value with the storage vendor, and verify any changes from their recommended value with an appropriate performance test.
Allocation unit size
The final task in preparing a disk for use by SQL Server is to format the partition using the Windows Disk Management tool. By default, partitions are formatted using a 4K allocation unit size.
As discussed earlier, the smaller the allocation unit size, the less disk space is wasted for small files. For example, a 1K file created on a volume with a 4K allocation unit will waste 3K, as 4K is the minimum allocation unit size.
In contrast, large files benefit from a larger allocation unit. In fragmented disks with a small allocation unit size, a single large file will occupy many allocation units, which are probably spread over many different parts of the disk. If you use a larger allocation unit, a file will have a better chance of being located in consecutive disk sectors, making the read and writes to this file more efficient.
SQL Server allocates space within a database using extents, which are collections of eight 8K pages, making a total extent size of 64K. As you can see in figure 3.4, the recommended allocation unit size for a SQL Server volume is 64K, matching the extent size. Allocation unit sizes less than 8K (the default is 4K) aren't recommended, as this leads to split I/O, where parts of a single page are stored on separate allocation units—potentially on different parts of the disk—which leads to a reduction in disk performance.
Note that NTFS partitions created using allocation units of greater than 4K can't be compressed using NTFS compression. Such compression isn't recommended for SQL Server volumes, so this shouldn't be a determining factor. In later chapters, we'll examine various forms of native compression introduced in SQL Server 2008.
Let's turn our attention from the format of disks to the manner in which they're connected to the server: disk controller cards.
Figure 3.4. SQL Server volumes should be formatted with a 64K allocation unit size using the NTFS file system, after the underlying partition has been track-aligned.

3.1.2. Distributing load over multiple controllers
Storage controller cards, along with various other components, act as intermediaries between the physical disks and the software requesting the data on the disks. Like other storage components, disk controllers have a maximum throughput capacity and are subject to failure. When you design a storage system for SQL Server, storage controller cards play a pivotal role from both performance and fault tolerance perspectives.
A guiding principle in achieving the best possible storage performance for SQL Server is to stripe data across many disks. With multiple disks, or spindles, in action, the speed of a read or write operation is faster than what could be achieved with a single disk. Striping data across multiple disks also reduces the speed at which disk queues build. With more disks in action, the likelihood of a queue building for any single disk is reduced.
When large numbers of disks are used, the storage bottleneck begins to move from the disks to the storage controllers that coordinate the disk reads and writes. More disks require more storage controllers to avoid I/O bottlenecks. The ratio of disks to controllers is determined by various factors, including the nature of the I/O and the speed and bandwidth of the individual components. We discussed a technique for estimating disk and controller numbers in the previous chapter.
I/O performance
When choosing a server, pay attention to the server's I/O capacity, measured by the amount of supported PCI slots and bus type. Modern servers use the PCI Express (PCI-E) bus, which is capable of transmitting up to 250MB/second per lane. An x4 PCI Express slot has four lanes, x8 has eight lanes, and so forth. A good server selection for SQL Server systems is one that supports multiple PCI-E slots. As an example, the HP ProLiant DL585 G2 has seven PCI-E slots comprised of 3×8 slots and 4×4 slots for a total of 40 lanes. Such a server could support up to seven controller cards driving a very high number of disks.
Multipath for performance and tolerance
Depending on the storage system, a large number of components are involved in the I/O path between the server and the disks. Disk controllers, cabling, and switches all play a part in connecting the disks to the server. Without redundancy built into each of these components, failure in any one component can cause a complete I/O failure.
Redundancy at the disk level is provided by way of RAID disks, as you learned in the previous chapter. To ensure redundancy along the path to the disks, multiple controller cards and multipathing software is used.
Multipathing software intelligently reroutes disk I/O across an alternate path when a component failure invalidates one of the paths. To do this, multiple disk controllers or HBA cards must be present and, ideally, connected to the storage system via separate switches and cabling.
Microsoft provides support for multipathing on the Windows Server platform (and therefore SQL Server) via Microsoft Multipath I/O (MPIO) drivers. Using MPIO, storage vendors provide reliable multipathing solutions for Windows Server platforms. MPIO solutions are available for a variety of storage systems, including Fibre and iSCSI SANs and parallel SCSI.
The real value in multipathing software lies in the fact that when all disk paths are working, the multipathing software increases disk performance by balancing load across the available paths; thus, the solution services both fault tolerance and performance at the same time.
Separate controllers
Chapter 9 discusses separating data and transaction logs in more detail, but it's worth mentioning at this point that for SQL Server systems with very high transaction rates, it's important to ensure there are no bottlenecks while writing to the transaction log. Transaction log bottlenecks increase transaction duration, which has a flow-on effect that causes numerous other performance problems. One way of preventing this is to store the transaction log on dedicated, RAID-protected disks, optionally connected to a dedicated disk controller channel or separate controller card.
Using multiple controller cards and multipathing software helps to increase disk performance and therefore reduce the impact of the most common hardware bottleneck. Another means of improving disk performance is through the usage of storage cache.
3.1.3. Configuring storage cache
In chapter 2 we listed the benefits of hardware-based RAID, one of which was that the disk controllers usually include some degree of cache, which you can consider the disk controller's private RAM. Let's turn our attention to two important aspects of storage cache: protecting it during power failure and configuring a higher percentage of its use for disk writes compared to reads.
Battery-backed cache
Disk controller cache improves performance for both reads and writes. When data is read from the disk, if the requested data is stored in the controller cache, then physical reads of the disk aren't required. In a similar fashion, when data is written to disk, it can be written to cache and applied to disk at a later point, thus increasing write performance.
The most critical aspect of disk controller cache is that it must be battery backed. This will ensure that power failures don't cause data in the cache to be lost. Even if the server includes a UPS, which is recommended, disk controller cache must be battery backed.
It's important to make the distinction between read cache and write cache. SQL Server itself has a large cache stored in the server's RAM where, among other things, it caches data read from disk. In most cases, the server's RAM is likely to be much larger (and cheaper) than the disk controller cache; therefore, disk read performance increases attributed to storage cache are likely to be quite small, and in some cases can actually be worse due to the double caching involved.
The real value of disk controller cache is the write cache. Write cache is particularly useful for improving disk performance during bursts of write activity such as checkpoints (covered in chapter 7), during which large numbers of writes are sent to disk. In these circumstances, a large write cache can increase performance. The controller commits the writes to cache, which is much faster than disk, and hardens the writes to disk at a later point. As long as the controller cache is battery backed, this is a safe, high-performance technique.
Depending on the controller card or SAN, you may be able to configure the percentage of cache used for reads and writes. For SQL Server systems, reserving a larger percentage of cache for writes is likely to result in better I/O performance.
The quantity and read/write ratio of storage cache can make a significant difference to overall storage performance. One of the common methods of validating different settings prior to deploying SQL Server is to use the SQLIO tool, discussed next.
3.1.4. Validating disk storage performance and integrity
Before a system is production ready, you must conduct a number of performance tests to ensure the system will perform according to expectations. The primary test is to load the system with the expected transaction profile and measure the response times according to the service level agreements. We'll go into this process in more detail in chapter 14, when we'll focus on creating a performance baseline.
Prior to these tests, you'll need to carry out several system-level tests. One of the most important ones involves testing the storage system for capacity and integrity. This section focuses on two important tools, SQLIO and SQLIOSIM, both of which you can download for free from the Microsoft website. Links to both of these tools are available at sqlCrunch.com/storage.
SQLIO
SQLIO is a tool used to measure the I/O performance capacity of a storage system. Run from the command line, SQLIO takes a number of parameters that are used to generate I/O of a particular type. At the completion of the test, SQLIO returns various capacity statistics, including I/Os per second (IOPS), throughput MB/second, and latency: three key characteristics of a storage system, as you'll recall from chapter 2.
The real value in SQLIO is using it prior to the installation of SQL Server to measure the effectiveness of various storage configurations, such as stripe size, RAID levels, and so forth. In addition to identifying the optimal storage configuration, SQLIO often exposes various hardware and driver/firmware-related issues, which are much easier to fix before SQL Server is installed and in use. Further, the statistics returned by SQLIO provide real meaning when describing storage performance; what is perceived as slow can be put into context when comparing results between similar storage systems.
Despite the name, SQLIO doesn't simulate SQL Server I/O patterns; that's the role of SQLIOSIM, discussed in a moment. SQLIO is used purely to measure a system's I/O capacity. As shown in table 3.1, SQLIO takes several parameters used in determining the type of I/O generated.
| SQLIO option | Description |
|---|---|
| –t | Number of threads |
| –o | Number of outstanding I/O requests (queue depth) |
| –LS | Records disk latency information |
| –kR | Generates read activity |
| –kW | Generates write activity |
| –s | Duration of test in seconds |
| –b | I/O size in bytes |
| –frandom | Generates random I/O |
| –ssequential | Generates sequential I/O |
| –F | Config file containing test paths |
The configuration file specified with the –F parameter option contains the file paths to be used by SQLIO for the test. For example, let's say we wanted to test a LUN exposed to Windows as T drive. The contents of the configuration file for this test would look something like this:
T:sqlio_test_file.dat 8 0x0 1000
The additional parameters specified relate to the number of threads to use against the file (8 in this example), a mask value, and the file size.
Before we look at an example, let's run through some general recommendations:
The file size and test duration should be sufficient to exhaust the cache of the storage system. Some systems, particularly SANs, have a very large storage cache, so a short test duration with small file sizes is likely to be fulfilled from the cache, obscuring the real I/O performance.
Tests should be run multiple times, once for each file path. For instance, to test the capacity of four LUNs, run four tests, once for each LUN specified in the configuration file (using the -F parameter). Once each file path has been tested individually, consider additional tests with file path combinations specified in the configuration file.
Ensure the tests run for a reasonable length of time (at least 10–15 minutes) and allow time between test runs to enable the storage system to return to an idle state.
Record the SQLIO results with each change made to the storage configuration. This will enable the effectiveness of each change to be measured.
Run tests with a variety of I/O types (sequential vs. random) and sizes. For systems used predominately for OLTP purposes, random I/O should be used for most tests, but sequential I/O testing is still important for backups, table scans, and so forth. In contrast, sequential I/O testing should form the main testing for OLAP systems.
If possible, provide the results of the tests to the storage vendor for validation. Alternatively, have the vendor present during the tests. As the experts in their own products, they should be able to validate and interpret the results and offer guidance on configuration settings and/or driver and firmware versions that can be used to increase overall performance.
Let's look at an example of running SQLIO to simulate 8K sequential writes for 5 minutes:
sqlio -kW -t1 -s300 -o1 -fsequential -b8 -LS -Fconfig.txt
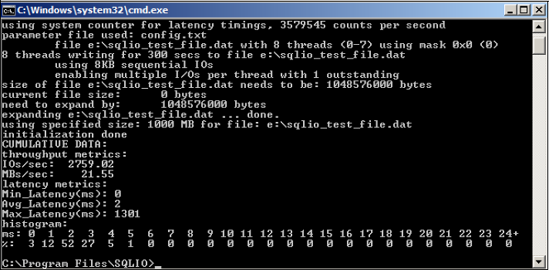
In this case, the config.txt file contains a path specification to a 1GB file located in e:sqlio_test_file.dat. You can see the results of this test in figure 3.5.
As the results show, we achieved about 2,759 IOPS and 21.55 MB/second throughput with low average latency (2ms) but a high peak latency (1301ms). On their own, these results don't mean a lot. In a real-world case, the tests would be repeated several times for different I/O types and storage configurations, ideally in the presence of the storage vendor, who would assist in storage configuration and capacity validation.
Achieving good I/O capacity, throughput, and latency is all well and good, but that's not enough if the storage components don't honor the I/O requirements of SQL Server. The SQLIOSIM tool, discussed next, can be used to verify the integrity of the storage system and its suitability for SQL Server.
Figure 3.5. SQLIO results include IOPS, MB/second, and various latency metrics. Running several tests using different storage configurations helps to determine optimal storage configuration prior to SQL Server installation.
Unlike SQLIO, SQLIOSIM is a storage verification tool that issues disk reads and writes using the same I/O patterns as SQL Server. SQLIOSIM uses checksums to verify the integrity of the written data pages.
Most SQL Server systems involve a large number of components in the I/O chain. The operating system, I/O drivers, virus scanners, storage controllers, read cache, write cache, switches, and various other items all pass data to and from SQL Server. SQLIOSIM is used to validate that none of these components alters the data in any adverse or unexpected way.
As you can see in figure 3.6, SQLIOSIM can be configured with various file locations and sizes along with test durations. The output and results of the tests are written to an XML file, which you specify in the Error Log (XML) text box.
During execution, the test progress is displayed to the screen, as shown in figure 3.7, with the final results captured in the XML log file you specified.
SQLIOSIM ensures that the SQL Server I/O patterns (covered in later chapters), such as random and sequential reads and writes, backups, checkpoints, lazy writer, bulk update, read ahead, and shrink/expand, all conform to SQL Server's I/O requirements. Together with SQLIO, this tool provides peace of mind that the storage system is both valid and will perform to expectations.
Let's turn our attention now from disk configuration to another major system component: CPU.
Figure 3.6. Use the SQLIOSIM Files and Configuration screen to specify various configuration options for I/O simulation tests.
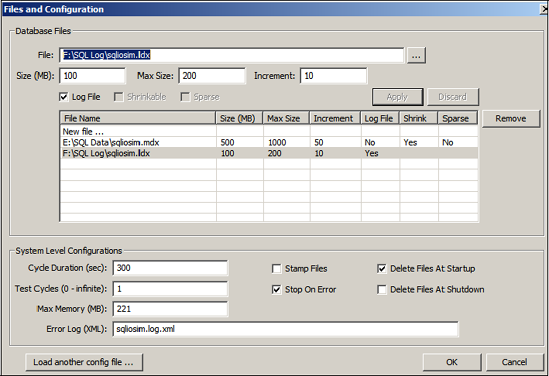
Figure 3.7. SQLIOSIM results are displayed to the screen as the simulation is in progress, and the final results are captured to the XML log file specified in the Files and Configuration screen.
