
14.1. Activity Monitor
In SQL Server 2005, we accessed Activity Monitor in SQL Server Management Studio by expanding Management and choosing Activity Monitor. This allowed us to view running processes as well as locks by process or object.
While beneficial, there was a limit to the level of detail that could be obtained using this tool, with typical follow-up investigations involving queries against various DMVs and/or system tables. In response to this, the new Activity Monitor in SQL Server 2008, as shown in figure 14.1, has been completely overhauled to help DBAs quickly see performance hot spots and related information.
Apart from the obvious visual differences, the way to access Activity Monitor has also changed. Rather than opening it via the Management section of SQL Server Management Studio, you either right-click the instance name and choose Activity Monitor or click the Activity Monitor icon on the standard toolbar.
Arguably the greatest feature of the new Activity Monitor is the ability to spot abnormal activity at a glance using the four included graphs. You can change the default graph refresh rate of 10 seconds by right-clicking any of the four graphs and selecting the appropriate refresh interval. The menu also allows you to pause or resume the display.
Let's explore this new tool further by examining the four expandable panes that appear below the graphs: Processes, Resource Waits, Data File I/O, and Recent Expensive Queries.
Figure 14.1. Visually similar to the Resource Monitor in Windows Vista and Server 2008, the new Activity Monitor included in SQL Server 2008 offers a rich view of system activity.

14.1.1. Processes
Expanding the Processes pane, as shown earlier in figure 14.1, provides information on currently running processes similar to the old Activity Monitor, including the ability to sort columns in ascending or descending order. Certain new columns are visible, such as Workload Group, a property of Resource Governor, which we'll cover in chapter 16.
Perhaps the most powerful new feature accessible through this pane is the ability to right-click a process and choose Trace Process in SQL Server Profiler. As the name suggests, this will open SQL Server Profiler with a filter on the selected session ID (SPID), allowing an in-depth, live analysis of the process activity. We'll cover SQL Server Profiler shortly.
The next pane in Activity Monitor is Resource Waits.
14.1.2. Resource Waits
As shown in figure 14.2, clicking the Resource Waits pane shows the latest information from several DMVs, including sys.dm_os_wait_stats, which we'll cover in detail in chapter 17. Note the Wait Category column. The categories in this column represent a system-level grouping of the various wait types a process can encounter.
During periods of widespread poor response, this view is ideal for spotting resource bottlenecks that may be contributing to a large number of waits. We'll cover this further in chapter 17 when we focus on performance tuning from a waits perspective.
The next pane in Activity Monitor is Data File I/O.
14.1.3. Data File I/O
Information from the sys.dm_io_virtual_file_stats dynamic management function is used to populate the results of the Data File I/O pane, as shown in figure 14.3. Providing a summary of I/O, broken down by database and file, this view includes MB/sec Read and Written and the average response time in ms for each file.
Figure 14.2. Information from several DMVs including sys.dm_os_wait_stats dmv is used in displaying the outstanding wait types, grouped by category.
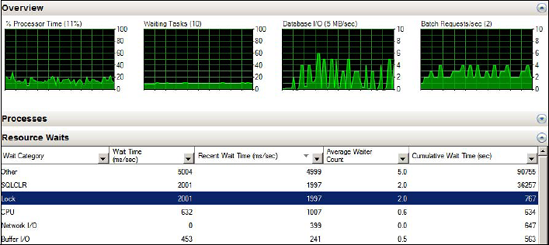
Figure 14.3. The Data File I/O pane displays various statistics for each database file.
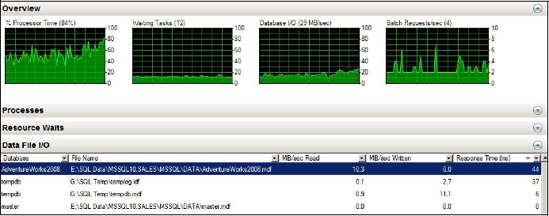
In chapter 9 we covered the importance of database object separation, for example, placing data, logs, and tempdb on dedicated disks. Apart from better performance, one of the other benefits of doing so is that by using the Data File I/O pane of the new Activity Monitor, it's easy to spot high disk usage and response times across all of the database objects, enabling a more targeted disk I/O performance-tuning exercise.
The last pane in Activity Monitor is Recent Expensive Queries, which draws its information from the sys.dm_exec_query_stats DMV.
14.1.4. Recent Expensive Queries
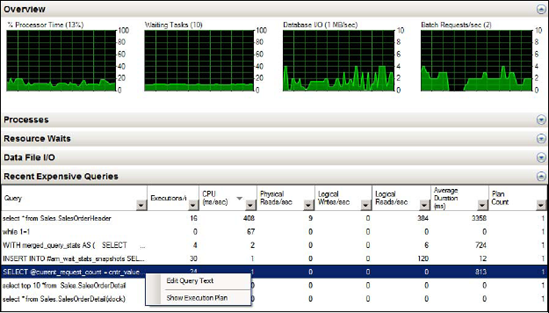
In addition to viewing the text of recently completed expensive queries, we can sort the results in ascending or descending order by CPU usage, physical/logical reads/sec, duration, plan count, and executions/min. A powerful feature of this particular pane is the ability to right-click any of the queries and view the graphical execution plan, as shown in figure 14.4.
Figure 14.4. Right-clicking any of the queries shown in the Recent Expensive Queries pane allows the graphical execution plan of the query to be displayed.
All of the Activity Monitor views and graphs are based on information from one or more dynamic management views or functions, so in that sense, there was nothing stopping us from getting this information in SQL Server 2005. The nice thing is having all of the work done for us, in an easy-to-use interface.
SQL Server Management Studio startup optionOne of the options I suspect many DBAs will use is automatically opening Activity Monitor on startup of SQL Server Management Studio. You can set this by selecting Open Object Explorer and Activity Monitor in the General page of the Tools > Options menu in SQL Server Management Studio. |
Activity Monitor provides an excellent, high-level overview of system activity. For a more detailed statement-level view, you can use SQL Server Profiler.