
13.3. Index analysis
An unfortunate, all-too-common indexing approach is to carpet bomb the database with indexes in the hope that performance will (eventually) improve. Not only will such an approach fail, but it usually ends in tears with the accumulated performance and maintenance costs of unnecessary indexes eventually having a paralyzing effect. Fortunately, there is a much more effective approach, made all the easier using several index-related Dynamic Management Views (DMVs).
In this section, we'll approach index analysis from three angles, identifying indexes to drop, add, and defragment. Let's begin with a look at using DMVs to identify indexes that are candidates for removal.
Dynamic Management ViewsDynamic Management Views return server state information useful in diagnosing server health and tuning performance. The values returned by some DMVs, including the ones in this section, are reset when the SQL Server instance restarts. Before making any decisions that are based on DMV results, consider when the instance was last restarted to ensure the DMV results are representative of the full range of database access patterns, for example, daily, weekly, and monthly reports. Taking a database offline, or using the AUTOCLOSE option, will also reset certain DMV values. Links to various DMV scripts and further details are available at http://www.sqlCrunch.com/index. |
13.3.1. Identifying indexes to drop/disable
Indexes that are either not used or used infrequently not only consume additional space, but they also lengthen maintenance routines and slow performance, given the need to keep them updated in line with the base table data. As an example, consider an index on a FirstName column in a very large customer table and a query such as select * from customers where FirstName = 'John'. A lack of understanding as to why SQL Server is unlikely to use such an index may cause a junior DBA to create it in the hope that it may improve performance. Usually, such indexes are left in place without any follow-up analysis as to whether or not the index is being used.
Before we look at techniques for removing indexes, let's cover a very important DMV, sys.dm_db_index_usage_stats, to help us in this task.
SYS.DM_DB_INDEX_USAGE_STATS
As the name implies, the sys.dm_db_index_usage_stats DMV returns information on how indexes are being used. For each index, counts are kept on the number of times the index has been scanned, updated, and used for lookup or seek purposes, since the SQL instance was last restarted.
A full description of all of the columns returned by this DMV is available in Books Online. Let's cover the important ones:
user_seeks—Each time an index is used for seek purposes, that is, navigating through levels of its B-tree, this counter is incremented. A high value here usually represents an effective index.
user_scans—When a index is scanned at the leaf level (as opposed to seeking through the B-tree), this counter is incremented.
user_lookups—Each time a nonclustered index is used for a lookup into a heap or clustered index, this counter is incremented.
user_updates—Insert, update, and delete operations on a table must maintain the appropriate indexes. Every insert and delete operation will have a corresponding action for each nonclustered index, with updates effecting certain indexes, depending on the columns that have changed. Each time an index is maintained for any of these actions, this counter is incremented.
In addition to these columns, sys.dm_db_index_usage_stats returns many others, including the last date and time for each of the actions covered previously. The major value of this DMV is using it to identify indexes that are rarely used but have a high maintenance overhead. Such indexes are candidates for removal, and we'll walk through a script that uses this DMV shortly.
Unused indexes
Like many other DMVs, sys.dm_db_index_usage_stats holds index usage stats only since the SQL instance was last started. One of the implications that can be drawn from this is that any index that does not appear in this list has not been used since the instance was started. If the instance has been online for long enough to cover the full range of access patterns—for example, daily, weekly and monthly reports—and the database is not using the AUTOCLOSE option (or has been taken offline), then an index not appearing in this DMV is unlikely to be used at all.
The script in listing 13.5 uses sys.dm_db_index_usage_stats along with a number of system tables to return indexes not used since the last instance restart.
Example 13.5. Indexes not used since last instance restart
-- Identify unused indexes (since last restart)
SELECT
    sc.name + '.' + object_name(i.object_id) as objectName
    , i.name as indexName
    , i.type_desc as indexType
FROM sys.indexes i
    INNER JOIN sys.objects o on o.object_id = i.object_id
    INNER JOIN sys.schemas sc on o.schema_id = sc.schema_id
WHERE
    objectproperty(i.object_id,'IsUserTable') = 1
    AND i.index_id not in (
        SELECT s.index_id
        FROM sys.dm_db_index_usage_stats s
        WHERE
            s.object_id = i.object_id
            AND i.index_id = s.index_id
            AND database_id = db_id()
    )
ORDER BY objectName, indexName ASC |
This script uses sys.indexes, sys.objects, and sys.schemas to return index information followed by a simple not in clause to exclude those indexes in the DMV. The end result includes indexes not used since the SQL instance last started.
We also need to identify indexes whose maintenance cost outweighs their value.
High-maintenance/low-value indexes
In our next script, shown in listing 13.6, let's use the count values returned from sys.dm_db_index_usage_stats to compare the update count to the use count, that is, their maintenance-versus-usage ratio.
Example 13.6. High-maintenance/low-value indexes
-- Identify high maintenance indexes with low usage
SELECT
    sc.name + '.' + object_name(i.object_id) as objectName
    , i.name as indexName
    , user_seeks
    , user_scans
    , user_lookups
    , (user_seeks + user_scans + user_lookups) as indexReads
    , user_updates as indexWrites
    , user_updates - (user_seeks + user_scans + user_lookups) as usageDiff
FROM sys.dm_db_index_usage_stats s
    INNER JOIN sys.indexes i on i.index_id = s.index_id
    INNER JOIN sys.objects o on o.object_id = i.object_id
    INNER JOIN sys.schemas sc on o.schema_id = sc.schema_id
WHERE
    database_id = db_id()
    AND objectproperty(s.object_id,'IsUserTable') = 1
    AND i.object_id = s.object_id
    AND i.type_desc = 'NONCLUSTERED'
ORDER BY
usageDiff DESC |
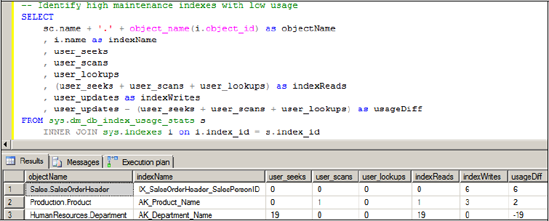
By ordering the results descending on the usageDiff column, this script identifies indexes with the biggest differential between their read and write counts. In the extreme cases where indexReads is zero, the index is being maintained for no read benefits at all. Note that the previous script filters for nonclustered indexes. We can remove this condition to display information on the base table/clustered index as well, including the last accessed stats to display when a table was last used in any capacity.
The result of this script, run against the AdventureWorks database, is shown in figure 13.13. Note that negative values for usageDiff represent cases where the index has been used for read purposes more than for updates.
Figure 13.13. Large differences between the update and usage counts are indicative of high-maintenance/low-value indexes.
It's also possible for some indexes, while valuable and frequently used, to be duplicated or overlapping.
Duplicate and overlapping indexes
A duplicate index, that is, an index with the same columns, defined in the same order, presents a very easy and clear case for removal. In a similar manner, an index that shares the same leading columns can also be considered a duplicate of another index. For example, Index B on lastName, firstName is really a duplicate of Index A on lastName, firstName, dateOfBirth. A number of links to scripts for detecting duplicate and overlapping indexes have been placed on the book's companion website, available at www.sqlCrunch.com/index.
Before dropping duplicate indexes, you should take care to ensure that no existing T-SQL or stored procedure code uses the index(es) as part of an index hint. Dropping such indexes without updating referencing code will obviously result in errors when the (now nonexistent) indexes are referenced.
In this section, we've identified indexes that are candidates for removal. In SQL Server 2005 and above, indexes can be disabled as well as removed or dropped, an important consideration and one that we'll cover when we look at index maintenance later in the chapter. For now, let's look at index analysis from a different perspective: identifying indexes that don't exist.
13.3.2. Identifying indexes to add
The analysis and potential removal of duplicate, unused, or infrequently used indexes can be periodically scheduled as a weekly or monthly maintenance task. In contrast, the addition of indexes is usually the result of a performance-tuning exercise, often started to investigate the sudden or gradual performance decline in one or more queries.
When a query is submitted to SQL Server for execution, the query optimizer determines the ideal index structures for executing the query. If such indexes exist, they're used; otherwise, a suboptimal plan is created with the details of the missing/ideal indexes stored for later reference. Such details can be accessed using one of two methods: the XML query plan and Dynamic Management Views.
XML QUERY PLANS
In its simplest form, the missing-indexes feature can be used for individual queries by inspecting the <MissingIndexes> element of the XML execution plan of a query executed in SQL Server Management Studio. As an example, let's imagine an application change was recently made to support searching AdventureWorks orders by a partial string match on the PurchaseOrderNumber column. Such a query would look like this:
-- Generate a missing index event
SELECT OrderDate, CustomerID, SubTotal, SalesPersonID
FROM Sales.SalesOrderHeader
WHERE PurchaseOrderNumber like 'PO166%'
With no clustered or nonclustered index on the PurchaseOrderNumber column, this query is forced to use a clustered index scan. Let's execute the query after running SET STATISTICS XML ON. The results are shown in figure 13.14.
Figure 13.14. Query results with XML statistics
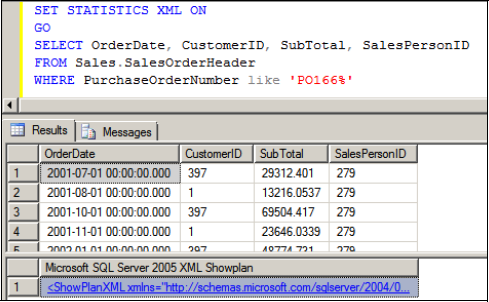
Note the XML that's returned below the result set. Clicking on the XML will open the graphical query execution plan. Right-click the resultant plan and choose Show Execution Plan XML. An example of the resultant XML is shown in figure 13.15.
The part of the XML plan we're interested in is highlighted. The <MissingIndexes> element contains the details of the ideal index that the query optimizer identified as being missing. In this particular case, the suggested index contains the PurchaseOrderNumber column as an index key with the other columns as included columns. Further, the Impact attribute of the <MissingIndexGroup> element estimates a 91.9624 percent improvement in query performance if this index is in place.
Figure 13.15. XML statistics with missing indexes highlighted

Using this information, the create statement for the suggested index would be created as follows:
CREATE NONCLUSTERED INDEX ixSalesOrderHeader_PurchaseOrderNumber
ON Sales.SalesOrderHeader(PurchaseOrderNumber)
INCLUDE (OrderDate, CustomerID, SubTotal, SalesPersonID)
Rerunning the query with the above index in place changes the execution plan from a clustered index scan to a nonclustered index seek without the need for key lookups (courtesy of the included columns). Running the query with SET STATISTICS IO ON confirms the reduction of page reads and the estimated 91 percent improvement suggested in the XML we saw earlier.
Now, this does not mean we should run out and immediately add this index. The recommendation for this particular example is made in isolation from the rest of the workload on the server. If this was a one-off ad hoc query, then adding this index would likely result in a net decrease in performance, given its maintenance requirements and the fact that it would be used infrequently. However, if this is a common query, then perhaps it's a candidate for addition.
SET STATISTICS XML ONIn SQL Server versions prior to 2005, query execution plans could be viewed in text or graphical format. Graphical plans are nice, except when they span more than one screen and you need to send them to someone for analysis. On the other hand, text plans are sometimes difficult to read, especially complex plans. XML plans offer the best of both worlds. They can be saved as XML files for distribution, and when viewed in SQL Server Management studio, they're shown graphically with a right-click option for displaying the XML. Further, the XML can be inspected for details on missing indexes and viewing the compiled-versus-runtime parameter values for assistance in diagnosing parameter-sniffing problems, which we'll cover in chapter 17. |
In essence, XML query plans allow us to access missing index information for a particular query. While this is valuable, what would be really nice would be the ability to look back on previous production workload to identify all of the missing indexes. This is possible using the sys.dm_db_missing_index DMVs.
SYS.DM_DB_MISSING_INDEX DMVS
As we discussed earlier, when the query optimizer uses a suboptimal query plan, it records the details of the missing indexes that it believes are optimal for the query. In addition to viewing these details for a particular query using the XML plans, we can access these details for all queries[] since the SQL instance last restarted through the sys.dm_db_missing_index DMVs. There are four DMVs in this group:
[] Up to 500 missing index groups are maintained by these DMVs.
sys.dm_db_missing_index_details—This DMV returns one record for each missing index and contains columns for suggested key and included columns. Each missing index is identified with an index_handle.
sys.dm_db_missing_index_groups—This DMV acts as a mapping between sys.dm_db_missing_index_details and sys.dm_db_missing_index_group_stats. It contains two columns: index_handle and group_handle.
sys.dm_db_missing_index_group_stats—Each time the same index is identified by the query optimizer as missing, its potential value grows. This DMV stores the accumulated statistics on the index's potential value. Identified with group_handle, the accumulated stats can be traced back to the details of the missing index via the sys.dm_db_missing_index_groups DMV.
sys.dm_db_missing_index_columns—This dynamic management function takes an index_handle as a parameter and returns the missing index's columns in a table format with a column indicating the suggested index column type.
To understand how each of these DMVs operates, let's use our example query from earlier:
SELECT OrderDate, CustomerID, SubTotal, SalesPersonID
FROM Sales.SalesOrderHeader
WHERE PurchaseOrderNumber like 'PO166%'
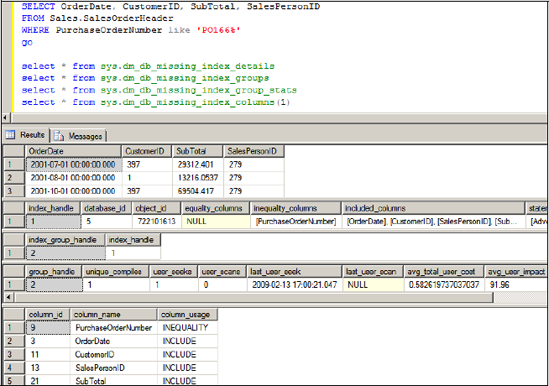
After restarting our SQL instance to clear the contents of the DMVs, we'll run this query, along with inspecting the results of the four DMVs. There are a couple of points to note about what we've done here. First, like the sys.dm_db_index_usage_stats DMV, these DMVs are cleared with each instance restart, so any decision based on their content should be made after the instance has been up and running for a period of time that covers the full range of activity. Second, the value of the sys.dm_db_missing_ index_group_stats DMV is that it accumulates statistics on the potential value of a missing index after repeat misses. In our case, we've missed the index only once since the instance was started, so the figures shown for this DMV are for a single miss. So with these points in mind, let's examine the output from the DMVs, shown in figure 13.16.
First, you'll note that the equality column for sys.dm_db_missing_index_details is empty. This is because there are no equality predicates in our query, for example, where x=10. We used like, so this appears as an inequality column. Second, note that sys.dm_db_missing_index_columns is a function that takes an index_handle as an input and returns index columns in a tabular fashion along with the column usage (equality, inequality, include). In contrast, sys.dm_db_missing_index_details returns one row per missing index.
The real value of these DMVs is when the instance has been up and running for a period of time. This allows us to take advantage of the accumulated statistics from the sys.dm_db_missing_index_group_stats DMV. Books Online has a complete description of the columns returned from this DMV, but there are a few that stand out:
avg_total_user_cost—This column represents the reduction in query cost if the suggested index was present.
Figure 13.16. Missing index information returned from various DMVs
avg_user_impact—This represents the estimated percentage improvement of the query with the index present.
user_seeks and user_scans—Each time the query is executed without the suggested index, these values increment to represent the number of times the index could have been used in either a seek or scan capacity.
When selecting from the sys.dm_db_missing_index_group_stats DMV, we can order by the above columns to show the indexes with the greatest potential for improvement. To simulate this, we can rerun our SalesOrderHeader query multiple times and then query the DMV ordering by the above columns. Listing 13.7 shows the code for this. Note the GO 10 command after the SalesOrderHeader query, used to execute the query 10 times. In addition to this query, we execute another query on the DatabaseLog table, which also generates a missing index event. This allows us to view multiple missing indexes ordered by potential value.
Example 13.7. Simulating activity to view missing indexes by priority
-- Simulate a weighted query workload by using GO 10 for 1 statement SELECT OrderDate, CustomerID, SubTotal, SalesPersonID FROM Sales.SalesOrderHeader WHERE PurchaseOrderNumber like 'PO166%' GO 10 SELECT DatabaseUser, TSQL FROM dbo.DatabaseLog WHERE Event = 'ALTER_TABLE' GO |
Listing 13.8 shows the code to view the missing index information generated by the above two queries, weighted by potential value.
Example 13.8. Missing index DMV query with potential weighting
-- View missing indexes Weighted by potential value
SELECT
     sc.name + '.' + OBJECT_NAME(details.object_id)
     , details.equality_columns
     , details.inequality_columns
     , details.included_columns
     , stats.avg_total_user_cost
     , stats.user_seeks
     , stats.avg_user_impact
     , stats.avg_total_user_cost * stats.avg_user_impact
      * (stats.user_seeks + stats.user_scans) as potential
FROM sys.dm_db_missing_index_group_stats stats
     INNER JOIN sys.dm_db_missing_index_groups groups
       ON stats.group_handle = groups.index_group_handle
     INNER JOIN sys.dm_db_missing_index_details details
       ON details.index_handle = groups.index_handle
    INNER JOIN sys.objects o
       ON o.object_id = details.object_id
    INNER JOIN sys.schemas sc
      ON o.schema_id = sc.schema_id
ORDER BY potential desc |
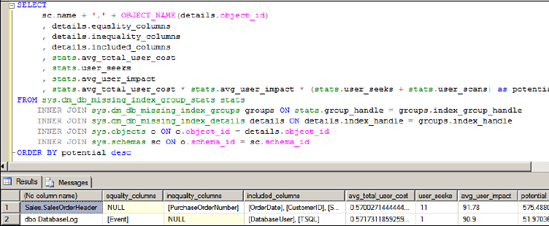
The calculated potential column takes into account the columns from the sys.dm_db_missing_index_group_stats that we covered earlier. By executing the query on the SalesOrderHeader table 10 times (using the GO 10 command), the potential value of the missing index on this table is increased by virtue of the user_seeks column, together with the avg_total_user_cost and avg_user_impact columns. The output from the query in listing 13.8 is shown in figure 13.17.
The potential value for the missing indexes is calculated by multiplying the sum of seeks/scans against the user cost and impact columns. Because the SalesOrderHeaderquery was executed 11 times, its potential weighting is greater compared to a single execution of the query on the DatabaseLog table.
Figure 13.17. Missing index DMV query with weighting potential
The full value of the missing index DMVs can be exploited as part of a regular maintenance routine. For example, weekly checks on index usage to remove duplicate/unused indexes could be combined with checks on the potential for missing indexes using a query similar to the previous one.
Despite the power of the missing index DMVs, there are some limitations, all of which are listed in Books Online. The major ones are as follows:
A maximum of 500 missing indexes will be kept.
The DMVs will be cleared when the SQL instance is restarted or the table definition changes.
While the missing indexes report the columns to include (key and included columns), they don't suggest a column order for the index.
Certain index types, including filtered indexes, clustered indexes, and indexed views, are not suggested.
The Database Engine Tuning Advisor, covered next, addresses some of these shortcomings.
Database Engine Tuning Advisor
The Database Engine Tuning Advisor, accessible in the Performance Tools folder of the Microsoft SQL Server 2008 program group, analyzes workload from either a T-SQL file or SQL Trace file/table. T-SQL files are typically used to analyze a limited set of commands, whereas SQL traces, covered in more detail in chapter 14, are used to analyze workload over a period of time, for example, a 24-hour period covering typical production activity.
Once the workload input has been specified, options can be configured to limit the scope of recommendations that the tuning advisor will consider. Figure 13.18 shows the broad range of options available for consideration.
Figure 13.18. The Database Engine Tuning Advisor can be used to examine a workload and suggest various index types to improve performance.
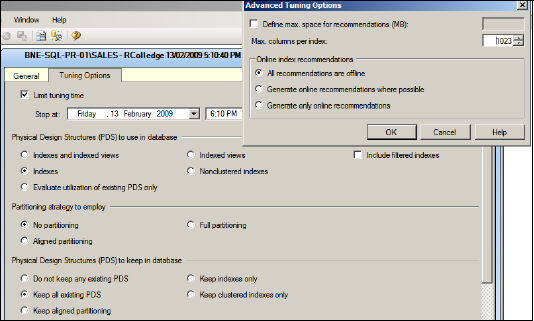
As shown in figure 13.18, the analysis options are far greater than what can be achieved using the missing index DMVs that we covered earlier. Further, the analysis can be based on a wide range of production activity captured in a trace file (or table) for future analysis. In the next chapter, we'll provide more coverage of using SQL Server Profiler to capture production database activity.
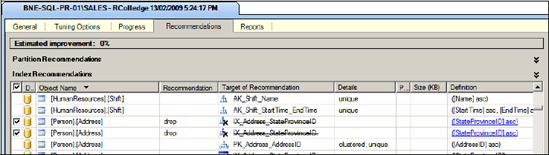
Once the workload input has been selected and a target database chosen, analysis can begin. When the analysis is complete, recommendations can be viewed, an example of which is shown in figure 13.19.
One of the clear advantages of using the tuning advisor over other index analysis methods is the ease with which the recommendations can be turned into actual T-SQL code for implementation. As shown in figure 13.19, you can click the Definition column to display the appropriate T-SQL code to effect the recommendation. Further, the tool can be used for recommendations on indexes to drop as well as those to add.
As per the recommendations from the missing index DMVs, you should carefully consider indexes suggested by the tuning advisor before implementing them. Among others, considerations include these:
Is the workload sufficient to cover the full range of production activity?
Can the suggested recommendations be load/volume tested before production implementation?
A common theme throughout this book is ensuring the existence of a volume test environment where configuration changes can be verified for performance impact before implementing them in production. For suggested index changes, this is crucial.
So far in this section we've covered techniques to identify indexes to add and delete. What's missing is a technique to identify the fragmentation levels of existing indexes that are being used.
13.3.3. Identifying index fragmentation
Indexes, like any other storage object, become fragmented over time through the course of normal insert, delete, and update activity. Identifying the level of fragmentation is a crucial component of a targeted maintenance plan. Later in the chapter we'll look at prioritizing index maintenance based on the level of fragmentation. In this section, our focus is on identifying fragmentation levels, achieved using the sys.dm_db_index_physical_stats dynamic management function.
Figure 13.19. Database Engine Tuning Advisor recommendations are shown after workload analysis is complete.
One of the columns returned from this DMF is avg_fragmentation_in_percent. This indicates the percentage of pages that are out of order, meaning the logical and physical ordering of index pages no longer match, incurring additional disk activity when scanning/seeking. As you'll see later in the chapter, rebuilding or defragmenting an index repositions physical pages to be adjacent to and in line with the logical order.
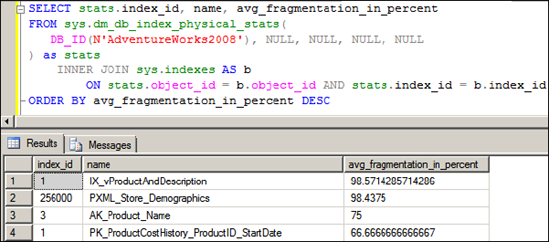
The code displayed in listing 13.9 uses the sys.dm_db_index_physical_stats function to return index fragmentation levels for all tables and indexes in the AdventureWorks database.
Example 13.9. Displaying index fragmentation
-- View index fragmentation ordered by fragmentation level
SELECT stats.index_id, name, avg_fragmentation_in_percent
FROM sys.dm_db_index_physical_stats(
   DB_ID(N'AdventureWorks'), NULL, NULL, NULL, NULL
) as stats
    INNER JOIN sys.indexes AS b
        ON stats.object_id = b.object_id AND stats.index_id = b.index_id
ORDER BY avg_fragmentation_in_percent DESC |
The output of this command, as shown in figure 13.20, is one row for each index in the database, with the avg_fragmentation_in_percent column ordered descending to list the most fragmented indexes first. This list will include clustered indexes, which indicates the level of fragmentation of the table itself.
In previous versions of SQL Server, we used the DBCC SHOWCONTIG command to retrieve, among other things, the logical scan fragmentation value for a given index. While this command is still available, the sys.dm_db_index_physical_stats function is the preferred method. One of the limitations with DBCC SHOWCONTIG is its lack of accuracy when analyzing storage spanning multiple files. In contrast, the sys.dm_db_index_physical_stats function has no such limitations and is therefore the recommended method for index fragmentation analysis.
Figure 13.20. Index fragmentation levels for AdventureWorks tables
Having covered a number of important index-analysis techniques, let's move on now to the actual index-maintenance tasks required to keep our databases performing well.