
2.1. Characterizing I/O workload
To determine an application's ideal storage system and disk quantity, it's important to understand the type and volume of I/O the application will generate. This section focuses on the different types of I/O, the metrics used to classify workload, and methods used in measuring and estimating values for the I/O metrics.
In section 2.2, we'll take the information we've learned here and use it to derive the number of disks required to support an application's I/O workload.
2.1.1. OLTP vs. OLAP/DSS
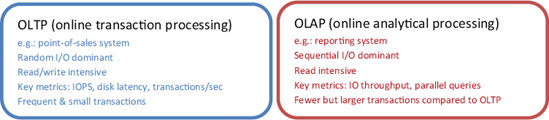
When classifying the nature of I/O, two main terms are used: OLTP and OLAP. An example of an OLTP database is one that stores data for a point-of-sales application, typically consisting of a high percentage of simple, short transactions from a large number of users. Such transactions generate what's referred to as random I/O, where the physical disks spend a significant percentage of time seeking data from various parts of the disk for read and/or write purposes.
In contrast, as shown in figure 2.1, an OLAP, or decision support system (DSS), database is one that stores data for reporting applications that usually have a smaller number of users generating much larger queries. Such queries typically result in sequential I/O, where the physical disks spend most of their time scanning a range of data clustered together in the same part of the disk. Unlike OLTP databases, OLAP databases typically have a much higher percentage of read activity.
Figure 2.1. Characterizing I/O workload is a crucial prerequisite in designing the appropriate storage system. Unlike OLTP, OLAP systems typically consist of fewer but larger sequential read dominant transactions.
Note that even for classic OLTP applications such as point-of-sales systems, actions like backups and database consistency checks will still generate large amounts of sequential I/O. For the purposes of I/O workload classification, we'll consider the main I/O pattern only.
As you'll see a little later, the difference between sequential and random I/O has an important bearing on the storage system design.
2.1.2. I/O metrics
To design a storage system for a database application, in addition to knowing the type of workload it produces (OLTP or OLAP), we need to know the volume of workload, typically measured by the number of disk reads and writes per second.
The process of obtaining or deriving these figures is determined by the state of the application. If the application is an existing production system, the figures can be easily obtained using Windows Performance Monitor. Alternatively, if the system is yet to be commissioned, estimates are derived using various methods. A common one is to use a test environment to profile the reads and writes per transaction type, and then multiply by the expected number of transactions per second per type.
Existing systems
In chapter 17, we'll focus on the methods used to collect and analyze system bottlenecks, including disk I/O bottlenecks. For the purposes of this section, let's assume that disk I/O is determined to be a significant bottleneck and we need to redesign the storage system to correct it. The task, then, is to collect I/O metrics to assist in this process.
We can use the Windows Performance Monitor tool (covered in chapter 14) to collect the disk I/O metrics we need. For each logical disk volume—that is, the drive letter corresponding to a data or log drive—the following counters, among others, can be collected:
PhysicalDisk—Disk reads per second
PhysicalDisk—Disk writes per second
Note that the averages of these values should be collected during the database's peak usage period. Designing a system based on weekly averages that include long periods of very low usage may result in the system being overwhelmed during the most important period of the day.
In the next section, we'll use these values to approximate the number of physical disks required for optimal I/O performance.
New systems
For a system not yet in production, application I/O is estimated per transaction type in an isolated test environment. Projections are then made based on the estimated maximum number of expected transactions per second, with an adjustment made for future growth.
Armed with these metrics, let's proceed to the next section, where we'll use them to project the estimated number of disks required to design a high-performance storage system capable of handling the application load.