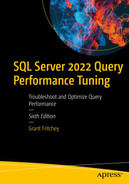
A deadlock is a special form of blocking that occurs when two or more transactions each have locks that the other needs. Since neither transaction can release their locks until the transaction is complete, SQL Server is forced to roll back one of the transactions. An error is returned naming the rolled-back transaction as a deadlock victim. This is fundamentally a performance problem, but one that is exacerbated by the need to roll back the transaction and then resubmit the query for processing a second time. Dealing with deadlocks can be challenging.
Deadlock fundamentals
Analyzing the causes of deadlocks
Error handling for deadlocks
Mechanisms to prevent deadlocks
Deadlock Fundamentals
A diagram consists of sessions 1 and 2. Session 1 has locks held of resource A and Locks requested resource B. Session 2 has locks held of resource B and Locks requested resource A.
A graphical representation of a deadlock
Another way deadlocks occur is when processes attempt to escalate their locks on the same resource. The situation is usually started with each process having a shared lock on a resource, and then both sessions attempt to promote the lock from shared to exclusive. However, the same situation arises; neither can escalate while the other is holding the shared lock, yet neither can release the shared lock either. One of the two processes is then chosen as the deadlock victim.
One other possible way to get deadlocks is when a single session has gone parallel in its operations. It’s possible for a thread to be holding a lock on Resource A, while waiting on Resource B, held by another thread, while the second thread is waiting on Resource A. It’s highly unlikely you’ll see this type of deadlock because Microsoft has changed the code to address it in the more modern versions of SQL Server.
The core issue with deadlocks is that they would simply sit there, blocked, and waiting forever. SQL Server has a secondary process to break the circular block. This process is called the lock monitor. The lock monitor watches for the presence of deadlocks. When a deadlock is detected, one of the sessions gets selected as a victim, usually the process with the smallest estimated cost. In theory, the lowest estimated cost will have the easiest rollback process on its transaction.
Fundamentally, deadlocks are a performance issue. If your queries are running fast enough, taking out minimal locks, and releasing them as fast as possible, you will see very few, if any, deadlocks. Adding to the performance problem, rollbacks use up resources too, so that’s additional overhead. Plus, in most circumstances, the person at the other end of the process chosen as a deadlock victim is just going to resubmit their query, again, using up resources for a second time in an attempt to complete their transaction. All this taken together is why it’s important to minimize, or, where possible, eliminate, deadlocks within your system.
Choosing the Deadlock Victim
Changing the deadlock priority
With this set, the connection, and the queries, will be more likely to be chosen as the deadlock victim. There’s no guarantee that it will always be that way. You can also change the priority to NORMAL or HIGH. When set to HIGH, it’s more likely that the process will never be chosen as a victim.
You also have the option to use numeric values, running from -10 to 10, low to high priority. This gives you the option to get more granular in this level of control if you need to.
Normally, I would not mess with the deadlock priority. If I did, it would generally be on some high value process that I want to try to prevent from being rolled back as a deadlock victim.
If there is a tie in priority, the process with the least cost will be rolled back. There are a few processes, marked in the deadlock graph (more about that later in the chapter), that can’t be the deadlock victim. The only ones I’ve seen do this were processes being rolled back.
Analyzing the Causes of Deadlocks
The sessions involved in the deadlock
The resources under contention, on both sides of the deadlock
The queries executed by each session
Capturing Deadlock Information
Extended Events
Trace flag 1222
Trace Events
Trace flag 1204
I list the methods in this order for several reasons. First, Extended Events are just a more efficient way to capture information within SQL Server. Further, on every machine since SQL Server 2008, unless you explicitly remove it, is an Extended Events session called system_health. Included in system_health is the basic deadlock graph information. You don’t have to enable this; it’s just there.
Next, trace flag 1222 is preferred over trace flag 1204 because it has more detailed information, even though they both work the same way. I also prefer trace flag 1222 over Trace Events because it has far less overhead than Trace Events. That overhead is why Trace Events is third. Trace flag 1204 is last because it has the least information.
I’ll cover the information returned from both Extended Events and trace flag 1204 in the next section: Analyzing the Deadlock Graph. Let’s look at how to configure both data-capturing mechanisms first.
Trace Flag
Enabling the trace flag
- 1.
Open the Properties dialog box of the instance of SQL Server.
- 2.
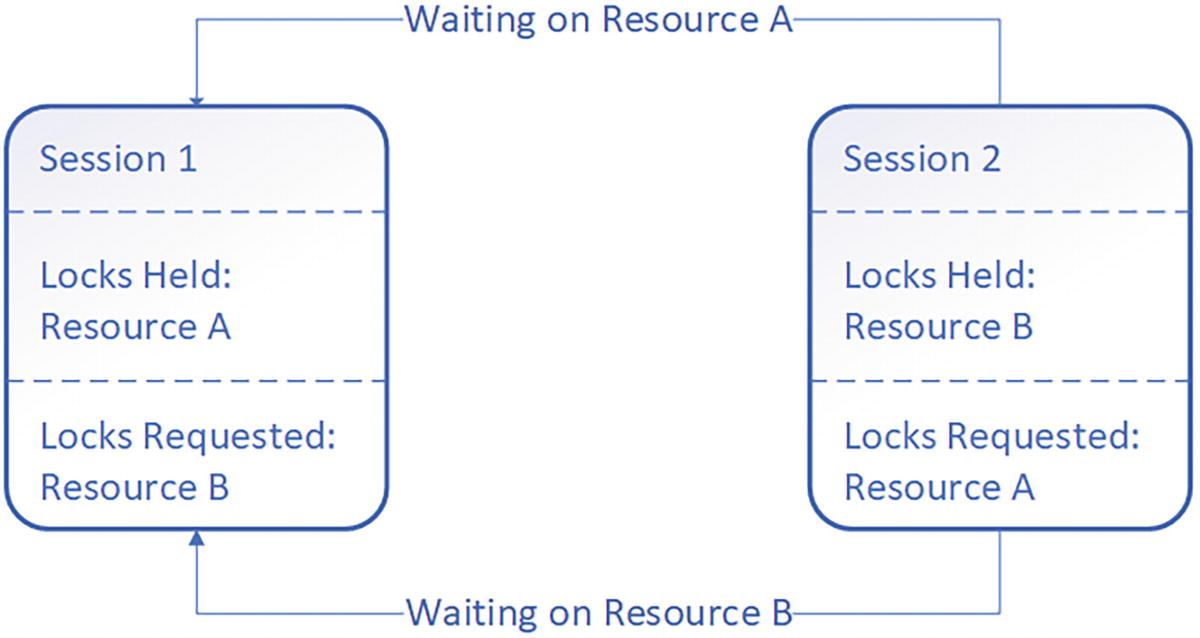
Switch to the Startup Parameters tab of the dialog box, shown in Figure 17-2.
A window of SQL server properties. It includes log on, services, file stream, always on high availability, startup parameters, and advanced options. Startup parameter as minus T 1222. Existing parameters has 3 entries.
SQL Server Configuration Manager window
- 3.
Type -T1222 in the “Specify a startup parameter” text box.
- 4.
Click the Add button.
- 5.
Click the OK button to close the dialog box.
When this instance restarts, the trace flag will be enabled by default.
Output from the trace flag goes to the error log of SQL Server. You’ll have to read it from there.
Extended Events
Querying the system_health Extended Events session
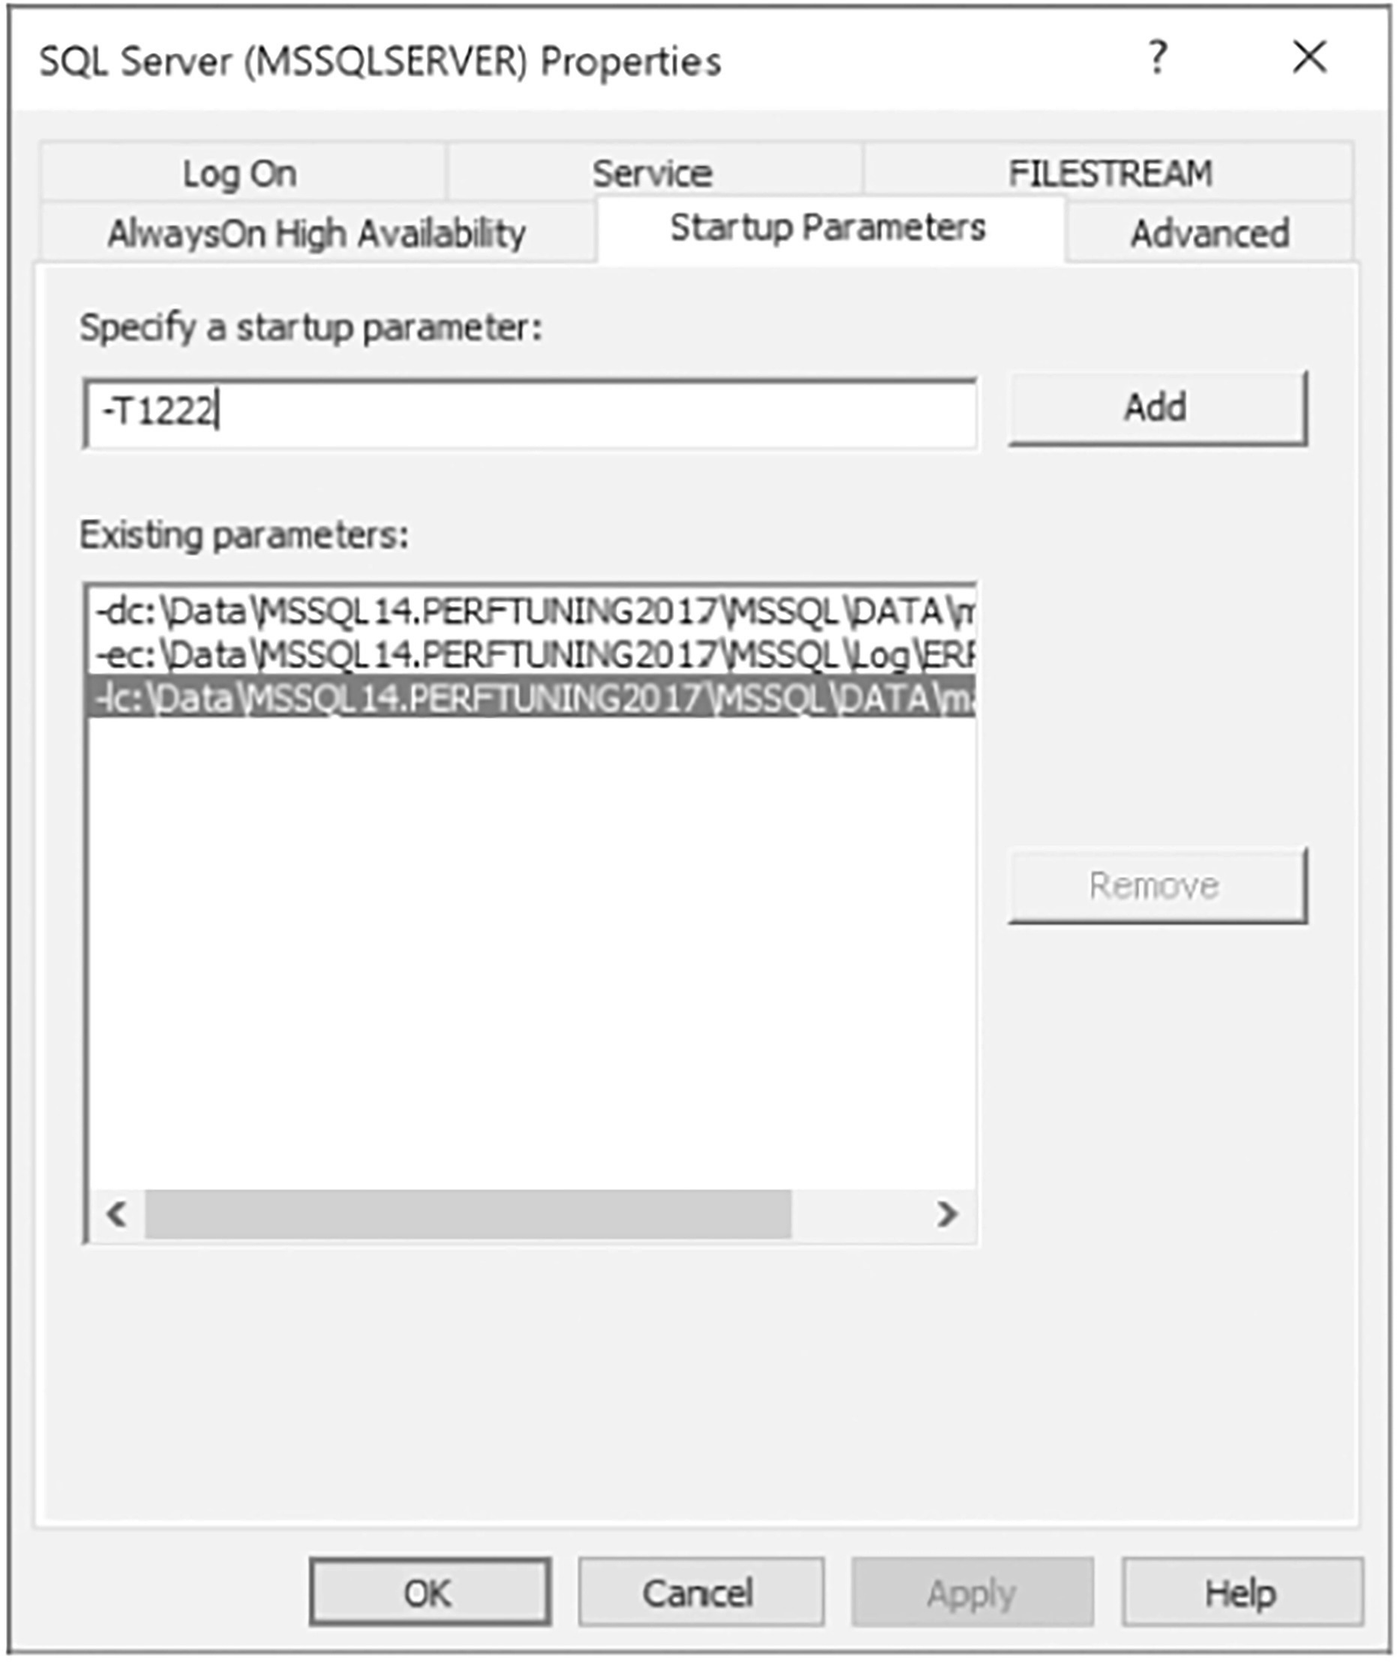
A table has a column and a row. The header is a deadlock graph. Row 1 entries, deadlock, victim list, victim process i d equal process.
Results from querying the system_health session
The system_health session has a fixed number of files, of fixed size. They roll over as they get filled. Depending on the load on your system, you may not see the particular deadlock you’re looking for. Also, my query returned only a single deadlock graph because I’m working on a test system. A production system may return a very large number of deadlock graphs. So while the system_health session is probably the easiest, and functional enough for most, you may want to customize an Extended Events session to capture deadlock graphs.
xml_deadlock_report: The fundamental deadlock graph
xml_deadlock_report_filtered: A deadlock graph with queries removed in order to protect sensitive data
The most common is going to be the first, xml_deadlock_report. The second, xml_deadlock_report_filtered, removes queries so that this information could be used with the General Data Protection Regulation (GDPR) or California Privacy Rights Act (CPRA) or some other privacy regime. That does present a problem since the query is one of the three things we need to resolve deadlocks. However, situationally, it may be the appropriate event to use.
Analyzing the Deadlock Graph
Queries that will cause a deadlock
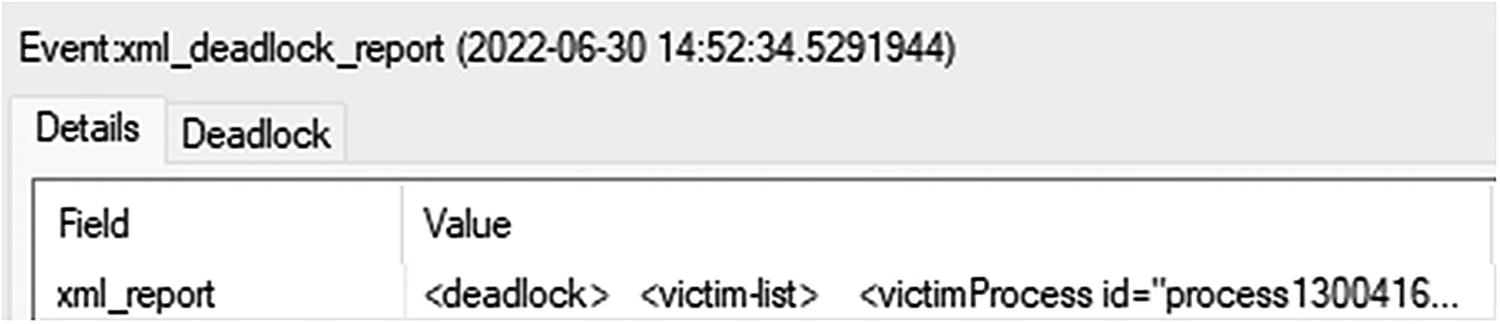
A table for the deadlock report event has 2 columns and 2 rows. Under details, the column headers are fields and values. The field has an XML report.
Information captured by the xml_deadlock_report event
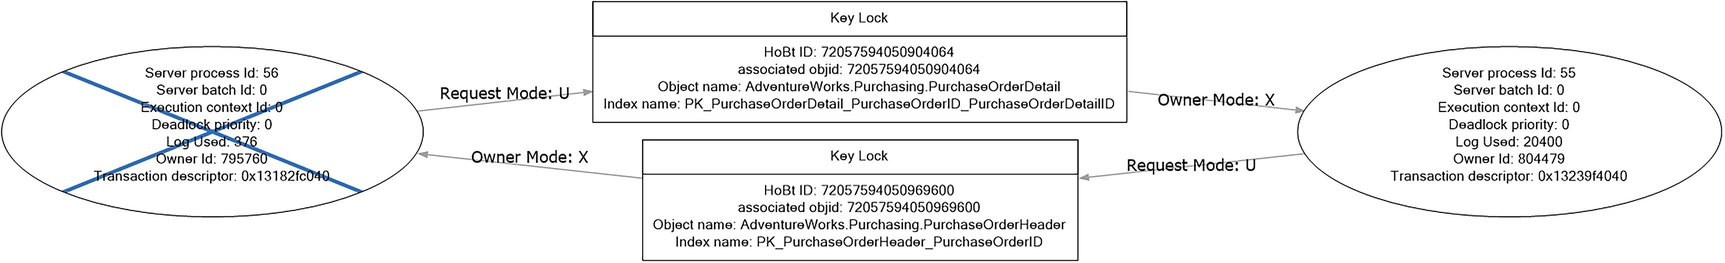
An illustration of a deadlock graph. It exhibits the relationship between owning and requesting objects in key locks.
The graphical representation of the deadlock graph
We immediately see two of the three things we need to evaluate the causes of a deadlock. On the left and the right are the sessions involved in the deadlock. In this case, the victim is the one on the left with the large “x” through it.
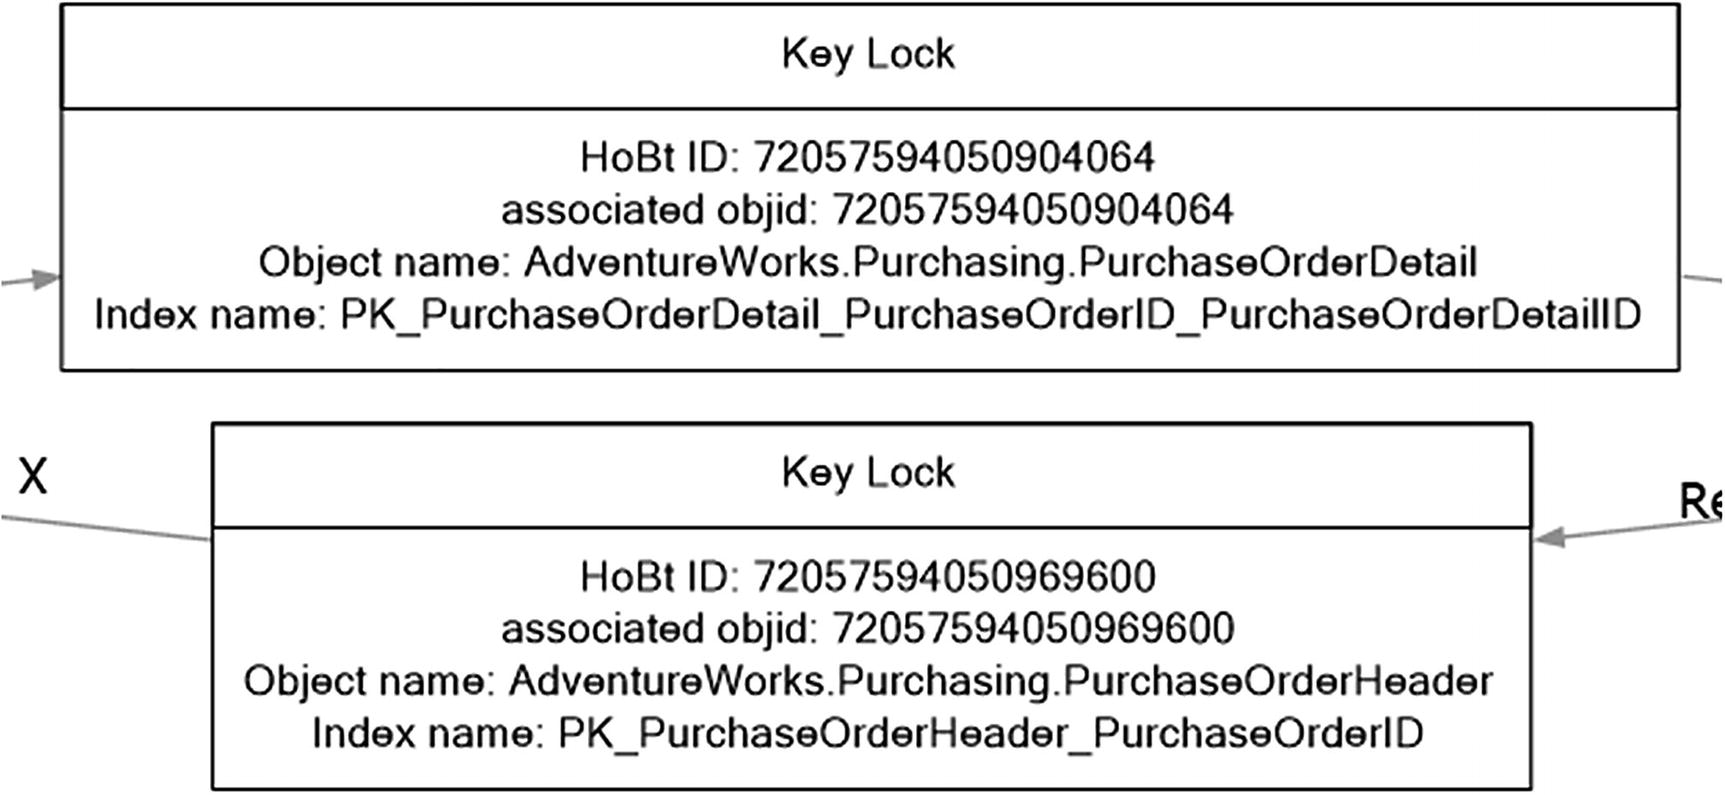
A set of two key lock blocks. It includes H o B t I D, associated obj i d, object name, and index name.
The locks and objects involved in the deadlock
Getting the object_name from the HoBt ID

An oval diagram has the following text. Server process i d, 55. server batch I d, execution context, deadlock priority, 0. Transaction descriptor, 0 x 1323914040
The query for the session involved in the deadlock

A 20 line code of X M L document of the deadlock graph. It includes victim process i d, frame i d, frame proname, update purchasing order details, set order quantity as 4, the product I D, and purchase I D.
A subset of the XML describing the deadlock
Again, you can see the object IDs, key values, queries, and all the rest of the information you need to understand the root causes of this deadlock.
If you look through the details of the XML, you’ll find in this case, there’s code that wasn’t part of what I wrote. That’s because there’s a trigger on the PurchaseOrderDetail table that fired as part of this transaction.
You also have additional information that could prove useful. For example, the sqlhandle can be used, if the query is still in cache or Query Store, to see the full batch that was involved in the deadlock. You’ll have the execution plans for the queries because the plans get built and stored in cache, and the Query Store, prior to the transaction being chosen as a deadlock victim.
XML deadlock graph data
XML Info | Description |
|---|---|
<deadlock> <victim-list> | The beginning of the deadlock information. It immediately starts with the victim processes. |
<victimProcess id="process1300416ca8" /> | Physical memory address of the process picked as the victim. |
<process-list> | Processes that define the victim of the deadlock. There may be more than one involved. Not in this case. |
<process id="process1300416ca8" taskpriority="0" logused="376" waitresource="KEY: 5:72057594050904064 (4ab5f0d47ad5)" waittime="572" ownerId="795760" transactionname="user_transaction" lasttranstarted="2022-06-30T19:52:08.177" XDES="0x13182fc040" lockMode="U" schedulerid="4" kpid="240" status="suspended" spid="56" sbid="0" ecid="0" priority="0" trancount="3" lastbatchstarted="2022-06-30T19:52:33.950" lastbatchcompleted="2022-06-30T19:52:16.613" lastattention="1900-01-01T00:00:00.613" clientapp="Microsoft SQL Server Management Studio - Query" hostname="DESKTOP-DEQGMOV" hostpid="12540" loginname="sa" isolationlevel="read committed (2)" xactid="795760" currentdb="5" currentdbname="AdventureWorks" lockTimeout="4294967295" clientoption1="671090784" clientoption2="390200"> <stackFrames> <frame id="00" address="0x3FFFA0992717" pdb="sqlpal.pdb" age="1" guid="2148D596-D088-44AF-8A8E-E613596D33CF" module="sqlpal.dll" rva="0x392717" /><frame id="01" address="0xFFFFFFFFFFFFFFFF" /><frame id="02" address="0x10E149CB90" /><frame id="03" address="0xFFFFFFFDE943B9C7" /><frame id="04" address="0x132144C000" /> </stackFrames> <executionStack> <frame procname="adhoc" line="1" stmtstart="64" stmtend="278" sqlhandle="0x02000000d0c7f31 a30fb1ad425c34357fe8ef6326793 e7aa0000000000000000000000000000000000000000"> unknown </frame> <frame procname="adhoc" line="1" stmtend="222" sqlhandle="0x02000000f4349d3899 cff20344d9e8029adb969c032ee18 a0000000000000000000000000000000000000000"> unknown </frame> | All the information about the session picked as the deadlock victim. |
</executionStack> <inputbuf> UPDATE Purchasing.PurchaseOrderDetail SET OrderQty = 4 WHERE ProductID = 448 AND PurchaseOrderID = 1255; </inputbuf> </process> | |
<process id="process1311b33468" taskpriority="0" logused="20400" waitresource="KEY: 5:72057594050969600 (4bc08edebc6b)" waittime="7127" ownerId="804479" transactionname="user_transaction" lasttranstarted="2022-06-30T19:52:21.280" XDES="0x13239f4040" lockMode="U" schedulerid="1" kpid="1020" status="suspended" spid="55" sbid="0" ecid="0" priority="0" trancount="3" lastbatchstarted="2022-06-30T19:52:27.303" lastbatchcompleted="2022-06-30T19:52:25.420" lastattention="1900-01-01T00:00:00.420" clientapp="Microsoft SQL Server Management Studio - Query" hostname="DESKTOP-DEQGMOV" hostpid="12540" loginname="sa" isolationlevel="read committed (2)" xactid="804479" currentdb="5" currentdbname="AdventureWorks" lockTimeout="4294967295" clientoption1="673319008" clientoption2="390200"> <stackFrames> <frame id="00" address="0x3FFFA0992717" pdb="sqlpal.pdb" age="1" guid="2148D596-D088-44AF-8A8E-E613596D33CF" module="sqlpal.dll" rva="0x392717" /><frame id="01" address="0x5CD0FFFFFFFF" /><frame id="02" address="0x10E149CB90" /><frame id="03" address="0xFFFFFFFFFFF68A20" /><frame id="04" address="0x10821A2B99" pdb="sqlmin.pdb" age="2" guid="64A716B4-2836-4AEE-BE5A-D9CCB4066C0F" module="sqlmin.dll" rva="0x12B99" /><frame id="05" address="0x1088914C21" pdb="SqlDK.pdb" age="2" guid="B5987070-BA8C-4403-8529-567D529CF9F4" module="sqldk.dll" rva="0x4C21" /><frame id="06" address="0x600" /> | The second process involved in the deadlock. This one includes not just information about the query I submitted, near the bottom with the inputbuf, but also the trigger, in the call stack. |
</stackFrames> <executionStack> <frame procname=”AdventureWorks.Purchasing.uPurchaseOrderDetail” line=”39” stmtstart=”2732” stmtend=”3830” sqlhandle=”0x030005002599 9f1142d8ef0019a800000000000 0000000000000000000000000000000000000000000000000”> UPDATE [Purchasing].[PurchaseOrderHeader] SET [Purchasing].[PurchaseOrderHeader].[SubTotal] = (SELECT SUM([Purchasing].[PurchaseOrderDetail].[LineTotal]) FROM [Purchasing].[PurchaseOrderDetail] WHERE [Purchasing].[PurchaseOrderHeader].[PurchaseOrderID] = [Purchasing].[PurchaseOrderDetail].[PurchaseOrderID]) WHERE [Purchasing].[PurchaseOrderHeader].[PurchaseOrderID] IN (SELECT inserted.[PurchaseOrderID] FROM inserted </frame> <frame procname=”adhoc” line=”2” stmtstart=”64” stmtend=”278” sqlhandle=”0x02000000d0c7f31a30fb1 ad425c34357fe8ef6326793e7aa000000000 0000000000000000000000000000000”> unknown </frame> <frame procname=”adhoc” line=”2” stmtstart=”38” stmtend=”260” sqlhandle=”0x02000000dd281331f05b87 69e24f99d2bd5ec6e2b696956d000000000 0000000000000000000000000000000”> | |
unknown </frame> </executionStack> <inputbuf> BEGIN TRANSACTION UPDATE Purchasing.PurchaseOrderDetail SET OrderQty = 2 WHERE ProductID = 448 AND PurchaseOrderID = 1255; </inputbuf> </process> </process-list> | |
<resource-list> <keylock hobtid="72057594050904064" dbid="5" objectname="AdventureWorks.Purchasing.PurchaseOrderDetail" indexname="PK_PurchaseOrderDetail_ PurchaseOrderID_PurchaseOrderDetailID" id="lock1307c3f600" mode="X" associatedObjectId="72057594050904064"> <owner-list> <owner id="process1311b33468" mode="X" /> </owner-list> <waiter-list> <waiter id="process1300416ca8" mode="U" requestType="wait" /> </waiter-list> </keylock> <keylock hobtid="72057594050969600" dbid="5" objectname="AdventureWorks.Purchasing.PurchaseOrderHeader" indexname="PK_PurchaseOrderHeader_PurchaseOrderID" id="lock131867c080" mode="X" associatedObjectId="72057594050969600"> <owner-list> <owner id="process1300416ca8" mode="X" /> </owner-list> <waiter-list> <waiter id="process1311b33468" mode="U" requestType="wait" /> </waiter-list> </keylock> </resource-list> </deadlock> | Finally, the objects involved in the deadlock, the types of locks, the lock owners, pretty much everything to determine where the problem occurred. |
So this example is a classic deadly embrace. It’s not immediately apparent, but the deadlock is caused by the trigger. When the Quantity value gets updated on the PurchaseOrderDetail table, it attempts to update the PurchaseOrderHeader table. When the first two queries are run, it’s just a blocking situation. The second query is waiting on the first to clear so that it can also update the PurchaseOrderHeader table. However, when the next query within the PODSecond transaction from Listing 17-4 gets run, we are now in a deadlock scenario. That means one of the transactions gets chosen as the victim and is then rolled back.
Error Handling for Deadlocks
When a deadlock occurs, SQL Server raises an error with the error number value of 1205. This means you can use the TRY/CATCH construct within T-SQL to handle the error. Because SQL Server has to protect the integrity of the data, it immediately rolls back a transaction chosen as a deadlock victim. What you can do is attempt to restart the transaction. However, in the interest of performance, I would only attempt it a few times before just letting go and returning the error to the calling application.
Trapping a deadlock error
The idea is simple. You know the error number will be 1205. Check to see if that’s what happened. If so, try again, but not too many times. I have two attempts shown here. I wouldn’t go beyond three personally—the reason being each attempt takes time, resources, and more. Further, on each attempt, the person making the request is waiting. The longer the wait, the more likely they’ll just kill the connection or relaunch the query themselves.
While this lets you easily, and automatically, retry a transaction, your best approach is to analyze the deadlock and resolve it, if possible.
Mechanisms to Prevent Deadlocks
Access resources in the same order.
Decrease the amount of resources accessed.
Minimize lock contention.
Tune your queries.
Access Resources in the Same Order
As I showed in the example deadlock in Listing 17-4, the easiest way to get a deadlock is to try to get locks on resources in the opposite order from two different transactions. If two transactions are attempting to access resources in exactly the same order, the very first exclusive lock taken by the first transaction will block the second. At no point will the second transaction have a way to take locks because it’s still waiting on the first one. It’s that simple.
One thing to watch for is generated code from tools like NHibernate or Entity Framework that can create transactions that do access tables and indexes in a very mixed order. You can work directly with the development teams to ensure that doesn’t happen (changes in how the code is generated quickly fix the issue). While having your code in stored procedures or prepared statements means it's repeatable in its execution, you can still mess up the order within those procedures.
Decrease the Amount of Resources Accessed
Convert a nonclustered index to a clustered index.
Use a covering index.
Convert a Nonclustered Index to a Clustered Index
Since the data isn’t stored with a nonclustered index, you get at least two locks: one for the data (either a cluster or a heap) and one for the nonclustered index. Since a clustered index stores the data, you can see fewer locks. You may be in a situation where you need to convert your heap table to a clustered index (almost always the better choice), or you have your clustered index in the wrong place. It’s possible converting your nonclustered index to a clustered index may help with the deadlocks. Testing and validation would be a requirement in this situation.
Use a Covering Index
A covering index decreases the number of resources needed for some queries. If a covering index is used, then locks don’t have to be taken out on the heap or clustered index. That may help to alleviate deadlocks.
Minimize Lock Contention
Implement row versioning.
Decrease the isolation level.
Use locking hints.
Implement Row Versioning
Implementing one of the row-versioning mechanisms, SNAPSHOT, or, even better, READ_COMMITTED_SNAPSHOT, you can immediately reduce the contention caused by reads. Blocking reduction is the entire point of row versioning. Since they reduce locks, they help prevent deadlocks.
This is not a magic switch. You do have to take into account the added overhead on tempdb. Also, not all reads are helped by row versioning, just the ones taking part on data actively being modified. Still, reducing locking at any point will help with deadlocks.
Decrease the Isolation Level
At times, the shared lock required for a SELECT statement helps contribute to the formation of circular blocking. Reducing the isolation level of your databases can help reduce the amount of shared locks needed. As with anything else, there are trade-offs. You may require the more stringent isolation level for business or other purposes.
Use Locking Hints
NOLOCK
READUNCOMMITTED
Like the READ UNCOMMITTED isolation level, the NOLOCK and READUNCOMMITTED locking hints avoid shared locks entirely. That will help with deadlocks.
Using the locking hints can be a good idea since they only affect the objects referenced in a given query. Conversely, some organizations require the NOLOCK hint on every query, and you’d be better off using the READ UNCOMMITTED isolation level instead.
Once more, except in very targeted circumstances, this is a poor practice.
Tune the Queries
Since deadlocks are all about performance, making queries faster will mitigate the number of deadlocks. If all queries are completed before any resource contention even occurs, the chances of a deadlock are zero.
Summary
This chapter has shown you how to understand the “deadly embrace” that defines a deadlock. Remember that the focus of your attention should initially be in identifying the queries at the root cause. The best way to retrieve this information is through the system_health Extended Events session, or by setting up your own session using the xml_deadlock_report event.
There are a number of ways to avoid deadlocks depending on the queries involved. You can address deadlocks by introducing or adjusting indexes. However, most of the time, the required fix is going to be adjusting code to run your queries differently.
Never forget, at the core of it all, deadlocks are about performance and contention. Anything you do to increase performance or reduce contention will also help you address deadlocks on your systems.
The next chapter talks about cursors and their impacts on performance.