Certain aspects of query tuning, especially around simple index creation and recognizing a superior execution plan, are mechanical in nature. A simple evaluation (this makes things faster, or it doesn’t) is all that’s needed in some situations. With this in mind, Microsoft has automated some aspects of index creation in Azure SQL Database. Also, certain plan choices can be automated within SQL Server and Azure SQL Database. While these mechanisms will absolutely help, especially in the situation where you manage thousands or more databases, you’ll still have to develop query tuning skills as well.
Automatic plan correction
Azure SQL Database automatic index management
Automatic Plan Correction
The simple ability that Query Store offers (detailed in Chapter 6) is a way to track query and plan behavior over time. With that ability, Microsoft simply wrote functionality into SQL Server that takes advantage of that information. When you can tell that, for a given query, performance degraded after a recompile, getting the last good plan just makes sense.
- 1.
Monitor query performance, using Query Store, and note when a query’s performance degrades.
- 2.
Determine if that regression is from a change in plan.
- 3.
If the plan changed, force the last plan.
- 4.
Measure performance again to determine if that helped.
- 5.
If performance degrades or doesn’t improve, undo the change.
While there is doubtless a lot more to this process internally, externally, that’s what’s happening.
Within SQL Server, this behavior is not on by default. Within Azure SQL Database, it is.
Tuning Recommendations
First, you have to be running SQL Server 2017 or greater, or be in Azure SQL Database. Then, Query Store must be enabled. From this point, SQL Server is already capturing the data needed to identify regressed plans.
Creating indexes and procedures and preparing Query Store
Establishing two different query performance histories
Retrieving tuning recommendations

A table displays the result of a query and has 5 columns and 1 row. The column headers are type, reason, state, score, and details, and the first entry, force last good plan is highlighted.
Tuning recommendations from sys.dm_db_tuning_recommendations
Details from sys.dm_db_tuning_recommendations
planForceDetails | ||
|---|---|---|
queryID | 3 | |
queryHash | 0x5F791E9D3FE1F510 | |
regressedPlanId | 2 | |
regressedPlanHash | 0x04CB9DE3C20315A3 | |
regressedPlanExecutionCount | 15 | |
regressedPlanErrorCount | 0 | |
regressedPlanCpuTimeAverage | 4.607720933333334e+006 | |
regressedPlanCpuTimeStddev | 3.505710886737305e+006 | |
recommendedPlanId | 1 | |
recommendedPlanHash | 0x6F1B019D25F6B1A2 | |
recommendedPlanExecutionCount | 30 | |
recommendedPlanErrorCount | 0 | |
recommendedPlanCpuTimeAverage | 1.033666666666667e+003 | |
recommendedPlanCpuTimeStddev | 1.756888031593228e+002 | |
implementationDetails | ||
method | TSql | |
Script | exec sp_query_store_force_plan @query_id = 3, @plan_id = 1 |
We have yet to enable automated tuning, yet we could put this to work in our own systems. Not only has it identified a query that is clearly regressed based on the execution plan change, but it has provided us with the precise T-SQL to fix the situation.
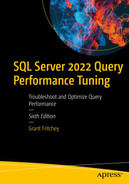
A diagram of the original execution plan of the stored procedure, d b o dot product by cost.
First execution of dbo.ProductByCost
Since the query returns only a single row for the value of 54.838, this plan makes sense. By executing it 30 times, I establish a basis of behavior for the query. Please note that 30 seems to work, but that’s not a guaranteed value. Microsoft may move that up or down as they see fit.
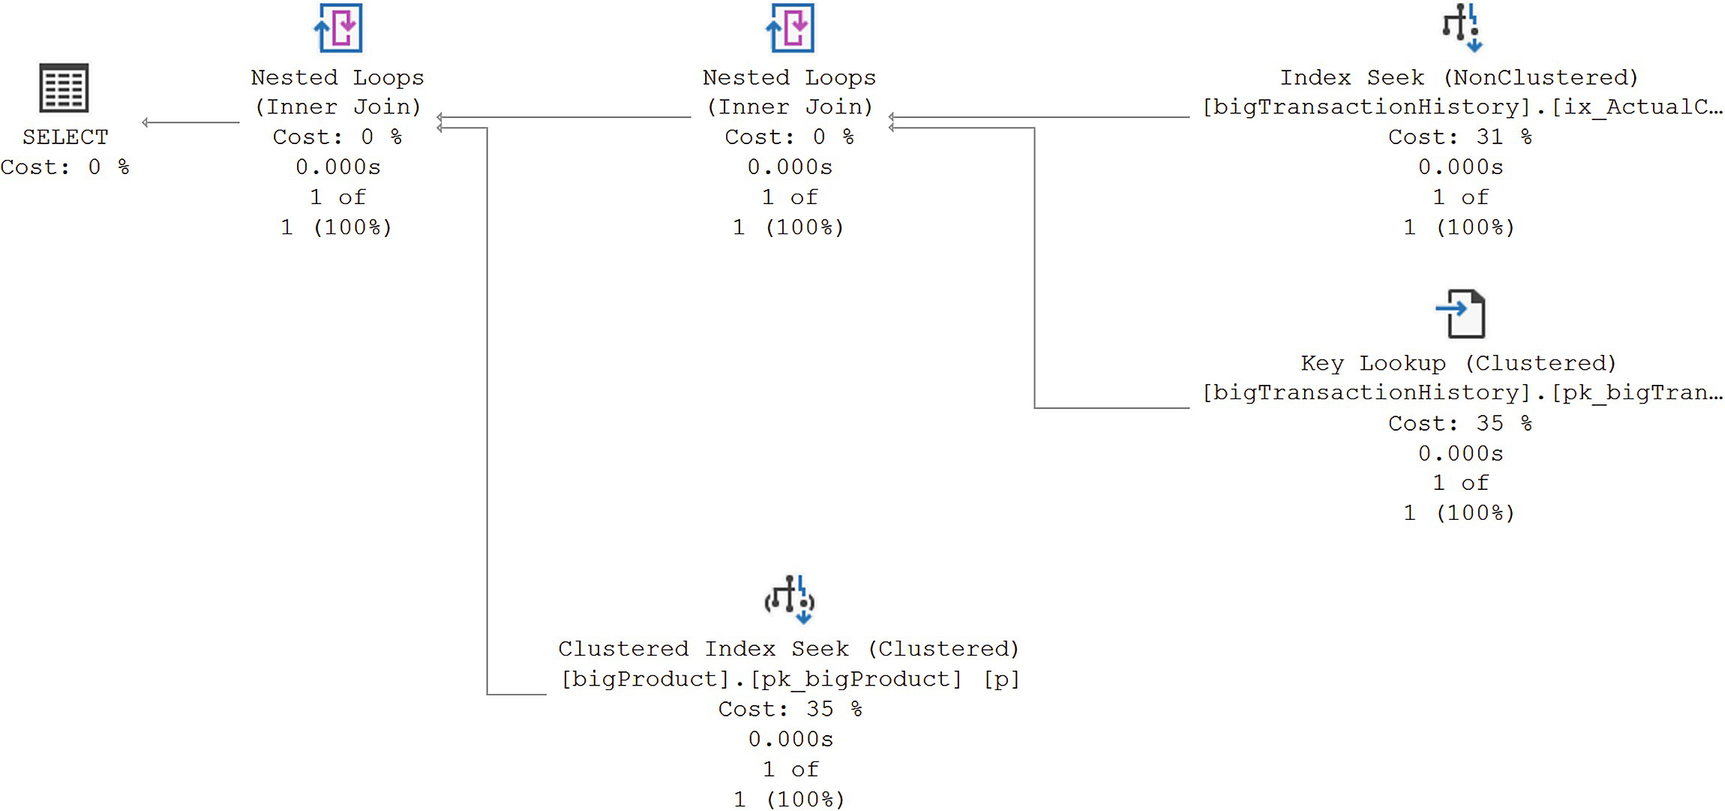
A diagram of the execution plan of d b o dot product by cost, after using the value of 0.0.
Second execution of dbo.ProductByCost after recompile
Since 12 million of the 30 million-row table is returned by this query, this execution plan also makes a lot of sense. However, you can clearly see that one of these plans is optimized for a very large data set, while the other plan is optimized for a very small data set. That difference alone is why performance went from just over 1ms to 4,607ms.
Combining multiple result sets to get detailed recommendations
With this information in hand, you have everything you need to make your own choice as to whether or not to use plan forcing to fix the problem. You may even decide other solutions are needed. However, these mechanisms give you a fast way to identify problematic queries that may need tuning.
The information in sys.dm_db_tuning_recommendations doesn’t survive a restart or failover of the instance. If the database goes offline, this data is also lost. You’ll need your own mechanisms to protect this data if you want it to survive a reboot.
Enabling Automatic Tuning
There are two different ways to enable automatic tuning. One is for Azure, and the other is for a SQL Server instance. You must also be running Query Store on the database in question, which is likely since Query Store is now on by default in both SQL Server 2022 and Azure. Azure supports two mechanisms: the portal and T-SQL. SQL Server requires that everything be done through T-SQL. I’ll show you the Azure portal, and then I’ll use T-SQL on SQL Server. It will work the same within Azure when using T-SQL.
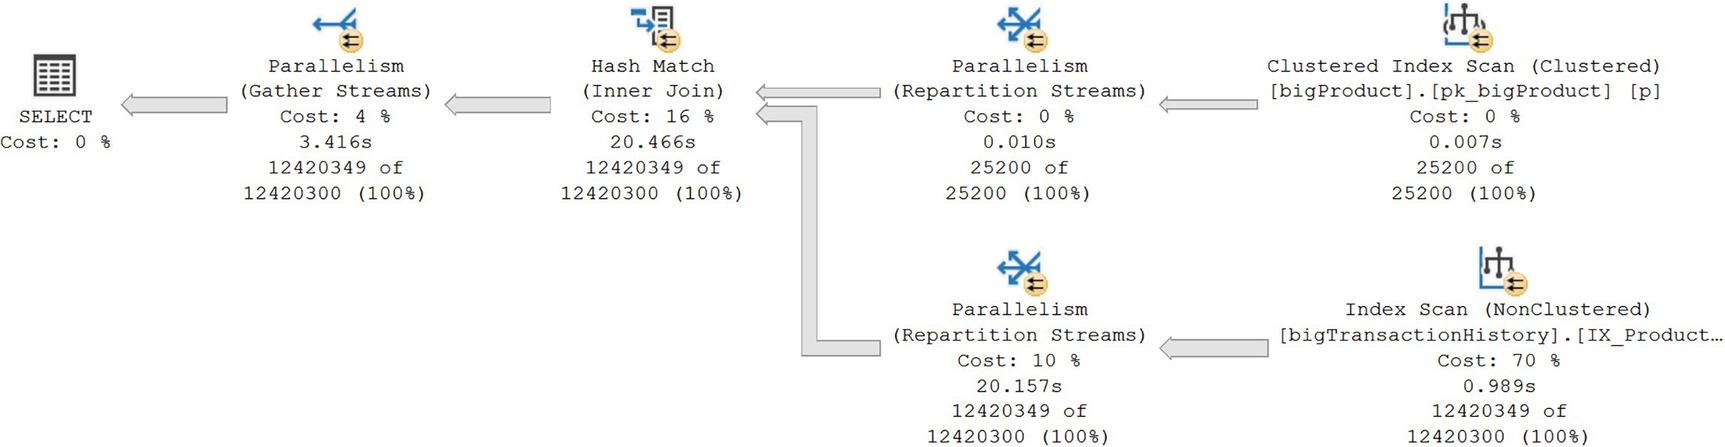
The Azure portal is frequently updated. Screen captures in this book may be out of date at the time you read it. You may see some difference in the graphics and layout.
Azure Portal
A webpage displays the Azure S Q L database portal, where the settings on the left side have a detailed view on the right side.
The Azure SQL Database portal
A context menu of Intelligent Performance has 4 options. The option of automatic tuning is highlighted.
Intelligent Performance selection in Azure portal

A webpage displays the features of automatic tuning of the Azure S Q L database. For each option, the desired state can be switched from on, off, or inherit.
Automatic tuning features of the Azure SQL Database
I’ve already switched my FORCE PLAN from INHERIT to ON. I then have to click on Apply at the top of the screen.
We’ll be covering the other two options later in this chapter in the “Azure SQL Database Automatic Index Management” section.

A webpage displays the recommendation and tuning history sections of the portal.
Performance recommendations on the portal
This part of the behaviors within Azure is basically the same as on an instance of SQL Server. You can manually apply recommendations if you have the automation turned off. This information can also be lost since it’s stored in the same DMVs as a SQL Server instance.
SQL Server
Enabling automatic tuning using T-SQL
To disable it, you simply run the same command to OFF. You can substitute a database name for the word CURRENT I used in the example.
Automatic Tuning in Action
Validating the status of automatic tuning
Before re-running Listing 22-2, you might want to clear both Query Store and the cache. That ensures that you’re starting from a clean slate. I only recommend that for testing and development systems. On a production system, you can pull the information for a single query from Query Store and the same with the cache.

A table of results has 5 columns and 1 row, the column headers are query i d, reason, score, current state, and current state reason, the row entry that reads 3, is highlighted.
Results in place with automatic tuning in action
The CurrentState value is now Verifying. This means that SQL Server will continue measuring performance to validate that choosing the last plan was a good decision. If performance doesn’t improve or gets worse, then the forced plan will be removed by SQL Server, completely automatically. If there are errors or timeouts, you’ll also see the plan forcing removed. That will also mark the plan as error_prone in the sys.dm_db_tuning_recommendations.
If the server were to restart, all the information in sys.dm_db_tuning_recommendations is removed, as I’ve stated several times already. However, any plans that are forced, such as the one for dbo.ProductByCost, will remain forced. However, the verification process, if it wasn’t complete, won’t be completed.
If you look at the plan through the Query Store DMVs, reports, or even look for the Use Plan property in the execution plan, they’ll all be there as if it were a normally forced execution plan. To all respects, it is a normal forced plan.
Azure SQL Database Automatic Index Management
Azure SQL Database is defined as a Platform as a Service (PaaS). In this case, the platform on offer is a SQL Server database. This means that patching, backups, high availability, corruption, and more are all managed by Microsoft through the Azure platform. Adding in the concept of automatic index creation and index drops is perfectly in line with the idea of a PaaS offering of a database.
Since Microsoft has full control over the hardware running within their data centers in Azure, they can also put to work all the information they have with machine learning and analysis. These are incorporated into their management of Azure SQL Database in general and the Automatic Index Management in particular.
Please note that Microsoft doesn’t gather private information from your queries, data, or any of the information stored there. It simply uses the query metrics to measure behavior. You need to know this because there is still misinformation regarding this topic being passed around.
Creating stored procedures on the AdventureWorksLT database
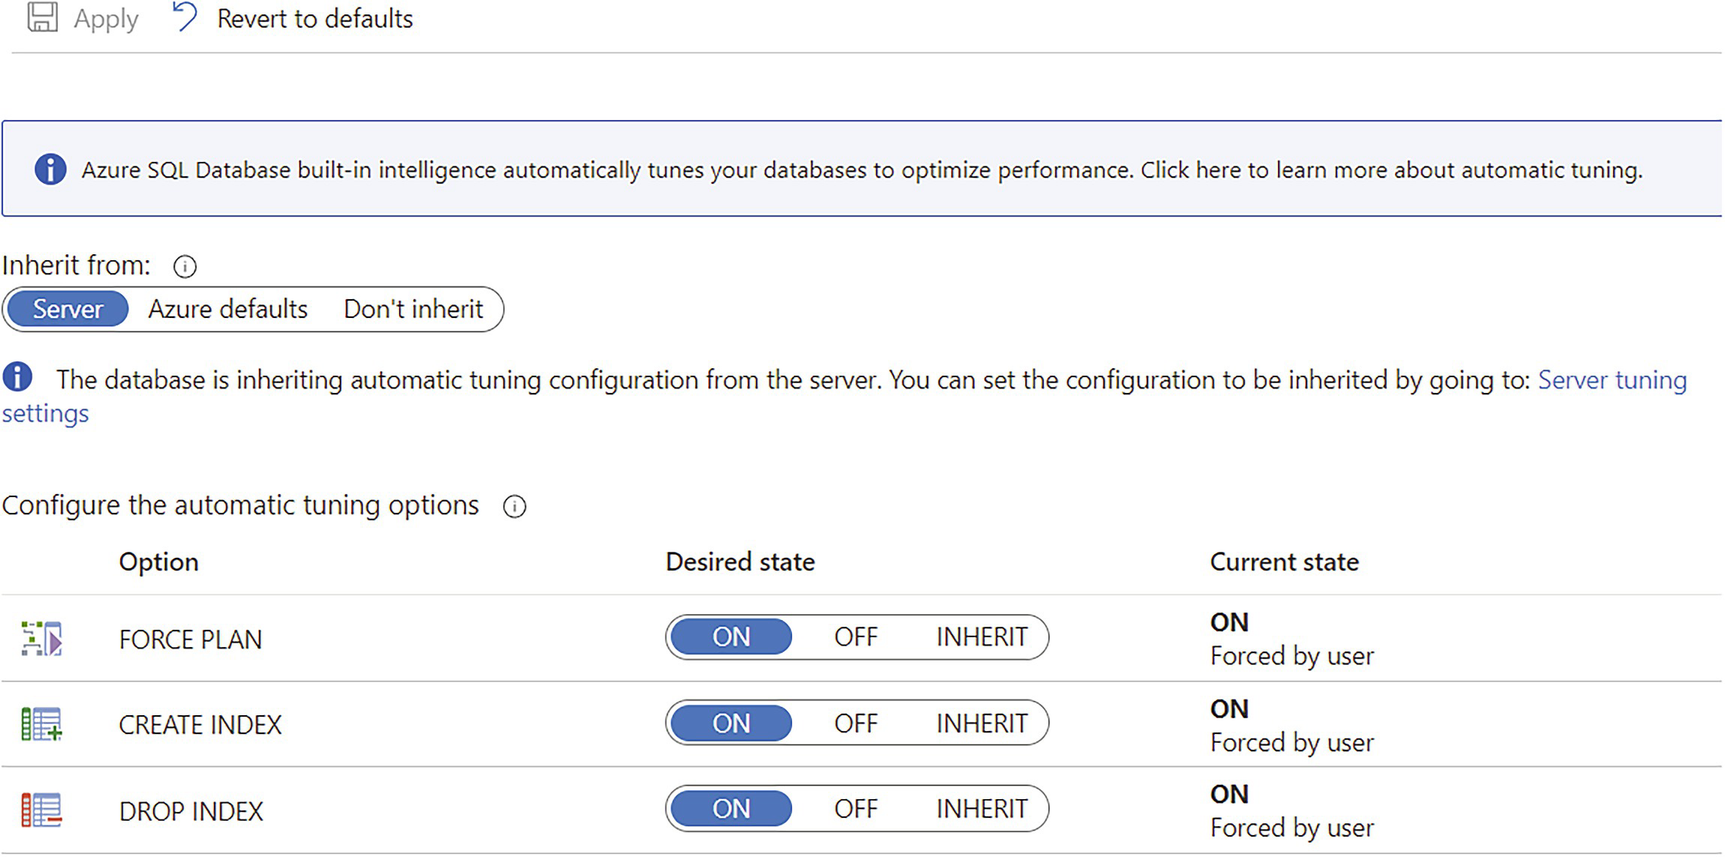
A webpage displays the 3 possible automatic tuning, force plan, create index, and drop index, with their desired states all turned on.
Enabling all possible automatic query performance tuning in Azure
PowerShell to execute the procedures in a loop
You also have to ensure that you have Query Store turned on. It’s on by default in Azure SQL Database, so unless you’ve explicitly turned it off, it’s available. If you’ve turned Query Store off, turn it back on.
We analyzed your database and found that your database was created recently. At this time, we don’t have any recommendations.
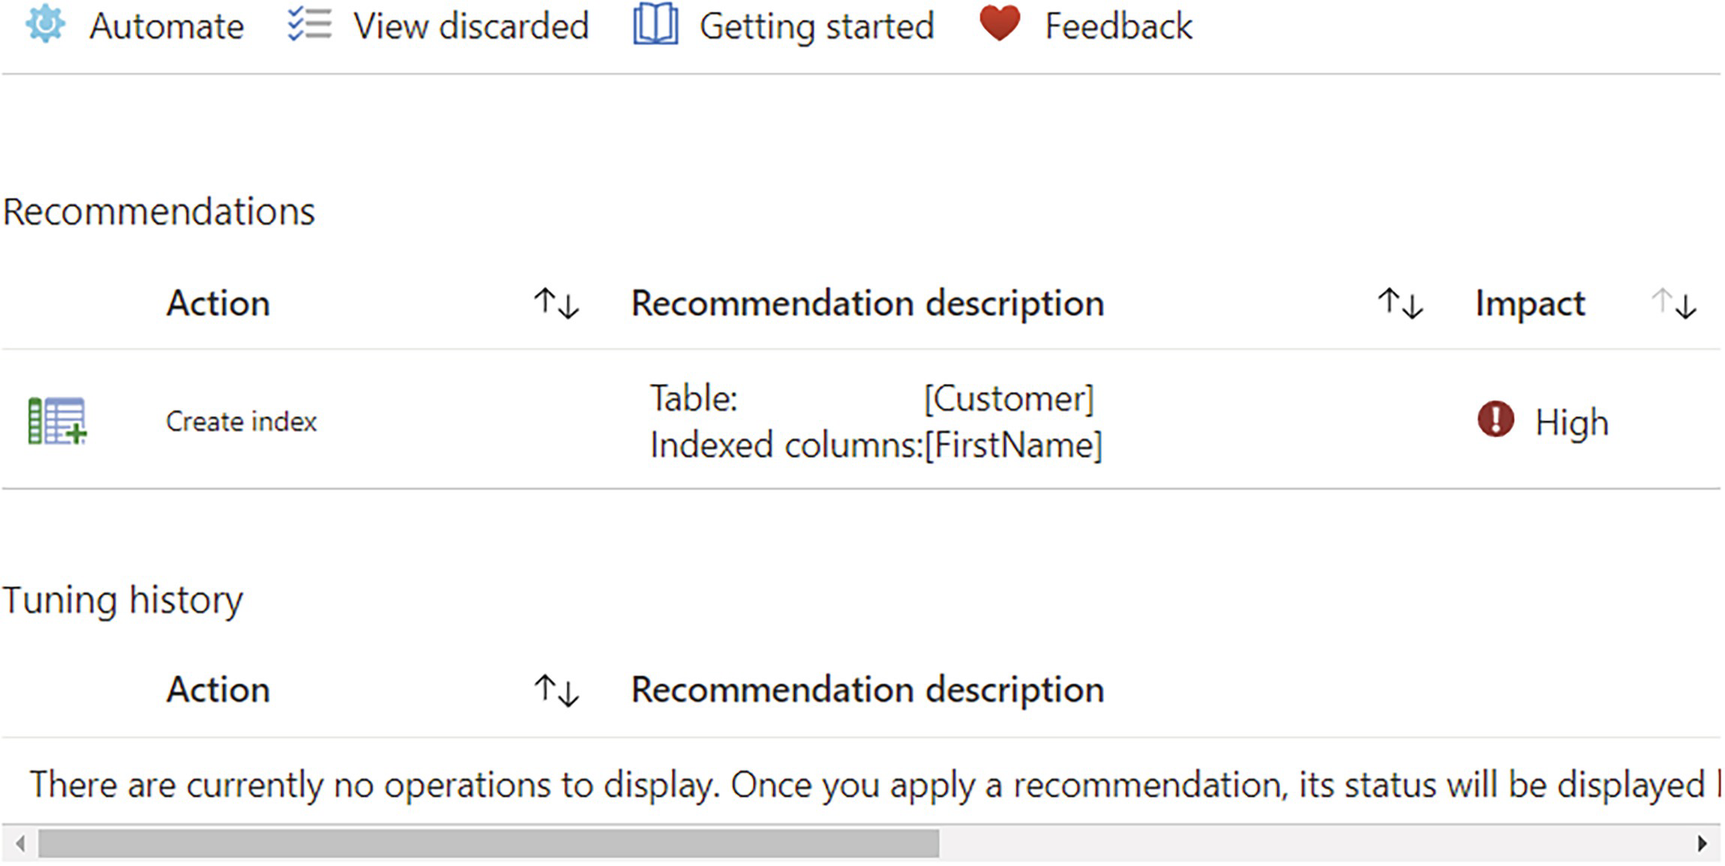
A webpage displays a newly-made index tuning recommendation, on the recommendation's sections with a table with 3 columns, action, recommendation description, and impact.
An index tuning recommendation has been made
If you look at the queries from Listing 22-7, each one has a missing index recommendation. They were intentionally written to query data not covered by a good index in order to get scans and Key Lookup operations. These are the precise kinds of queries that are covered by that somewhat mechanical performance tuning process.
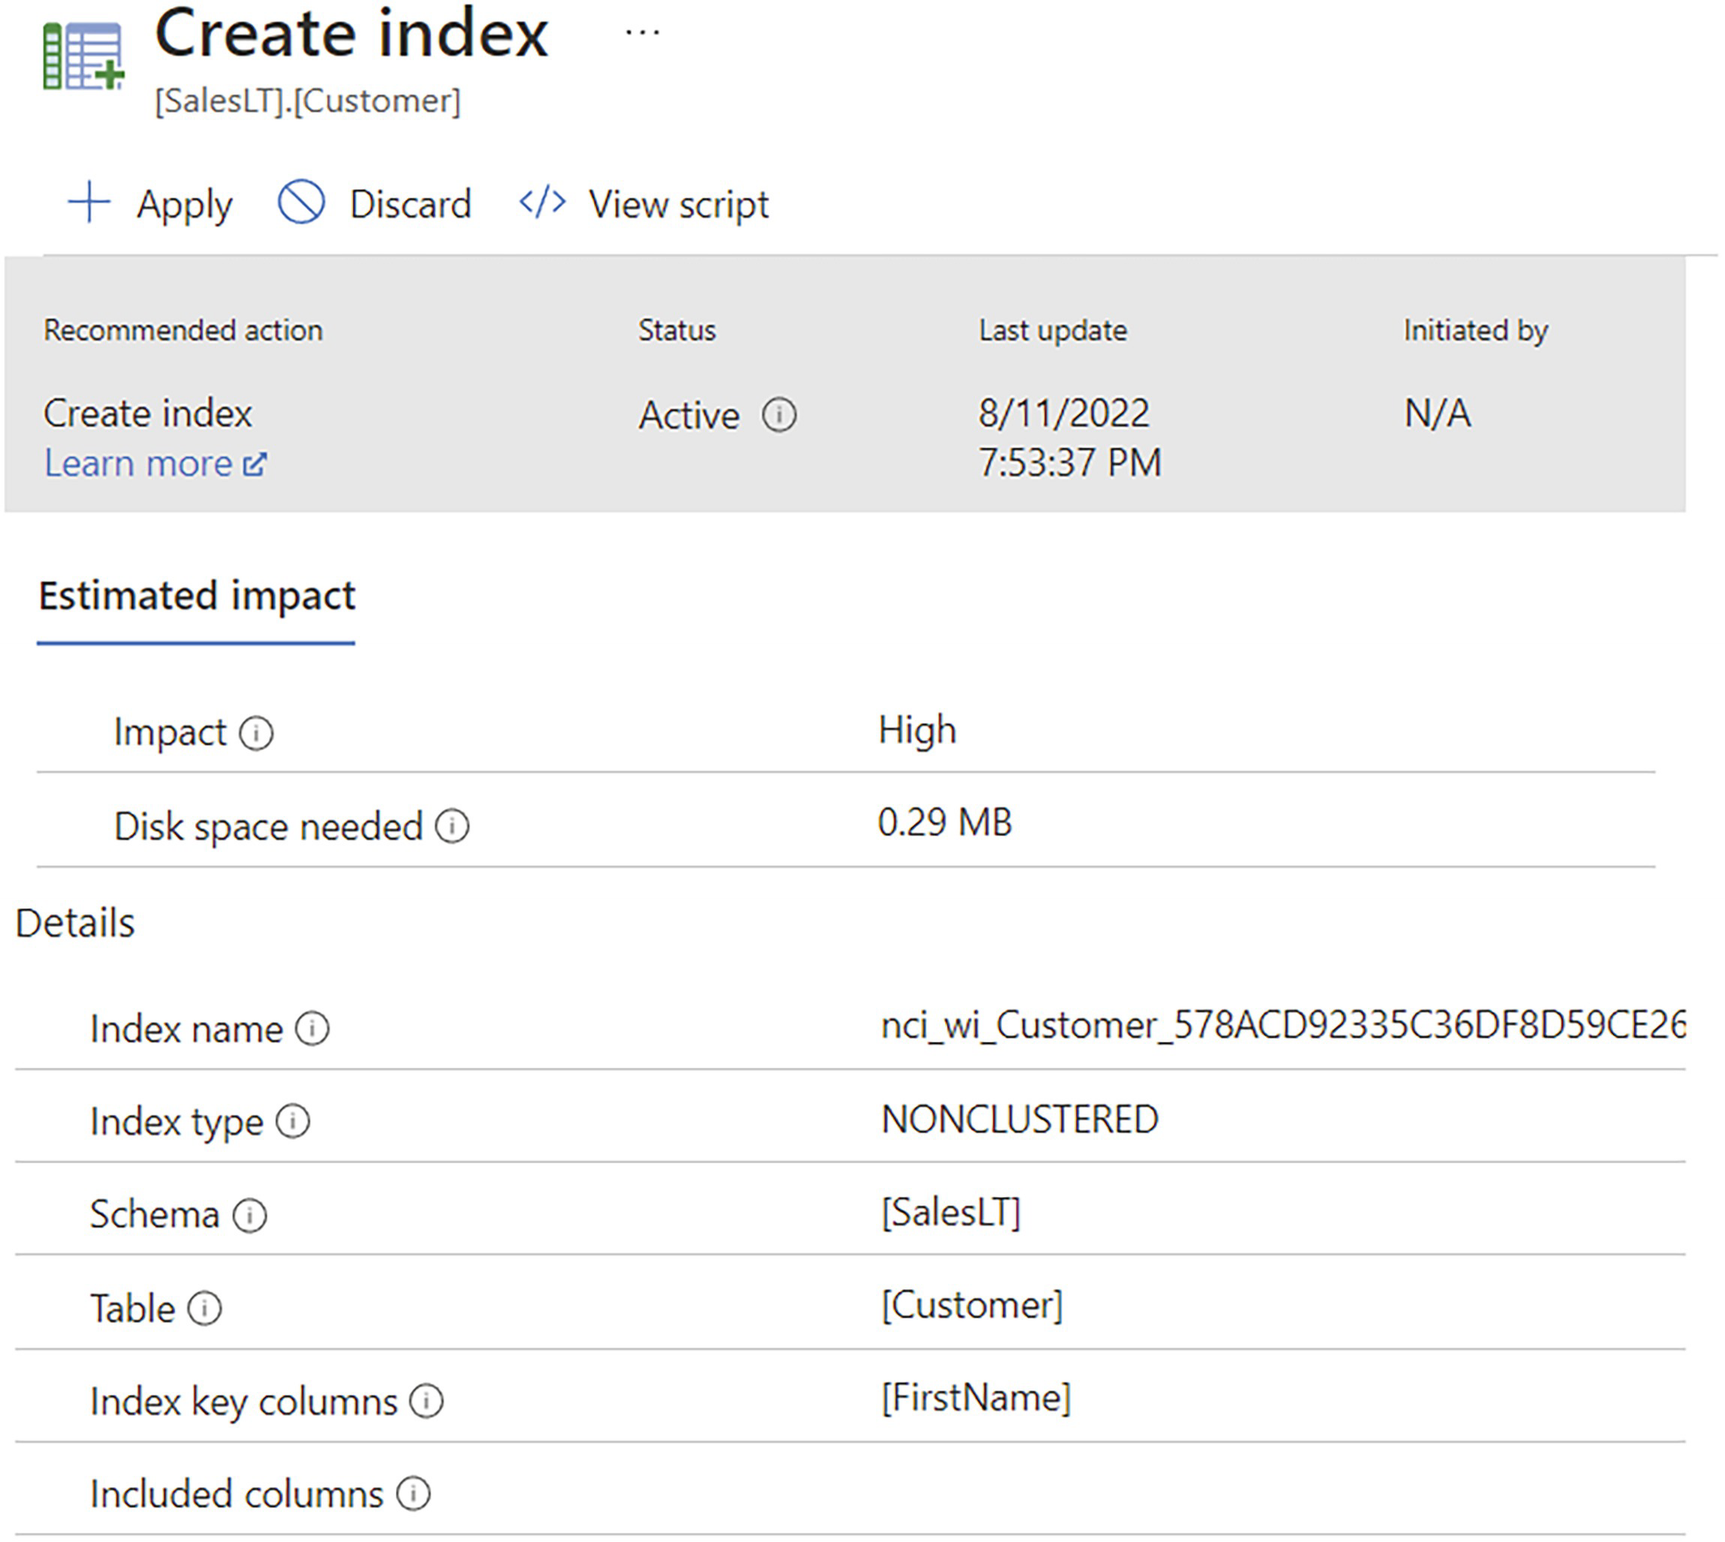
A webpage for Create index. Under the estimated impact options are impact and disk space needed, and below are the details of index name, index type, schema, table, index key columns, and included columns.
Automated tuning recommendation
In this case, the index has not yet been created, but it soon will be. After the index is created, it goes into a process that validates that it worked. Because Microsoft can capture metrics over time, it can use that information to determine if the index worked. In this case, it will work extremely well, radically improving performance.
You can immediately apply the recommendation by clicking on the “Apply” button shown in the figure. If the index was already automatically created, you would have a “Revert” button that would drop the index. You can also review the script ahead of applying it, or if it were applied, see what script had been run.
The accuracy of the process is quite high. Since it can only create nonclustered indexes, not clustered ones, this process can’t solve all indexing issues in queries. Also, it can’t create columnstore indexes when the query pattern is better suited to that style of index.
The process can also drop indexes that you already have in place. However, it won’t drop a clustered index, ever. Also, it won’t drop unique indexes. There are many reasons for this, but one of the principal ones is that it can be quite hard to determine exactly which queries benefit from a unique index. Since the optimizer can simply use the fact that there exists a unique index as part of determining estimated row counts, it doesn’t even have to actually use the index in the plan to get a performance benefit. In short, the process errs on the side of being conservative and cautious.
Summary
As more and more people are managing larger data estates, the ability to be on top of every possible query shrinks. This is why having the ability to automatically get the last good plan can help performance. This type of problem increases on the cloud as people manage large numbers of databases. Getting the simpler aspects of query tuning automated, such as index creation, means that you can spend time on the more complex aspects. Still, as with so many other things, it’s always best to test these mechanisms thoroughly in order to understand their benefits and costs in your own system.
The next and final chapter of the book will be an exhaustive checklist of tuning recommendations: a Query Tuning Methodology.