The Query Store adds a large amount of functionality to SQL Server and Azure SQL Database that helps you in tuning queries. First, the Query Store captures performance metrics on any database that has it enabled, allowing you to look at a historical set of measures. Next, it captures execution plans so that you can see how plans and behaviors change over time. Then, it gives you the ability to control execution plans through a mechanism called plan forcing and another through query hints. All these taken together make the Query Store a very powerful tool for tuning queries.
How the Query Store works and the information it collects
Reports and mechanisms for the Query Store in Management Studio
Plan forcing, a way to force SQL Server to use a particular plan
Query Hints through the Query Store, allowing you to put in hints without editing code
An upgrade method that helps you protect your systems performance
Query Store Function and Design
The Query Store has various functionality, but the chief thing it does is to collect aggregate information on the queries running within a given database. In addition to this information collection, it also gathers the execution plans for those queries. Query Store is enabled by default in Azure SQL Database. In SQL Server, you can choose to enable it on a database-by-database basis.
Enabling Query Store on AdventureWorks
You can also use the Database Properties within SQL Server Management Studio to control Query Store. I’ll cover that in detail later in the chapter.

A diagram displays the query optimization process and query execution points to plan store and runtime statistics, respectively, via async arrows.
Behavior of the Query Store when collecting data
Query optimization is not affected directly by the Query Store. When a query is submitted to the system, an execution plan gets generated as outlined in Chapter 2. Normally, the plan then gets stored in the plan cache (which we’ll cover in detail in Chapter 7), but plan forcing can change that behavior. I’ll detail how plan forcing changes the standard behavior later in the chapter. Assuming there is no forced plan, after the plan gets stored in the plan cache, an asynchronous process copies the plan to a separate memory area for temporary storage. Then, another asynchronous process writes the plan to the Query Store within the database system tables. These asynchronous processes are meant to reduce the overhead from the Query Store as much as possible.
Query execution then proceeds as normal. When the query completes executing, the runtime metrics such as duration, reads, wait statistics, and more are written to a separate memory space through an asynchronous process. That data is aggregated as it’s stored. Then another asynchronous process ensures that the information gets written to the system tables on your database. The default aggregation interval is 60 minutes, and you can adjust that up or down as appropriate for your system.
The information captured by the Query Store is written into the databases on which it is enabled. The query metrics and the execution plans are kept with the database. They get backed up with the database and will get restored with the database. These are system tables and will be stored on the main drive with all other system tables. If your system was to go offline for some reason, or when failing over, it is possible to lose the Query Store information that is in memory and not yet written to disk. The default interval for writing the information to disk is 15 minutes, and you can control that as well. Since this is aggregate information, the possibility of data loss in this case is not concerning.
When you query the information from Query Store, you get both the in-memory data and the data that has been written to disk. This is automatic, and you don’t have to do anything to make it happen.
Information Collected by Query Store
The core piece of data that drives the Query Store is the individual query itself. Any given query may be part of a stored procedure or a collective batch of queries. That doesn’t matter when it comes to the Query Store. It collects information based on the individual query statement. You can easily match it back to a stored procedure, the object_id is captured, but you can’t connect it back to any batch processes.
sys.query_store_query: The main table for information about the queries within Query Store
sys.query_store_query_text: The T-SQL code for a given query
sys.query_store_plan: All the plans for a given query
sys.query_store_runtime_stats: The aggregated runtime metrics gathered by the Query Store
sys.query_store_wait_stats: Aggregated wait statistics for each query
sys.query_store_runtime_stats_interval: The start and stop time for each of the intervals within the Query Store
sys.database_query_store_options: This is a store showing the various settings within Query Store on a given database
Querying the Query Store for a stored procedure query

A table has 5 columns and 3 rows. The column headers are query i d, the object i d, query s g l text, plan i d, and query plan, the first row entry 1, is highlighted.
One query and multiple plans for a query within a stored procedure
Here, you can see that I have a stored procedure with one statement, identified as query_id = 1. However, for that one query, there are three different execution plans in the plan_id: 1, 10, and 11.
Procedure definition for ProductTransactionHistoryByReference
Batch process running a simple query
Putting sys.fn_stmt_sql_handle_from_sql_stmt to work
The formatting and white space all have to be the same in order for the function to succeed. The hard-coded value can be different, because it’s going to get replaced anyway, but the other parts of the T-SQL have to be identical. The bad news is sys.fn_stmt_sql_handle_from_sql_stmt only works with automatic parameterization. It won’t help you with prepared statements or stored procedures. To retrieve that information, you will be forced to use the LIKE command when searching for text. This is why I usually just use the object_id or query_hash values to track things down when I can.
Query Runtime Data
Query and the execution plan are great pieces of information to have. However, you also want to see runtime metrics. The runtime metrics are a little different than you would initially expect. First of all, the runtime metrics are matched to a given execution plan, not the query. Since each plan could, and probably will, behave differently, the runtime metrics are captured for the plan. Second, the runtime metrics are aggregated by the runtime interval. The default value for the interval is 60 minutes. This means that for each interval, you’ll have a different set of runtime metrics if your query was run during that interval.
You can easily combine the runtime metrics with the information on the query itself. Because the information is aggregated into discrete intervals, it may be necessary to aggregate the aggregates, meaning sum up or average the accumulated values. While this may seem like a pain, the purpose for the aggregation intervals is extremely helpful. You have the aggregates broken up so that you have more than one point of reference. You can track how a query’s behavior changes over time. Having comparison points is how you can tell if performance is degrading or improving. You get some of the granularity and detail of using Extended Events with the ease of simply querying the cache.
Retrieving runtime information from the Query Store

A table with 7 columns and 1 row displays the runtime metrics and wait for statistics for a 1-time interval plan.
Runtime metrics and wait statistics for a plan within one time interval
In addition to associating the performance with a given plan, the execution context is also taken into account. A query from a batch and the same query in a stored procedure may have different behaviors.
Taking an average of all Query Store runtime metrics for a query
I use a LEFT JOIN here because you won’t always have wait statistics since the Query Store only captures waits longer than 1ms. This will retrieve all performance for the plan_id specified, regardless of the interval.
Controlling Query Store
Removing all information from Query Store
Removing a query or a plan from Query Store
The queries earlier in the chapter showed how to get both the plan_id and query_id values by searching for queries or objects using the information stored within Query Store.
Flushing Query Store from memory to disk
Retrieving all current Query Store settings
Changing the maximum storage size for the Query Store
If you make changes to the settings within Query Store, they take effect immediately. There are no reboots or resets of any kind required. The default values are adequate for many systems. However, there is one set of values you may want to adjust on your systems, and that’s the Query Store Capture Mode.
Capture Mode
Prior to SQL Server 2019, you had only three options for how the Query Store captured queries. The default is All, meaning it will capture all queries. You also have the option of setting the capture mode to None. This means that the Query Store remains enabled, so you can do things like plan forcing (explained later in this chapter), but you stop capturing new data within Query Store. Finally, you had Auto as an option. The old behavior here meant that Query Store would only capture queries that had been executed three times or had run longer than one second. This helped reduce some of the overhead of Query Store and helped it work well with “Optimize for Ad Hoc”, a setting that helps with plan cache memory management (we’ll discuss this in Chapter 7).
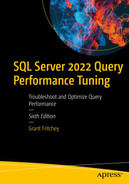
A webpage displays the general, monitoring, query store retention, query store capture policy, and query store capture mode sections. Under the query store retention, the query store capture mode is set to custom.
Changing the Capture Mode to Custom
Execution Count: The number of times a query must run before you capture it within Query Store
Stale Threshold: The time period in which the query must meet the other criteria you’re setting
Total Compile CPU Time (ms): The total amount of CPU used during the time period before it gets captured
Total Execution CPU Time (ms): As with compile CPU time, but measuring the execution CPU time
Obviously, some information is captured on these queries in order for the Query Store to know when it must capture all the information it would normally capture. However, using these filters allows you to take very direct control over how much information is captured by the Query Store.
Just remember, all these settings for Query Store are on a database level only. If you decide to set a particular value and you want it to be a standard across the system, you’ll have to set it on each database on which you’re running Query Store.
Query Store Reporting
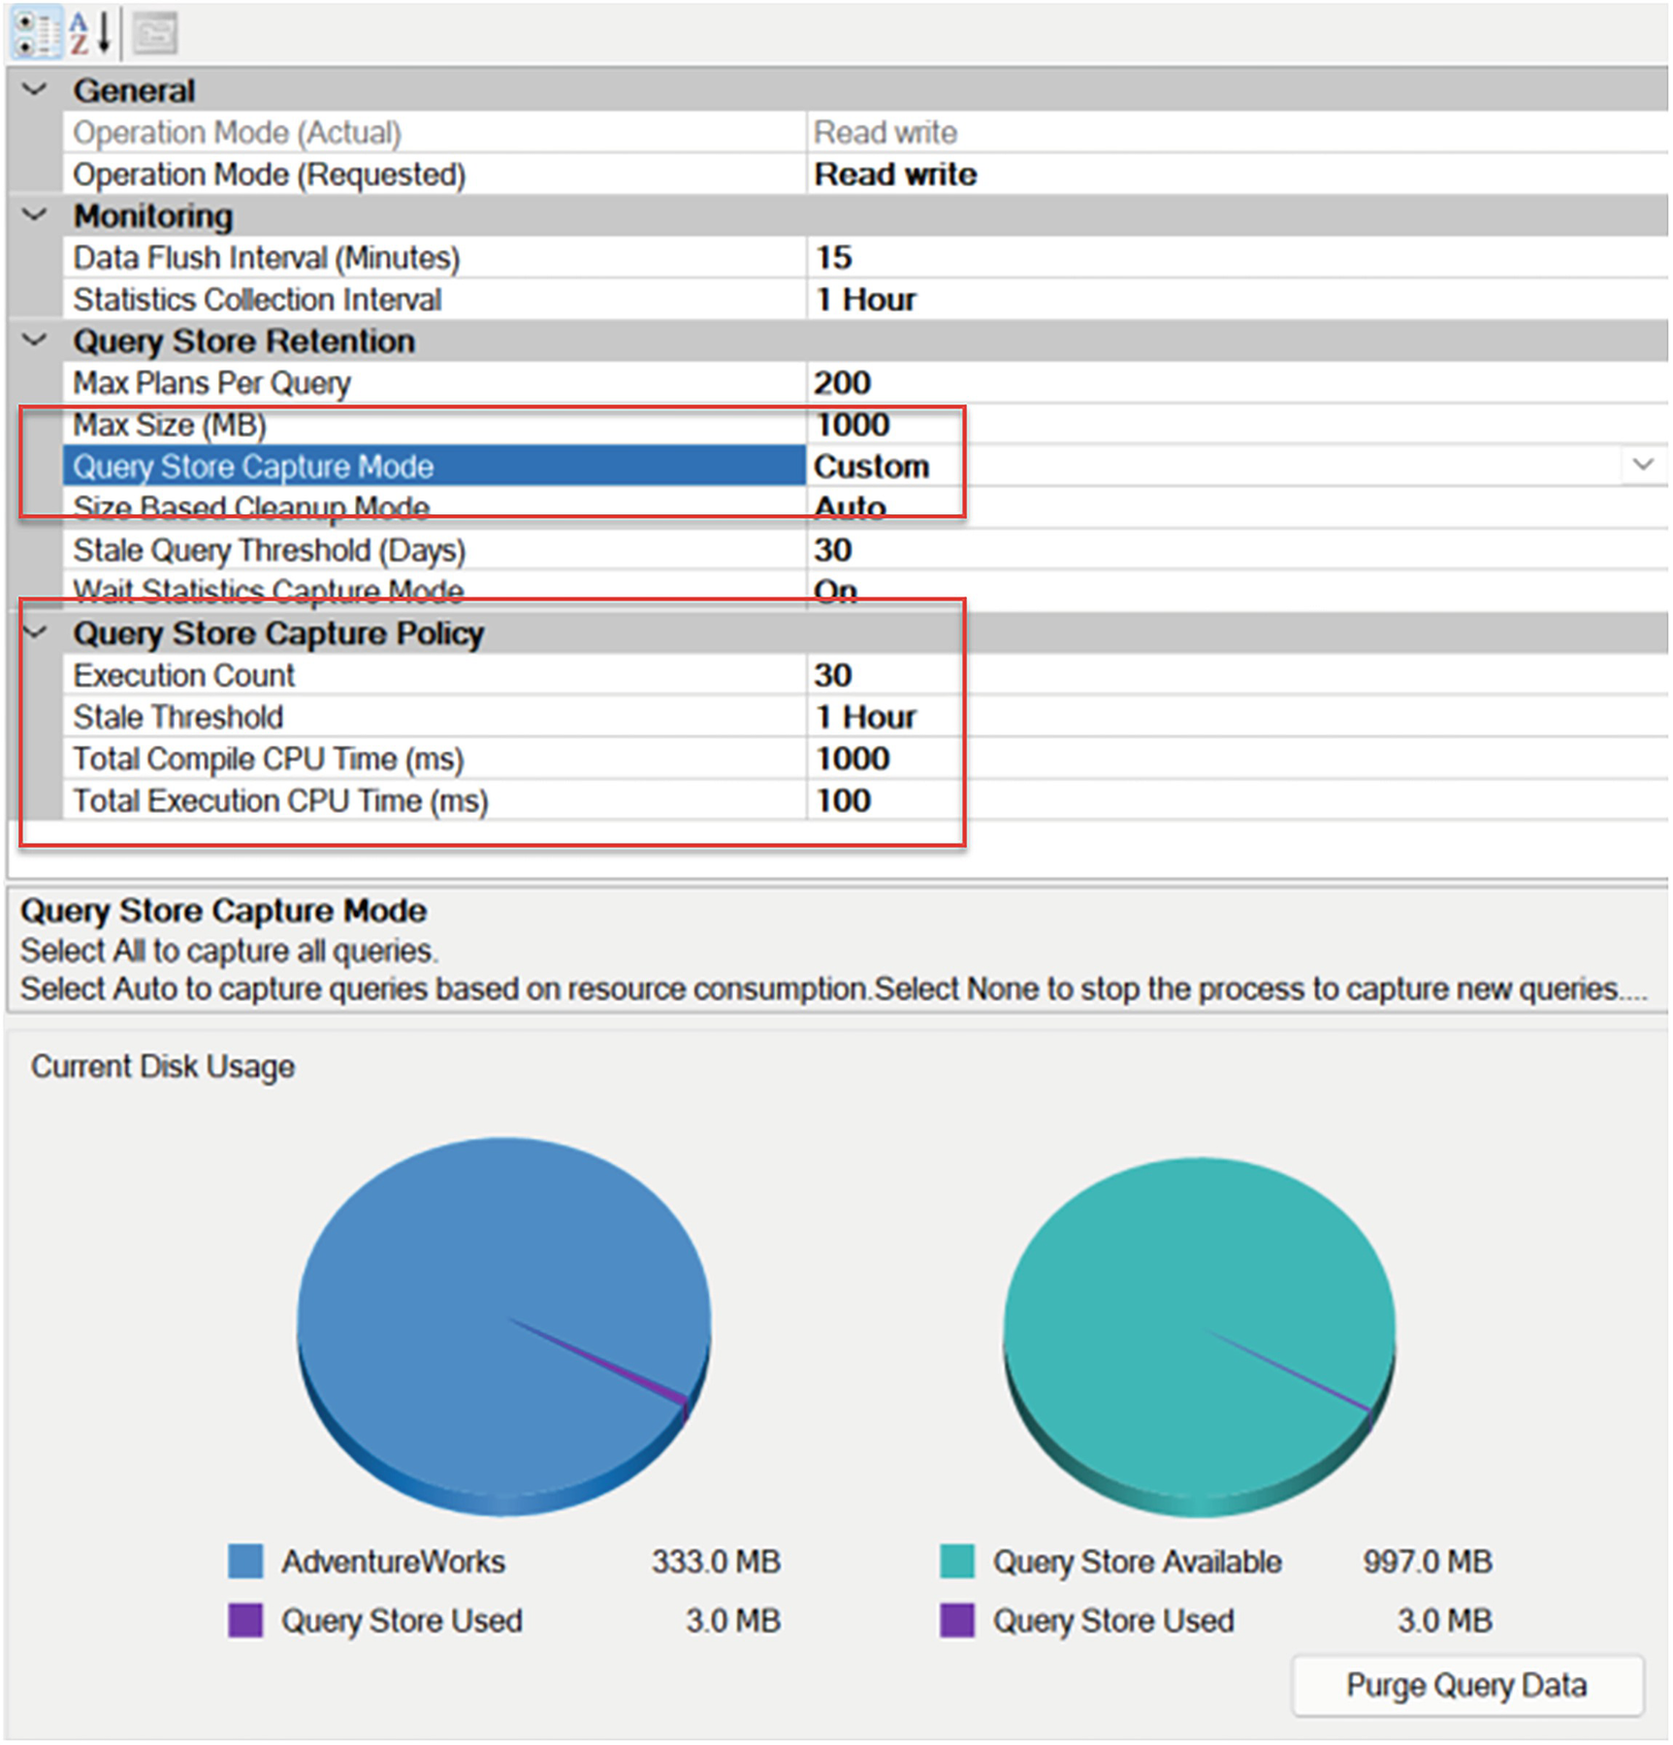
A window displays the Adventure Works database. Under it is the Query store folder with 7 databases.
Query Store reports within a database
Regressed Queries: Queries that have suffered negative impacts from a change in execution plan.
Overall Resource Consumption: This report shows the resource consumption over a given time period, by default, one month.
Top Resource Consuming Queries: The queries that are using the most resources based on the information currently in Query Store.
Queries With Forced Plans: Any queries where you have enabled plan forcing.
Queries With High Variation: A report that displays queries that have a high degree of variation in their runtime metrics, frequently with more than one execution plan.
Tracked Queries: You can mark a query in Query Store and then use this report to track the behavior of all marked queries.
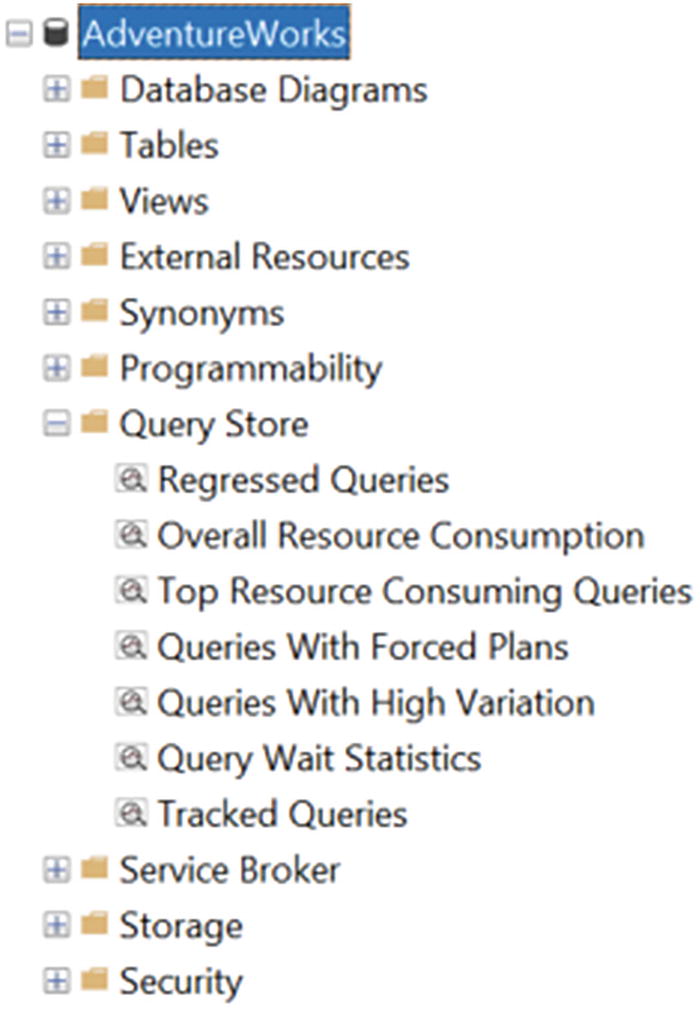
A window displays 2 graphs indicate the top 25 resource consumers report from the query store.
Top 25 Resource Consumers report from the Query Store
The report consists of three different pieces of data. On the top left is a listing of the most costly reports. On the top right are the execution plans for the query that is currently highlighted on the left. At the bottom is the execution plan.
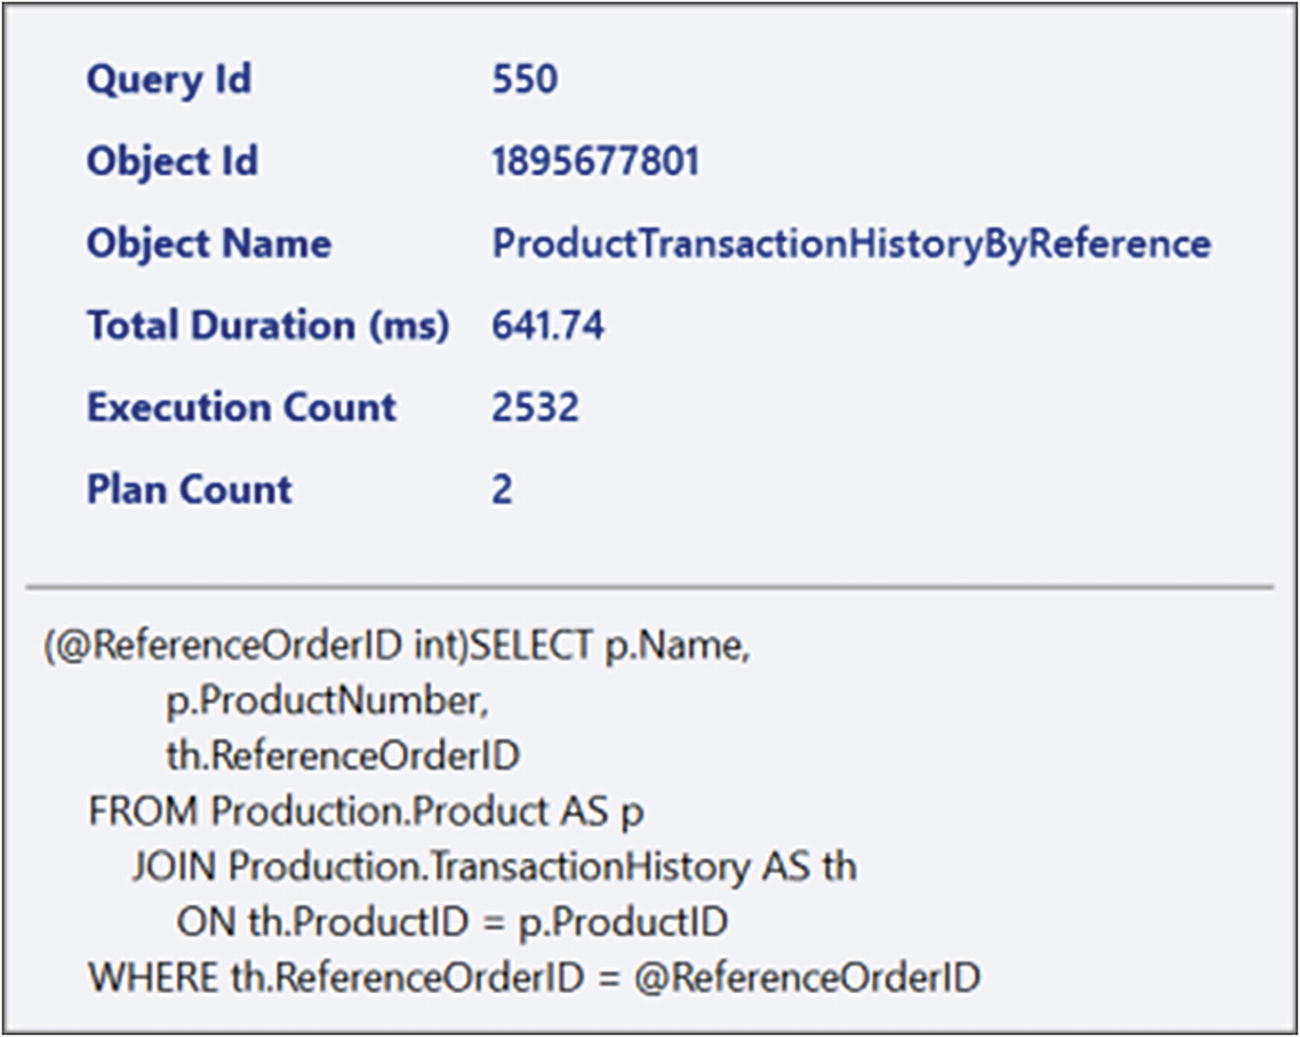
A list displays the properties of the query from the report consists of the following information, query i d, object i d, object name, total duration, execution count, and plan count.
Properties about the query from the report
You can see important pieces of information such as the execution count, the query itself, and the number of plans associated.
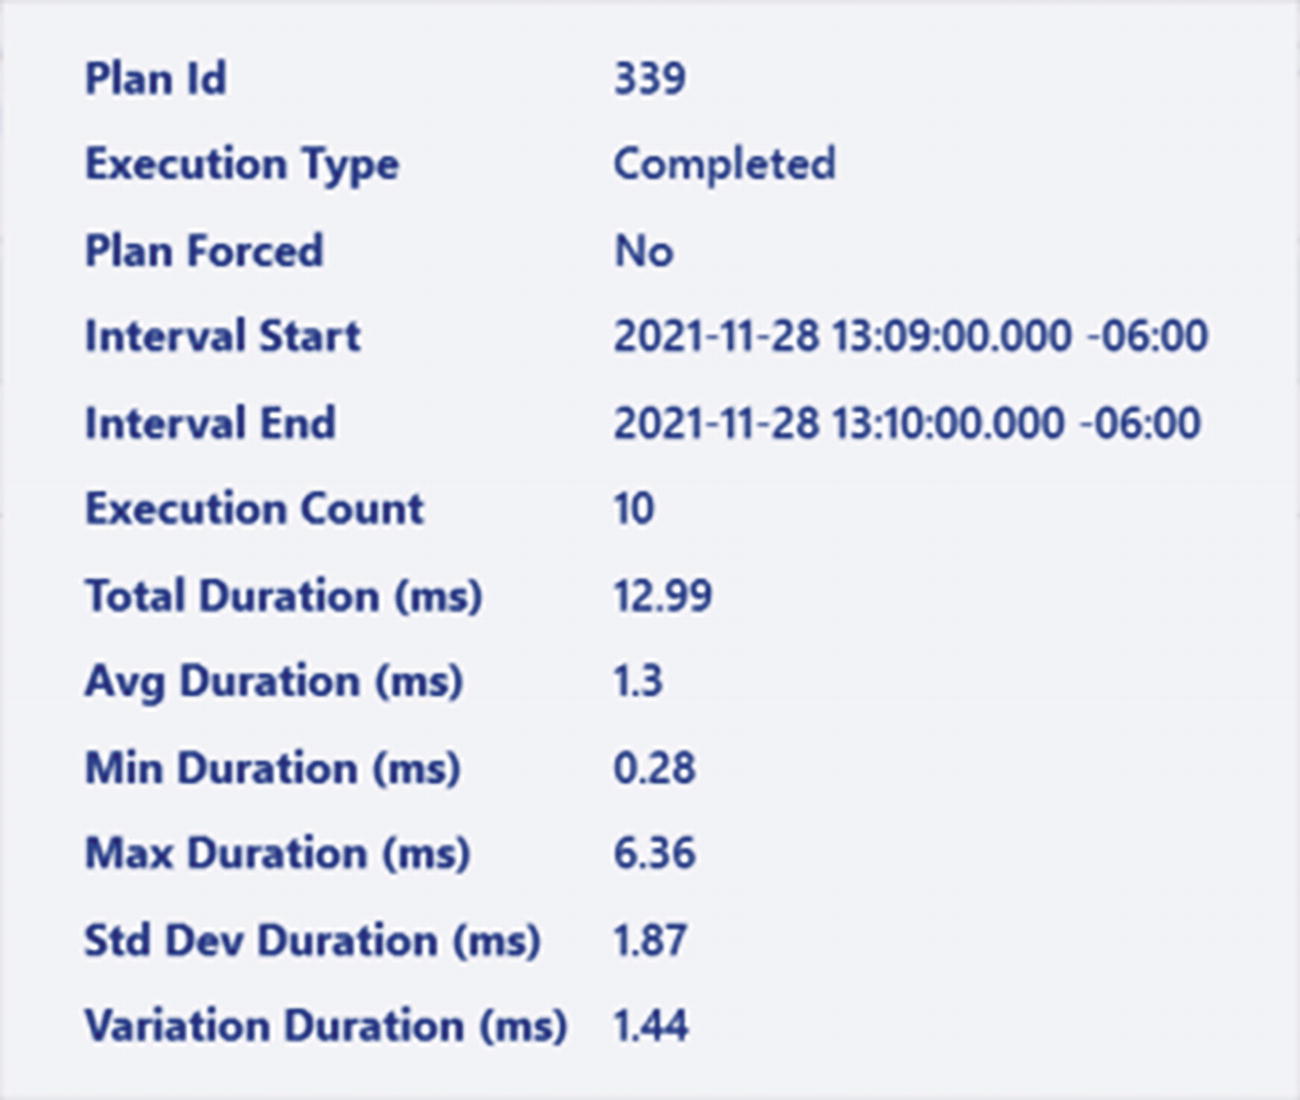
A list displays 12 properties of the given execution plan, the plan i d, execution type, plan forced, interval start, interval end, execution count, total duration, average duration, minimum duration, maximum duration, s t d dev duration, and variation duration.
Properties about a given execution plan
Each of those plans represents different moments in time between plan compiles and recompiles as well as plan changes. You can see the performance metrics for the plan in question including such things as the execution count for the plan, as opposed to the one for the query.

A window for Configure Top Resource Consumption has the following sections, Resource Consumption Criteria, Time Interval, Return, and Filters.
Report configuration window
You can pick any of those metrics to get a whole new report. You can also decide between various aggregations for those metrics. Below that, you can pick the time interval, including full customization. The number of queries can be controlled by setting the Return value. Finally, you can filter the data based on the number of execution plans per query.
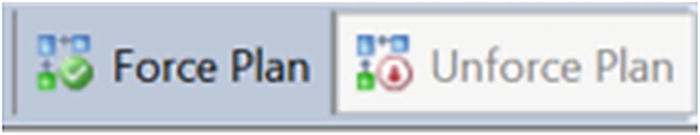
An image displays 2 buttons, named Force Plan and Unforce Plan.
Forcing and unforcing plans from the reports
We’re going to cover plan forcing in detail in the next section.
Plan Forcing
The majority of the functionality in Query Store is very much focused around capturing the plans, runtime metrics, and wait statistics of the queries on the database. There is, however, one additional piece of functionality, plan forcing. Plan forcing is simply the ability to mark an execution plan as the preferred plan. The optimization process occurs as per normal. Then, a check is made to see if there is a forced plan. If there is one, then that plan will be used, if it’s a valid execution plan.
The main point of forcing plans is the ability to ensure consistent behavior from your queries. A recompile of a query could lead to changes in behavior that negatively impact the system. Forcing a plan makes that behavior go away by ensuring one plan is used instead of any other.
Most queries support plan forcing. If there are any that don’t, you will get an error. Only two types of cursors support plan forcing: fast forward and static.
Forcing an execution plan
After running this command, any time the query in question gets compiled or recompiled, the plan represented by the ID value, 339, will be used. There is a rare exception where the optimizer can use a different plan after recompiling. The plan will be approximately the same. The actual term used by Microsoft for this event is “a morally equivalent plan.” Again, this is a rare event, but it does happen.
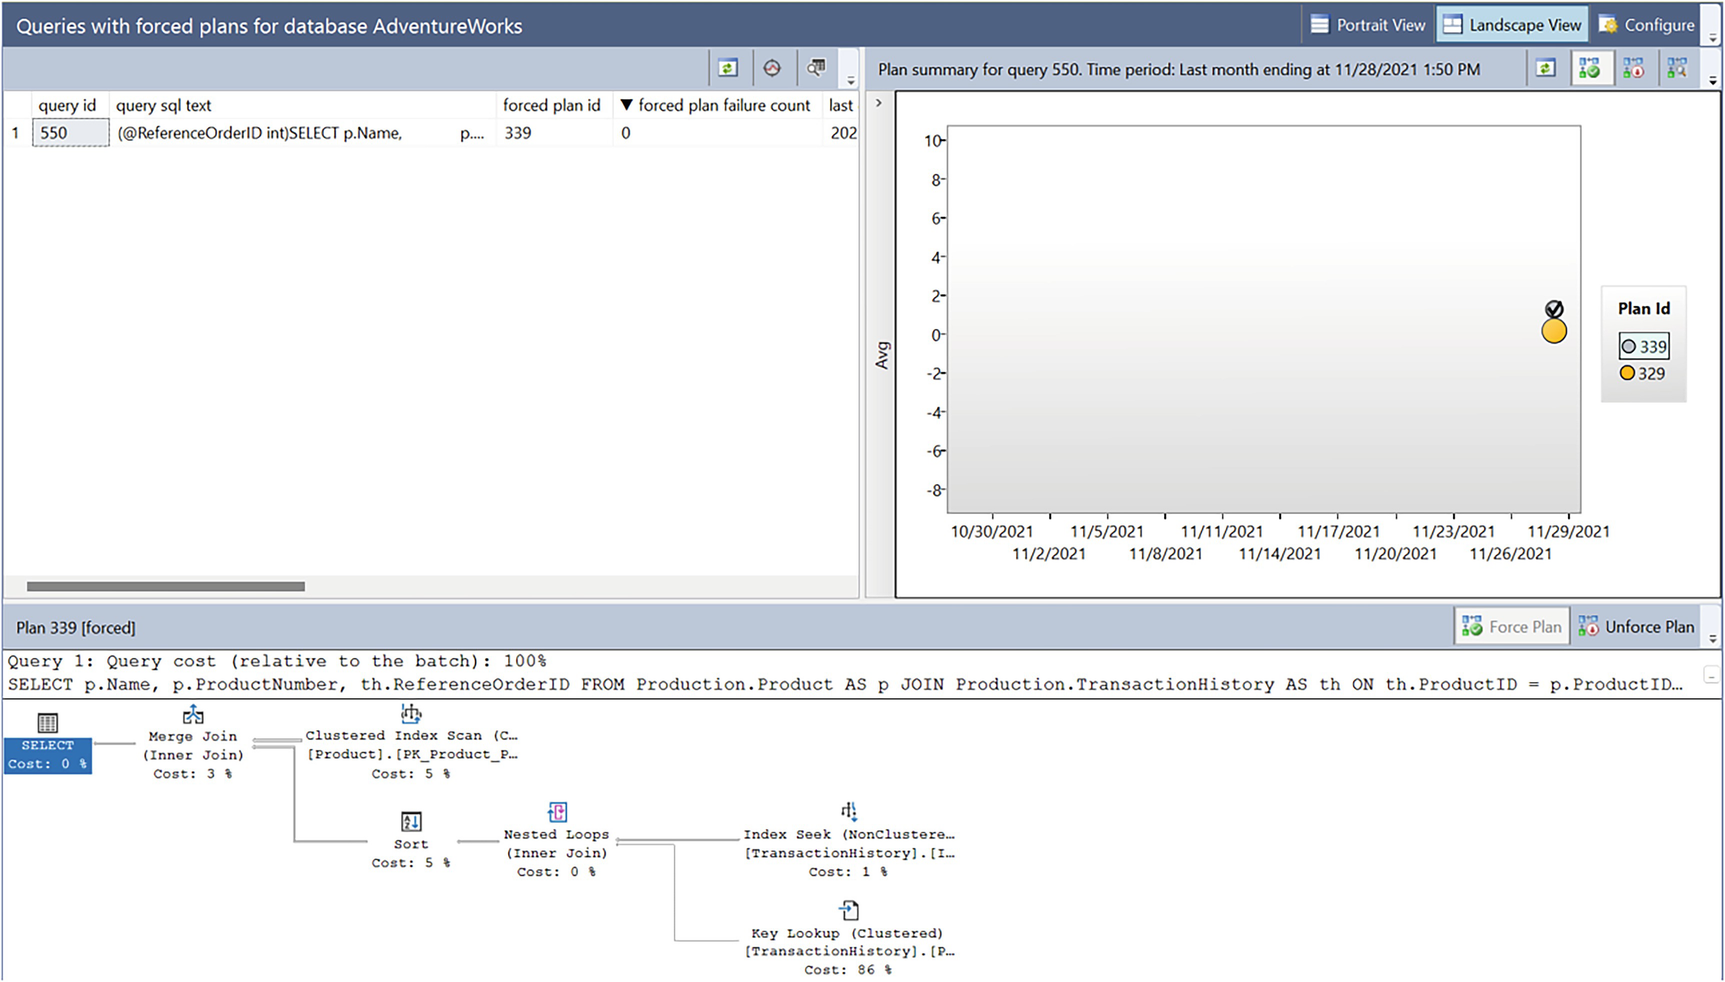
A window displays reports for queries with forced plans. On the right is a graph and below is the diagram for the execution plan.
Queries With Forced Plans
As you can see, the report looks similar to the Top 25 Resource Consumers shown in Figure 6-6. The behaviors are all largely the same as well. The key difference is that the upper left simply shows a list of all queries with forced plans. Another difference is visible in the list of plans where we can see that one plan has a check mark on it. This is showing the plan that is currently being forced.
I can unforce the plan by ensuring it’s selected and then hitting the appropriate button from Figure 6-10.
Forcing Query Hints
Query hints are a badly named piece of functionality. Instead of suggestions, or hints, they are quite literally commandments. There are a large number of query hints, and several will be shown throughout the book.
Query hints take away choices from the optimizer. Their use must be done extremely judiciously after thorough testing and as a last resort.
Forcing a query hint
The query hint I’ve used is one that is common when dealing with bad parameter sniffing issues (discussed at great length in Chapter 13). The beauty of using the sp_query_store_set_hints code is that you can apply a query hint without having to change your code in any way. There is another method called Plan Guides, that’s similar, but it simply doesn’t work as well as what we get with Query Store.
Querying to see which queries have hints
Clearing hints from Query Store
Just like with plan forcing, forcing a hint is persisted in the event of a reboot or failover. Hints that are not valid will be ignored.
Optimized Plan Forcing
Intelligent Query Processing (covered in detail in Chapter 21) is a number of internal enhancements for query performance addressing common issues. One of those common issues is the query optimization process. Sometimes, generating the execution plan can be a very resource-intensive operation. As such, starting with SQL Server compatibility level 160 (which means SQL Server 2022 and Azure SQL Database), Microsoft has changed the way some plan generation occurs.
When a plan is generated and it crosses internal thresholds within the optimizer, a portion of the optimization will be stored in a hidden attribute within the XML in Query Store. What’s stored there is a replay script for the optimization process, making for faster optimization.
The trade-off is additional storage vs. savings in processing. The optimizer estimates how long optimization will take. If it’s wrong on that estimate, and the resources, counted by objects, number of joins, optimization tasks, and optimization time, exceed internal thresholds, the script is persisted.
Disabling optimized plan forcing
You can also use a query hint to disable optimized plan forcing for a single query, DISABLE_OPTIMIZED_PLAN_FORCING.
Not all queries are eligible for optimized plan forcing. If the optimization process is anything other than FULL, the query can’t get this benefit. Distributed queries are ineligible. Queries with the RECOMPILE hint are also not allowed.
Using the has_compile_replay_script column
Finally, you can disable optimized plan forcing by forcing a plan using the disable_optimized_plan_forcing parameter. You can query for these using the is_optimized_plan_forcing_disabled column.
Query Store for Upgrades
While general query performance monitoring and tuning may be the day-to-day common use for the Query Store, one of the most powerful purposes behind the tool is its use as a safety net for upgrading SQL Server.
Let’s assume that you are planning to migrate from SQL Server 2012 to SQL Server 2022. Traditionally, you would upgrade your database on a test instance somewhere and then run a battery of tests to ensure that things are going to work well. If you catch and document all the issues, great. Unfortunately, it might require some code rewrites because of some of the changes to the optimizer or the cardinality estimation engine. That could cause delays to the upgrade, or the business might even decide to try to avoid it altogether (a frequent, if poor, choice). That assumes you catch the issues. It’s entirely possible to miss that a particular query has suddenly started behaving poorly because of a change in estimated row counts or something else.
- 1.
Restore your database to the new SQL Server instance or upgrade your instance. This assumes the production machine, but you can do this with a test machine as well.
- 2.
Leave the database in the older compatibility mode. Do not change it to the new mode because you will enable both the new optimizer and the new cardinality estimation engine before we’ve captured data.
- 3.
Enable Query Store. It can run in compatibility mode.
- 4.
Run your tests or run your system for a period of time that ensures that you have covered the majority of queries within the system. This time will vary depending on your needs.
- 5.
Change the compatibility mode.
- 6.
Run the report “Query With High Variation” or “Regressed Queries”. One of these reports will find queries that have suddenly started running slower than they had previously.
- 7.
Investigate those queries. If it’s obvious that the query plan has changed and that is the cause of the change in performance, then pick a plan from prior to the change and use plan forcing to make that plan the one used by SQL Server.
- 8.
Where necessary, take the time to rewrite the queries and or restructure the system to ensure that the query can, on its own, compile a plan that performs well with the system.
This approach won’t prevent all problems. You still must test your system. However, using Query Store will provide you with mechanisms for dealing with internal changes within SQL Server that affect your query plans and subsequently your performance. You can also use similar processes to apply a Cumulative Update or Service Pack.
Summary
With Query Store, you have one more tool in your toolbox to assist in identifying poorly performing queries. When you need detailed analysis, you’ll still rely on Extended Events. However, when you want fast access to data with the ability to do comparisons between points in time, Query Store has you covered. With the ability to capture multiple execution plans per query so you can see how that changes performance over time, you’ve got even more than you had before. Finally, you can force plans and force hints to get the behavior you want out of your queries.
In the last several chapters, we’ve discussed how execution plans get created, how to read them, and even how to force them through the Query Store. In the next chapter, we discuss how the query plan cache behaves in SQL Server and how it can impact the performance of your systems.