
What You'll Learn in This Hour:
What a state diagram is and how to work with it
How to work with events, actions, and guard conditions
How to model substates, history states, and connection points
At the end of the last hour, I said this hour would cover a category you haven't worked with before. This new category, the behavioral element, shows how parts of a UML model change over time. You'll learn about a particular member of this category, the state diagram.
Each year brings new styles in clothes and cars, seasons change the color of leaves on trees, and passing years see children grow and mature. Without becoming any more like a greeting card, the point is that as time passes and events occur, changes take place in the objects around us.
This also holds true in any system. As the system interacts with users and (possibly) with other systems, the objects that make up the system go through necessary changes to accommodate the interactions. If you're going to model systems, you must have a mechanism to model change.
One way to characterize change in a system is to say that its objects change their state in response to events and to time. Here are some quick examples:
When you throw a switch, a light changes its state from Off to On.
When you click a remote control, a television changes its state from showing you one channel to showing you another.
After an appropriate amount of time, a washing machine changes its state from Washing to Rinsing.
The UML state diagram captures these kinds of changes. It presents the states an object can be in along with the transitions between the states and shows the starting point and endpoint of a sequence of state changes.
State Diagrams Versus Blueprints
With the state diagram, the analogy between UML and a blueprint begins to break down. A blueprint shows you what a house will look like when it's finished. It doesn't show where holes will appear in the roof, where cracks will emerge in the walls, and how corrosion will become part of the plumbing. The intent of the state diagram, also referred to as a state machine or a statechart, is to show those kinds of changes.
Bear in mind that a state diagram is intrinsically different from a class diagram, an object diagram, or a use case diagram in a very important way. The diagrams you've already studied model a group of classes, objects, or use cases. A state diagram shows the states of a single object.
Some Conventions
It's customary to capitalize the initial letter of a state's name. It's also a good idea to give a state a name that ends in ing whenever possible (for example, Dialing or Faxing). Sometimes it's not possible (Idle is an example, as you'll see in a moment).
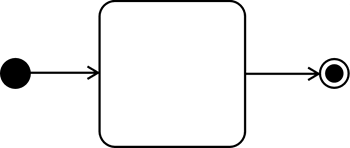
Figure 8.1 shows the rounded rectangle that represents a state, along with the solid line and arrowhead that represent a transition. The arrowhead points to the state being transitioned into. The figure also shows the solid circle that symbolizes a starting point and the bull's-eye that symbolizes an endpoint.
The UML gives you the option of adding detail to these symbols. You can divide the state icon into two areas. The top area holds the name of the state (which you have to supply whether you subdivide the icon or not) and the bottom area holds activities that take place in that state. Figure 8.2 shows these details.
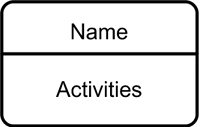
Three frequently used categories of activities are entry (what happens when the system enters the state), exit (what happens when the system leaves the state), and do (what happens while the system is in the state). You can add others as necessary.
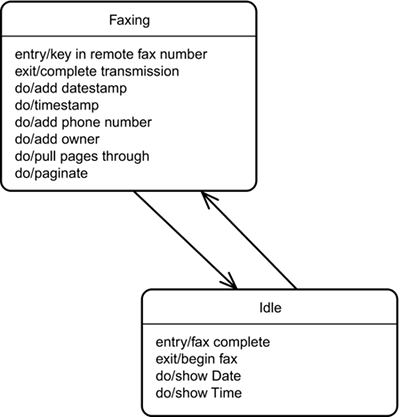
A fax machine is an object whose states have activities. When it's sending a fax—that is, when it's in the Faxing state—the fax machine engages in the activities of adding a date stamp and timestamp to the fax and adding its phone number and the name of its owner. In other activities in this state, the machine pulls the pages through, paginates the fax, and completes the transmission.
While it's in the Idle state, the fax machine presents the date and time on a display. Figure 8.3 shows a state diagram.
You can also add some details to the transition lines. You can indicate an event that causes a transition to occur (a trigger event) and the computation (the action) that executes and makes the state change happen. To add events and actions you write them near the transition line, using a slash to separate a triggering event from an action. Sometimes an event causes a transition without an associated action, and sometimes a transition occurs because a state completes an activity (rather than because of an event). This type of transition is called a triggerless transition.
The graphical user interface (GUI) you interact with gives examples of transition details. For the moment, assume the GUI can be in one of three states:
Initializing
Working
Shutting Down
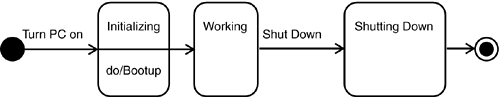
When you turn your PC on, bootup takes place. Turning the PC on, then, is a triggering event that causes the GUI to transition to the Initializing state, and booting up is an activity that takes place during the transition.
As a result of activities in the Initializing state, the GUI transitions into the Working state. When you choose to shut down the PC, you generate a trigger event that causes the transition to the Shutting Down state, and eventually the PC turns off. Figure 8.4 shows the state diagram that captures these states and transitions in the GUI.
The preceding account of GUIs leaves a lot to be desired. First of all, if you leave your computer unattended or if you just sit idly by and don't type or use the mouse, a screensaver appears and rescues your pixels from potential burnout. To say this in state-change terms, if enough time passes without any user input, the GUI transitions from the Working state into a state I didn't show in Figure 8.4—the Screensaving state.
The time interval is specified in your Windows Control Panel. It's usually 15 minutes. Any keystroke or mouse movement transitions the monitor from the Screensaving state back to the Working state.
That 15-minute interval is a guard condition—when it's met, the transition takes place. Figure 8.5 shows the state diagram for the GUI with the Screensaving state and the guard condition added.

This model of the GUI is still somewhat empty. The Working state, in particular, is a lot richer than Figures 8.4 and 8.5 indicate.
When the GUI is in the Working state, a lot is happening behind the scenes, although it might not be particularly evident onscreen. The GUI is constantly waiting for you to do something—type a keystroke, move the mouse, or press a mouse button. It then must register those inputs and change the display to visualize those actions for you onscreen—for example, by moving the cursor when you move the mouse, or by displaying an a when you press the a key.
Thus the GUI goes through changes while it's within the Working state. Those changes are changes of state. Because these states reside within a state, they're called substates. Substates come in two varieties: sequential and concurrent.
As the name implies, sequential substates occur one after the other. Recapping the aforementioned substates within the GUI's Working state, you have this sequence:
Awaiting User Input
Registering User Input
Visualizing User Input
User input triggers the transition from Awaiting to Registering. Activities within Registering transition the GUI into Visualizing. After the third state, the GUI goes back to the Awaiting User Input state. Figure 8.6 shows how to represent these sequential substates within the Working state.

Within the Working state, the GUI isn't just waiting for you. It's also watching the system clock and (possibly) updating an application's display after a specific interval. For example, an application might include an onscreen clock that the GUI has to update.
All this is going on at the same time as the sequence I just discussed. Although each sequence is, of course, a set of sequential substates, the two sequences are concurrent with one another. You represent concurrency with a dotted line between the concurrent states, as in Figure 8.7.
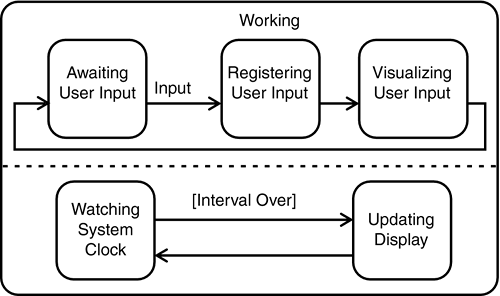
Figure 8.7. Concurrent substates proceed at the same time. A dotted line separates concurrent substates.
Separating the Working state into two components might remind you of something. Remember when I discussed aggregations and composites? When each component is part of just one whole, you are dealing with a composite. The concurrent parts of the Working state have that same kind of relationship to the Working state. For this reason, the Working state is a composite state. A state that consists of nothing but sequential substates is also a composite state.
When your screensaver is on and you move your mouse to get back to the Working state, what happens? Does your display go back to looking as it did right after the GUI was initialized? Or does it look exactly the way you left it before the screensaver came on?
Obviously, if the screensaver caused the display to revert back to the beginning of the Working state, the whole screensaver idea would be counterproductive. Users would lose work and have to restart a session from square one.
The state diagram captures this idea. The UML supplies a symbol that shows that a composite state remembers its active substate when the object transitions out of the composite state. The symbol is the letter H enclosed in a small circle connected by a solid line to the remembered substate, with an arrowhead pointing to that substate. Figure 8.8 shows this symbol in the Working state.
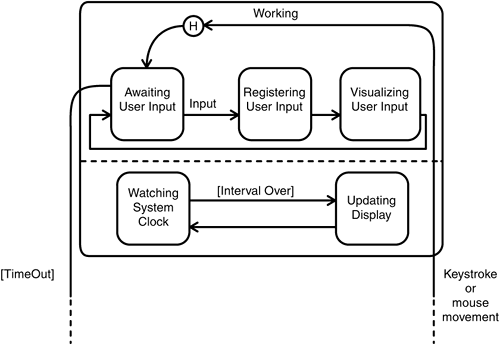
Figure 8.8. The history state, symbolized by the H in the small circle, shows that a composite state remembers its active substate when the object transitions out of that composite state.
In the state diagram, I haven't dealt with windows that are opened by other windows—in other words, with substates nested within other substates. When a history state remembers substates at all levels of nesting (as the Windows Working state does), the history state is said to be deep. If it remembers only the highest nested substate, the history state is shallow. You represent a deep history by putting H* in the circle.
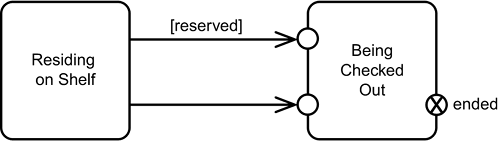
UML 2.0 has added some new state-relevant symbols called connection points. They represent points of entry into a state or exits out of a state.
Here's an example: Imagine a couple of the states of a book in a library. At first, it's residing on a shelf. If a borrower has called in to reserve the book, a librarian retrieves the book and brings it into the state of “Being checked out.” If a borrower comes to the library, browses through the shelves, selects the book, and then decides to borrow it, it enters the Being-checked-out state, but in a different way. You can think of each way of getting to the Being-checked-out state as going through a separate entry point.
One more thing to be aware of: Suppose the borrower has borrowed more than some allotted limit or has a number of unpaid fines. If that's the case, the book abruptly exits—via an exit point—from the Being-checked-out state.
Figure 8.9 shows how to model all this in UML. Each entry point is modeled as an empty circle. The exit point is an encircled X. The circles are on the border of the state icon.
The UML state diagram provides a variety of symbols and encompasses a number of ideas, all to model the changes that just one object goes through. This type of diagram has the potential to get very complex very quickly. Is it really necessary?
In fact, it is. It's important to have state diagrams because they help analysts, designers, and developers understand the behavior of the objects in a system. A class diagram and the corresponding object diagram show only the static aspects of a system. They show hierarchies and associations, and they tell you what the behaviors are. They don't show you the dynamic details of the behaviors.
Developers, in particular, have to know how objects are supposed to behave because they have to implement these behaviors in software. It's not enough to implement an object: Developers have to make that object do something. State diagrams ensure that they won't have to guess about what the object is supposed to do. With a clear picture of object behavior, the likelihood increases that the development team will produce a system that meets requirements.
Now you can add behavioral elements to your big picture of the UML. Figure 8.10 presents the picture with the state diagram included.

Objects in a system change their states in response to events and totime. The UML state diagram captures these state changes. A state diagram focuses on the state changes in just one object. A rounded rectangle represents a state, and a line with an arrowhead represents a transition from one state to another.
The state icon shows the name of the state and can hold activities as well. A transition can occur in response to a trigger event and can entail an action. A transition can also occur because of an activity in a state: A transition that takes place in this fashion is termed a triggerless transition. Finally, a transition can occur because a particular condition—a guard condition—holds true.
Sometimes, a state consists of substates. Substates may either be sequential (occurring one after the other) or concurrent (occurring at the same time). A state that consists of substates is called a composite state. A history state indicates that a composite state remembers its substate when the object transitions out of that composite state. A history state may be either shallow or deep. These terms pertain to nested substates. A shallow history remembers only the top-level substate. A deep history remembers all levels of substates.
UML 2.0 provides symbols for modeling connection points—entry points into a state and exit points out of a state.
State diagrams help analysts, designers, and developers understand the behavior of the objects in a system. Developers, in particular, have to know how objects are supposed to behave because they have to implement these behaviors in software. It's not enough to implement an object: Developers have to make that object do something.
The quiz and exercises will transition you into the Learned State Diagrams state. As always, you'll find the quiz answers in Appendix A, “Quiz Answers.”
1: | Suppose you're designing a toaster. Create a state diagram that tracks the states of bread in the toaster. Include necessary triggering events, actions, and guard conditions. |
2: | Figure 8.7 shows the concurrent substates within the GUI's Working state. Draw a diagram of the Screensaving state that includes concurrent substates. |
3: | Figure 8.9 shows two of the states of a library book. Using your general knowledge of libraries, expand the diagram to include the remaining states. Add appropriate substates and guard conditions. |