
11
The Use of Low-Cost Mobile Radar Systems for Small UAS Sense and Avoid
11.1 Introduction
The overarching goal of the unmanned aircraft systems (UAS)1 community is to achieve routine, regular and safe integration of UAS into the national airspace system (NAS). Access to airspace, however, is often restricted to small geographic areas and the time required for gaining approval for this access can often be measured in months. Thus, for time-critical applications such as bushfire monitoring, the current situation is unacceptable.
UAS have demonstrated their ability to fly, navigate and perform useful missions. The challenge is to provide UAS with a capability that replicates a human function: the ability to see and avoid. The inability to meet this challenge is holding back the integration of UAS into the NAS.
In order to realise the benefits of UAS for commercial and civilian applications, it is necessary to achieve a greater degree of operational freedom within the NAS. To gain this freedom, however, there is an overarching requirement for UAS to have a level of safety that is at least as good as manned aviation. Thus, until sense and avoid (SAA) for UAS reaches an equivalent capability to that of see and avoid, the operation of UAS within the NAS will continue to be restricted.
This chapter focuses on the use of low-cost mobile radar systems for small UAS sense and avoid. These systems are relatively low cost when compared with air traffic control radars or military radar systems. One aim of these systems is to support UAS operations at any required location; therefore, the system must be mobile.
Small unmanned aircraft (UA) are highlighted because of their limitations in carrying additional sensors and systems. There is currently no standard definition of a small UA. One recommendation is for small UA to have takeoff weights that are less than 25 kg [1]. Another definition limits the takeoff weight of small UA to less than 150 kg [2]. Many UA within this weight range have already proven their value. The ScanEagle, for example, achieved 500,000 operational hours during June 2011. On-board SAA solutions for small UAS, however, are difficult to implement due to restrictions on the space, weight and power (SWAP) available on-board the UA. One alternative solution is to use off-board sensors and systems to perform the SAA function.
The Mobile Aircraft Tracking System (MATS) is a mobile, network-enabled air traffic surveillance system. The aim of the MATS is to support the operation of UAS in non-segregated civilian airspace. The MATS does this by detecting the other airspace users with a ground-based primary surveillance radar (PSR). Aircraft fitted with Automatic Dependent Surveillance – Broadcast (ADS-B) may also be independently detected by a co-located ADS-B receiver.
The main function of the MATS is to provide information to the UAS pilot, enabling a ground-based sense and avoid (GBSAA) capability where the pilot is in the control loop. In this case the MATS provides the ‘sense’ function and the UAS pilot provides the ‘avoid’ function by manoeuvring the UA. The MATS also enables an automated SAA capability for UAS operations. In this case, the MATS acts as an aircraft sensor that forms part of a larger aircraft tracking and control network.
The MATS system has been undergoing initial demonstrations and characterisation trials as part of the Smart Skies project [3]. Smart Skies explored the development of technologies that support the greater utilisation of the NAS by both manned and unmanned aircraft. One important feature of the Smart Skies flight trials was the use of an aircraft that accurately logged its position and attitude during experiments. This aircraft was also a valuable calibration target for the MATS.
This chapter begins with an overview of the UAS operating environment, a review of SAA and GBSAA systems and an overview of the Smart Skies project. Smart Skies provided the opportunity to flight test a number of radar-based SAA scenarios and the results of this testing are presented. The tracking of two aircraft that simulated a midair collision, during computer vision SAA experiments, is also included. Examples of the radar tracking a variety of manned and unmanned aircraft are also shown. Weather has always been important to aviation, and an example of the MATS providing information about the location and movement of storms is also provided.
The ultimate aim for UAS operations is to ‘file and fly’: file a flight plan and fly – all within the same day. GBSAA systems enable a pathway for UAS operations in the NAS and these systems are available now.
11.2 The UAS Operating Environment
11.2.1 Why Use a UAS?
In general, missions that are ‘dull, dirty or dangerous’ are thought to be well suited to the application of UAS [4]. A wide variety of homeland security missions, civilian government applications, scientific missions and commercial applications have been identified [5].
Unmanned aircraft have a long history of being used by the military in segregated airspace. Segregating or isolating the UA from unexpected air traffic greatly simplifies the problem of see and avoid. Segregated airspace, of course, does not provide the freedom of movement that is required for many civilian and commercial UAS applications.
11.2.2 Airspace and Radio Carriage
Many countries have adopted the International Civil Aviation Organisation (ICAO) airspace classes [6]. Each country then selects the airspace classes that are appropriate for their needs. The airspace classes can be either controlled or non-controlled.
Air traffic control (ATC) services are provided in controlled airspace. Class A airspace, for example, is high-level en-route airspace that is typically used by high-performance jets and turbo-prop aircraft. Separation services are provided by ATC and there are no speed restrictions. Visual flight rules (VFR) flights are not permitted within Class A airspace.
In non-controlled airspace both instrument flight rules (IFR) flights and VFR flights are permitted. Speeds are generally restricted to 250 knots below 10,000 feet (ft) above mean sea level (AMSL).2 Only IFR flights are required to have continuous two-way communication with ATC.
In Australia, Class G airspace is used wherever the airspace is not designated as being one of the controlled airspace classes. As such, Class G airspace accounts for the majority of Australian airspace and often covers the region from the surface of the earth to the base of the overlying controlled airspace layer. Radio carriage is only required for VFR flights above 5000 ft AMSL and at aerodromes where the carriage and use of radio is required.
The main problem of operating a UAS in Class G airspace is that the location and intent of the other airspace users are unknown. Traditionally, the final defence against a midair collision in Class G airspace is see and avoid, where the flight crew of each aircraft maintains a vigilance so as to see and then avoid other aircraft.
11.2.3 See and Avoid
Aviation regulations require pilots to see and avoid aircraft and other objects while flying in visual meteorological conditions. While see and avoid prevents many collisions, the principle is far from reliable. Numerous limitations, including those of the human visual system, the demands of cockpit tasks and various physical and environmental conditions, combine to make see and avoid an uncertain method of traffic separation [7, 8].
How good are pilots at seeing other aircraft? A series of flight tests to measure pilot air-to-air visual acquisition performance for unalerted visual searches has been conducted [9]. Visual acquisition was achieved in only 56% of encounters, with a median acquisition range of 0.99 nautical miles (NM).
Another experiment also recorded the time when pilots were first able to detect approaching aircraft [10]. Even though the pilots were alerted to the threat, and they knew where to look for the oncoming traffic, they typically could not see the aircraft until it was within a range of 1 to 1.5 NM. The high closing speeds of some of the scenarios meant that the pilots thought they would have been very challenged to avoid the collision.
The unalerted air traffic detection ranges of inexperienced pilots have also been investigated [11]. Each subject pilot was presented with two aircraft conflicts. The first conflict was set up with the target aircraft crossing the flight path of the test aircraft at a 90° angle. The average detection range was found to be 1.3 NM. The second conflict involved the traffic aircraft approaching the test aircraft from straight ahead. The average detection range for this scenario was 0.9 NM. The head-on conflict is thought to be the most difficult scenario in which to detect traffic. This is because of the illusion that the traffic aircraft is not moving. The problem is compounded by empty field myopia where, in the absence of visual cues, the eyes focus at a resting distance of around half a metre [7].
An Advisory Circular has noted that it takes 12.5 seconds for a pilot to recognise and react to a potential collision threat [12]. For a 200 knot closing speed, which is at the lower end of the possible speeds in Class G airspace, this represents a distance of 0.7 NM, which is only slightly less than the average detection range of pilots.
Another study investigated the visual scanning patterns used by pilots [13]. Unfortunately, these patterns did not resemble the prescribed systematic scanning pattern. It was also found that the pilots participating in the study spent more time looking inside the cockpit than outside, and that the average scanning performance of the participants would make them vulnerable to not detecting aircraft conflicts quickly enough to avoid a collision. An important conclusion from the study was that the relatively low rate of midair collisions, in general aviation, is as much a result of the ‘big sky’ as it is of effective visual scanning.
11.2.4 Midair Collisions
It is worth understanding the locations and causes of midair collisions between manned aircraft. One of the primary fears of operating an unmanned aircraft is a collision with a manned aircraft. This fear has driven the requirement for unmanned aircraft to have a SAA capability that is at least as good as the see and avoid function performed by pilots.
Midair collisions involving large commercial aircraft are now extremely rare. This is thought to be due to the on-board Traffic-alert and Collision Avoidance System (TCAS) [14] and the requirement for aircraft to be equipped with transponders in busy airspace [15].
General aviation (GA) refers to a range of civilian aviation activities and businesses, primarily using smaller aircraft and secondary airports. The term ‘general aviation’ is sometimes used to describe all civilian aviation activities other than those involved in scheduled public air transport services.
The characteristics of GA midair collisions in the United States, from 1983 through August 2000, have been investigated [15]. The average risk of a midair collision was found to be one per 800,000 flight hours. Accident reports show that approximately 88% of pilots involved in midair collisions do not see the other aircraft in time to initiate evasive manoeuvres. Another important point is that the failure to see and avoid other aircraft is not strongly correlated with closing speeds. Most midair collisions involve relatively low closing speeds, as one aircraft usually strikes the other from the rear, from above, or from a quartering angle.
Traffic density is also known to be a major factor in midair collisions. The typical midair collision occurs at low altitude on approach and landing or, less frequently, on takeoff and climb-out. Thus, most midair collisions occur near airports, especially non-towered aerodromes.
A review of midair collisions that involved GA aircraft in Australia, between 1961 and 2003, has also been conducted [16]. Midair collisions account for approximately 3% of the fatal accidents involving general aviation aircraft, and 0.4% of all accidents involving general aviation aircraft.
The study found that 78% of the midair collisions have occurred in or near the circuit (traffic pattern) area. This reflects the higher traffic density in this area. A high proportion of the collisions occurred on the final approach or on the base-to-final turn. Most of the collisions involved one aircraft colliding with another from behind, or both aircraft converging from a similar direction.
The study also found that, in general, the characteristics and contributing factors of midair collisions in Australia appear to be similar to those observed in other countries such as the United States, France and Canada.
A 2005 review noted the failure to see and avoid, inadequate visual lookout, or a failure to maintain visual and physical clearance as the probable causes in 94% of midair collisions [8].
A recent study has highlighted that midair collisions result from a combination of proximity risk and see and avoid failure [17]. The study concluded that to perform as well as a human pilot, and thus comply with the regulations, a SAA system only needs to have a failure rate on the order of 10−2 to 10−3 per flight hour. Thus, the SAA system does not need to be a flight critical system, which requires a failure rate of less than 10−7 per flight hour. The required failure rate will have a direct influence on the final cost of any SAA system.
11.2.5 Summary
Initial UAS operations are likely to occur away from populous areas. This means that a typical environment could be a non-towered aerodrome in Class G airspace. The operating environment could also include a variety of aircraft performing a variety of operations, which include training, currency flights and joy flights.
What are the implications for operating a UAS? The environment may contain a variety of aircraft and only some of these aircraft will carry transponders or provide VHF radio reports. The risk of a midair collision is likely to be higher when operating from a non-towered aerodrome. The field of view of any SAA system will need to be carefully considered because midair collisions do not tend to be head-on.
A number of studies have shown the limitations of pilots performing see and avoid. The good news is that the SAA technology developed for unmanned aircraft may also benefit the manned aviation community.
11.3 Sense and Avoid and Collision Avoidance
11.3.1 A Layered Approach to Avoiding Collisions
A layered approach is used to avoid collisions between aircraft in civilian airspace [18]. The idea is that failures would need to occur at multiple layers to cause a system failure that results in a collision. At the strategic level there is airspace structure, procedures and equipment to manage the airspace.
At a more tactical level, separation management is provided by air traffic control and VHF-radio location and intention reports. The aim of this level is to keep aircraft separated by at least a prescribed minimum distance and, in general, to avoid dangerous situations. The goal of this layer has been stated as ‘don't scare others’ [19]. The intent is to manage the airspace by small deviations from the desired flight plan. Remaining ‘well clear’ from other aircraft is the primary aim of the self-separation function of SAA [20].
The collision avoidance layer is activated when self-separation has failed. The aim of this level is to escape dangerous situations. This may involve last-minute and potentially large changes from the desired flight plan. The goal of this layer has been stated as ‘don't scrape paint’ [19]. This collision avoidance function of SAA involves the last-minute manoeuvring to avoid a collision [20].
Intruding aircraft need to be acquired in time to perform the SAA subfunctions: Detect, Track, Evaluate, Prioritise, Declare Threat, Determine Action, Command, and Execute [20, 21]. There can be some consideration of trading sensor acquisition range for the severity of the avoidance manoeuvre. Separation management needs the intruder acquisition to occur at greater ranges to achieve its goal using more gradual evasive manoeuvres. Intruder detection may occur at shorter ranges for collision avoidance at the cost of prompt and vigorous evasive manoeuvres.
The various SAA options may be considered in terms of a detection technology trade space [22]. This trade space may be divided into active or passive SAA systems and then into cooperative or non-cooperative intruder aircraft.
Active systems transmit a signal to receive information about other aircraft. Passive systems do not transmit a signal but use sensor measurements to detect the other aircraft. Cooperative aircraft have an electronic means of identification on-board that is operating (e.g., a transponder) [23]. Thus, to be cooperative, an aircraft is required to carry specific avionics and have this equipment operating normally. The cooperative SAA solution is ideal if every aircraft is fitted with this technology, although this is not the case today. Non-cooperative aircraft do not have an electronic means of identification on-board or the required equipment is not operational due to a malfunction or deliberate action [23].
A recent review recommended that the Federal Aviation Administration (FAA) mandate that all presently non-cooperative aircraft be installed with and operate a short-range, low-power and lightweight electronic means of identification [24]. Another study, using 2007 estimates, noted that it would cost approximately US$58 million to equip the remaining United States fleet of aircraft with ADS-B OUT (transmit only) [25].
11.3.2 SAA Technologies
A literature review of the cooperative and non-cooperative SAA technologies for UAS has been conducted [26]. The review presented a summary of the various technologies but concluded that one single approach may not be adequate for the SAA requirement on a UAS.
A second review also concluded that no single on-board sensor is sufficient to satisfy all the SAA requirements for all UAS [24]. One recommendation was to mandate that all presently non-cooperative aircraft should be installed with and operate a short-range, low-power and lightweight electronic means of identification; that is, all aircraft should be made cooperative. The report noted that continuing the development of on-board sensors to detect non-cooperative aircraft may cost US$2 billion and take more than ten years to achieve a solution.
The need for an on-board capability to SAA other aircraft has been noted as one of the most daunting challenges regarding the routine integration of UAS into the NAS [25]. This study provided a summary of the SAA alternatives and an estimate of the expected time scales: small UAS visual line-of-sight regulations (+2 years), GBSAA dedicated sensors (1–2 years), GBSAA repurposed sensors (2–3 years), cooperative airborne-based sense and avoid (ABSAA) (10+ years) and non-cooperative ABSAA (12+ years).
The following sections present an overview of some of the technologies used to provide UAS with a SAA capability.
11.3.2.1 ABSAA Systems
A number of on-board technological solutions to the SAA problem are being explored, including conventional radar systems [10,27,28], multiple-input multiple-output (MIMO) radar systems [29, 30] and passive vision-based systems [11,31,32].
ABSAA systems have the following advantages and disadvantages.
Advantages
- Provide surveillance for the UA throughout its mission.
- Provide a pathway for fully autonomous UA.
- May perform better than the pilots of manned aircraft.
Disadvantages
- Are still being developed.
- Are limited by the space, weight and power available on-board.
- Will reduce the UA payload carrying capability.
- The cost is per airframe.
Although an international consensus has not been reached, the ASTM Standard F2411 provides an example of the requirements for airborne SAA systems [33]. The requirements include a field of regard of ±110° in azimuth and ±15° in elevation. The nature of manned midair collisions, however, suggests that a 360° azimuth coverage may be required.
One study used a systems engineering approach to evaluate a number of on-board SAA technologies for a specific UAS [34]. In general, the most appropriate technology will depend on the airframe, the mission and the operational area.
11.3.2.2 GBSAA Systems
The traditional method of coping with non-cooperative aircraft in the NAS is by using a PSR. A PSR detects the presence of a target based on the radar signal scattered from the target. Traditionally, PSRs tend to be located at busier airports. A busy airport, however, is not an ideal environment to start the integration of UAS into the NAS. A mobile PSR, however, can support UAS operations at any desired location.
GBSAA systems have the following advantages and disadvantages.
Advantages
- Ideal for supporting small UA operations.
- The technology is available now.
- Do not require modifications to the UA.
- The cost is per location (or system), not per airframe.
Disadvantages
- Provide a static surveillance volume, which may be smaller than the maximum operating range of the UA.
- Local terrain may reduce coverage.
- May detect false targets such as ground vehicles, weather, birds, etc.
- SAA-related manoeuvres depend on a data link to control the UA.
A study of the surveillance technologies that are currently used within the air traffic management system listed the strengths and weaknesses of primary and secondary radar, ADS-B, multilateration systems and ADS-C [35]. Primary radars remain as the only technology in the air traffic management system capable of detecting non-cooperative aircraft.
11.3.2.3 Example Ground-Based Sense and Avoid Systems
Table 11.1 provides an overview of three ground-based radar systems. The Sense-and-Avoid Display System (SAVDS) uses the Sentinel AN/MPQ-64 air defence radar to support UAS operations.3 The Star 2000 is a modern air traffic control radar.4
Table 11.1 Overview of three ground-based radar systems
The instrumented range is shown for each radar system. Ideally, detection ranges for a standard radar cross section (RCS) target would be shown, but this would require detailed information about each system, which is beyond the scope of this study [36]. The RCS is a measure of how detectable an object is with a radar. In general, the RCS of an object is a complex function of the structure and constituent materials of the object, the radar frequency, the radar configuration (monostatic or bistatic) and the aspect angle of the object with respect to the radar. Some radar manufacturers provide theoretical radar coverage information for a standard RCS target. In general, targets that have a larger RCS can be detected at longer ranges than targets with a smaller RCS.
Most ATC radars today are two-dimensional (2-D) systems, which provide range and azimuth information but not elevation information and, therefore, not altitude information [35]. The MATS is also a 2-D system, although a three-dimensional (3-D) height-finding system is being developed [37]. Some military radar systems, like the one detailed in Table 11.1, do provide elevation and altitude information.
Altitude information is an innate part of aviation, so is a 3-D radar required? The factors to consider include the frequency and nature of the UA operations, the complexity of the airspace and the density of the air traffic in the area of operation. In remote areas, where the traffic density is low, a 2-D radar may be sufficient, especially if cooperative systems are able to provide accurate altitude information to supplement the radar data.
ATC radar systems are engineered for high levels of availability and, as such, tend to be expensive. A cost guide for terminal manoeuvring area (TMA) radars is AUD$8 million [35]. High-technology military systems are also known to be expensive. The MATS provides a relatively low-cost solution to supporting UAS operations. Low cost is particularly important for commercial UAS applications because of the competition with manned aircraft solutions. McGeer provides a sobering view on UAS economics and notes ‘On price, robotic aircraft have a long way to go’ [38].
11.3.3 The UA Operating Volume
For each GBSAA system a number of airspace volumes may be defined, as shown in Figure 11.1. There are a number of similarities to the volumes defined for airborne SAA [20].
Figure 11.1 The airspace volumes associated with operating a GBSAA system. The GBSAA system may be located separately from the ground control station (GCS)
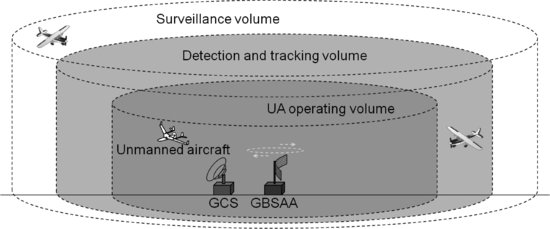
The surveillance volume describes the effective limits of the surveillance system. Aircraft that have a low RCS, particularly small aircraft, may not be detected between the surveillance volume and the detection and tracking volume. Aircraft that have a large RCS, however, may be detected and tracked in this region.
The detection and tracking volume aims to provide a minimum level of detection and tracking performance for an aircraft with a nominated minimum RCS. One example of a boundary specification is where the system detects a 2 m2 Swerling type 1 target with a probability of detection of 80% and a false alarm rate of 10−6 [36].
The UA operating volume is the volume of airspace where the UA conducts operations. This volume is smaller than the detection and tracking volume in order to provide a temporal and spatial buffer between any intruder aircraft and the operational UA. An intruder has been defined as an aircraft that is within the surveillance volume [20].
The performance characteristics of a radar system will set the dimensions of each airspace volume. One important variable to consider is the speed range of the intruding aircraft. The speed of the aircraft and the range to the UA sets the warning time for the SAA timeline [20]. Thus, greater radar tracking ranges will be required for operating environments that contain high-speed aircraft.
11.3.4 Situation Awareness
One of the most widely used formal definitions of situation awareness is ‘… the perception of the elements in the environment within a volume of time and space, the comprehension of their meaning and the projection of their status in the near future’ [39]. Put another way, this means ‘… being aware of what is happening around you and understanding what that information means to you now and in the future’ [40]. These definitions highlight that a person cannot be given situation awareness. GBSAA systems aim to provide information to UAS pilots and, as a result, enhance the pilot's situation awareness.
Maintaining a high level of situation awareness is essential for effective decision-making. Effective decision-making is a key ingredient of SAA, especially while UAS pilots remain in direct control of the UA.
11.3.5 Summary
A wide range of SAA technologies has been developed and each has its own strengths and weaknesses. The diversity of UAS sizes and missions means that a ‘one size fits all’ solution is unlikely.
Small UAS, in particular, have a limited capacity to carry additional SAA avionics. Visual line-of-sight observers have been proposed to provide a collision avoidance capability [23]. Operating with observers is quite restrictive. The observers are to be positioned no greater than one nautical mile laterally and 3000 ft vertically from the UA. Another option, which is available today, is to use GBSAA systems.
A layered approach is used to avoid collisions within the NAS. GBSAA systems are able to provide an additional layer of surveillance, a layer which can assist the integration of UAS into the NAS.
GBSAA systems form part of the strategy for the military to gain access to the NAS [41]. GBSAA systems can also provide a pathway for civilian and commercial applications of UAS.
11.4 Case Study: The Smart Skies Project
11.4.1 Introduction
One goal of the UAS community is to achieve routine, regular and safe integration of UAS into the NAS. To achieve this goal there is a need to research, develop and flight test the technologies that will facilitate this integration. To meet this goal a cooperative research project was initiated: the Smart Skies project.
The aim of the Smart Skies project was to develop technologies that facilitate the greater utilisation of the national airspace system by both manned and unmanned aircraft [3]. These technologies include:
- an automated separation management system capable of providing separation assurance in complex airspace environments;
- sense and avoid systems capable of collision avoidance with dynamic and static obstacles; and
- a MATS that utilises a cost-effective primary radar and cooperative surveillance systems.
An important objective of Smart Skies was to integrate, demonstrate and validate the performance of these technologies through a series of eight integrated flight-test activities. The aim of these flight tests was to characterise the performance of the developed technologies under realistic operating conditions.
An overview of the Smart Skies project, including the MATS, is provided in the following sections.
11.4.2 Smart Skies Architecture
The Smart Skies system architecture diagram is shown in Figure 11.2. The system includes manned and unmanned aircraft, virtual aircraft, public mobile data and Iridium communication links, an Automated Dynamic Airspace Controller (ADAC) and the MATS.
Figure 11.2 The Smart Skies system architecture
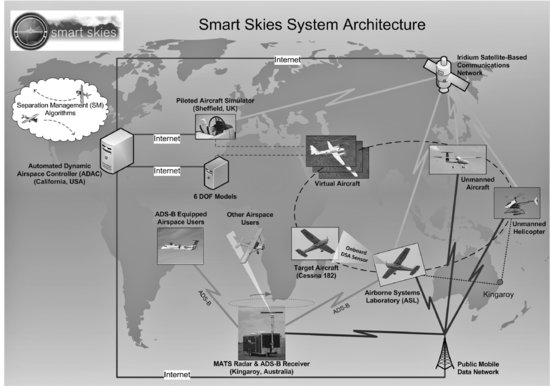
This architecture enables a diverse range of experiments, which extend from the testing and characterisation of individual technologies to automated SAA experiments that involve a system-of-systems.
An important point to note about the architecture is that the manned and unmanned aircraft flight tests occurred near Kingaroy in Australia, but the SAA control system, the ADAC, was located in California in the United States.
All of the systems within the Smart Skies architecture are linked to the Internet by the Iridium satellite communication network and a third-generation (3G) public mobile data network. The Iridium satellite communication system provided global coverage but low bandwidth communication [42, 43]. The 3G public mobile data network provided higher bandwidth links but with a relatively limited geographic coverage [44]. The Smart Skies architecture is not limited to using these two communication links. The aim was to demonstrate a variety of Smart Skies concepts using data links that had different coverage and bandwidth capabilities.
The Smart Skies architecture enables a mixture of centralised and decentralised automated separation management. In the centralised mode of operation the ADAC provides separation assurance to aircraft. In the decentralised mode an aircraft can use the information from the local sensors and systems on-board to remain well clear of other aircraft.
Figure 11.2 shows two methods for simulating aircraft: (a) six degree of freedom (6 DOF) models and (b) the Sheffield engineering simulator [45]. A variety of aircraft could be simulated with the models. These virtual aircraft were important for testing the Smart Skies architecture and also provided a facility to load the architecture with aircraft.
An overview of the MATS, ADAC, Airborne Systems Laboratory (ASL) and Flamingo UAS are found in the following sections. The Smart Skies overview paper provides further information about the autonomous unmanned helicopter and other aspects of the system [3].
11.4.3 The Mobile Aircraft Tracking System
11.4.3.1 Mission
The primary mission of the MATS is to detect and track aircraft that may intrude into the operational area of the UAS. Detecting the operational UAS is secondary as the ground control station (GCS) often tracks the unmanned aircraft via a telemetry link.
The MATS has, however, tracked a number of unmanned aircraft. While not its primary mission, the MATS can provide an independent source of information about the location of an unmanned aircraft. This independence means that the MATS could be used as a secondary navigation system. This capability may be valuable if the UAS navigation system fails or if navigation using the global positioning system (GPS) fails for any reason.
The main function of the MATS is to provide information to the UAS pilot located in the GCS. Due to the differing operating requirements of each system, the MATS may be positioned in a different location to the GCS, as shown schematically in Figure 11.1. In this configuration the MATS provides its information about the local airspace users via a network link.
11.4.3.2 Architecture
Figure 11.3 shows the current architecture of the MATS, which consists of the following subsystems:
Figure 11.3 The architecture of the MATS. Interfaces to two external systems, a UAS ground control station and an ADAC, are also shown
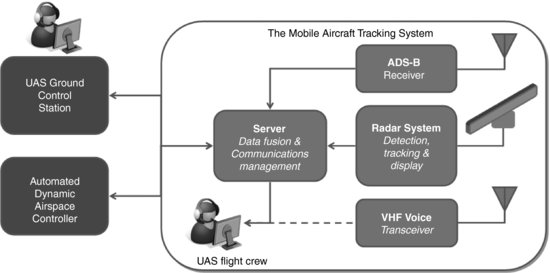
- a primary surveillance radar system;
- an ADS-B receiver;
- a VHF voice transceiver; and
- a server that performs data fusion and communications management.
The UAS flight crew may be located inside the MATS or inside a remote GCS.
Figure 11.3 also shows interfaces to two external systems. The two interfaces provide the means for the MATS data to be used by external systems. These interfaces also enable two different methods of using the MATS for SAA.
One interface enables the MATS to provide information to the UAS pilot. The radar's TCP/IP data networking capability allow tracks and plots to be sent to a remote TrackViewer Workstation (TVW) [46], which may be located in the GCS. In this case the radar and the UAS pilot form part of a pilot-in-the-loop SAA system, where the MATS provides the ‘sense’ function and the UAS pilot provides the ‘avoid’ function by manoeuvring the UA.
The second interface is used by the MATS to provide information about cooperative and non-cooperative aircraft to external systems, such as the ADAC [47]. In this case the SAA system may be automated, where the MATS provides the ‘sense’ function but the ‘avoid’ function is automated. The automation involves the ADAC assessing the airspace situation and then providing updated flight plans to the cooperative aircraft in order to avoid any conflicts.
11.4.3.3 The MATS Radar System
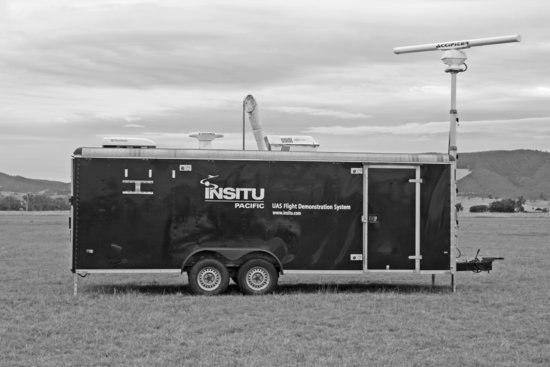
The MATS is installed in a trailer that forms part of the UAS Flight Demonstration System operated by Insitu Pacific Limited (IPL), as shown in Figure 11.4.
Figure 11.4 The MATS is installed in a trailer that forms part of Insitu Pacific's UAS Flight Demonstration System. The marine radar is shown mounted on a mast. The Accipiter® detection and tracking system is located inside the trailer
A key part of the MATS is the primary surveillance radar system. The radar consists of a commercial off-the-shelf marine radar ‘front end’ and a ‘back end’ that performs the detection, tracking and display functions.
The ‘front end’ of the radar is a non-coherent marine radar: a Furuno FAR-2127-BB. A summary of the key characteristics of the Furuno radar is shown in Table 11.2. The radar uses an eight-foot-long slotted waveguide array antenna. This standard Furuno antenna generates a vertical fan antenna pattern and, as a result, no elevation information is available.
Table 11.2 Key characteristics of the Furuno FAR-2127 radar
The three selectable pulse lengths of the radar provide three different range resolution options. In general, the short pulse-length option is used for short-range applications to provide 10.5 m range resolution. The long pulse-length option provides 180 m range resolution and is typically used for long-range applications, such as intruder detection and tracking. The medium pulse length provides a compromise option.
The Accipiter® detection and tracking system forms the ‘back end’ or ‘brain’ of the MATS radar. The radar's performance has been enhanced by replacing the standard marine radar processing with a powerful, software-definable radar processor and tracker [48].
Accipiter's multi-target tracker is designed to manage many dynamic and manoeuvring targets. The system employs a multiple-hypothesis-testing (MHT) interacting-multiple-models (IMM) tracker that enables the system to detect and track manoeuvring targets that have a low radar cross section.
The radar operator is able to set the parameters for the detection and tracking algorithms, allowing the operator to optimise the radar's settings for specific surveillance scenarios.
The MATS provides a variety of display options. The detections from each radar scan may be displayed; these are called plots. Confirmed tracks, with estimated speeds and headings, are usually displayed. The background clutter level may also be selected for display. All of this radar information can be displayed with background maps to provide a geographic context.
11.4.3.4 The MATS ADS-B Receiver
The ADS-B receiver currently used by the MATS is an SBS-1 from Kinetic Avionic Products Limited.5 The SBS-1 is a portable and low-cost 1090 MHz ADS-B receiver [49]. The SBS-1 provides the capability to track and log information about ADS-B equipped aircraft. This information includes the latitude, longitude, altitude, speed, heading and identity.
One advantage of ADS-B is that the aircraft information is transmitted to the receiver. The accuracy of the information is not imposed by the receiver. This must be contrasted with radar systems where the information about the aircraft is measured and, therefore, the accuracy of these measurements is range-dependent.
AirServices Australia provides an overview of ADS-B and the Australian ADS-B network.6
11.4.4 The Airborne Systems Laboratory
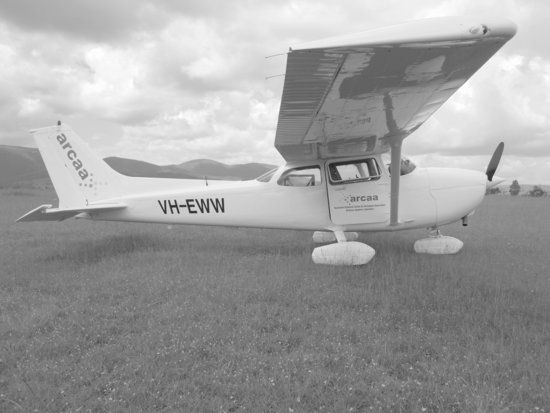
Figure 11.5 shows the ASL, which is a Cessna 172R. The ASL has been equipped with a Novatel SPAN integrated GPS–INS navigation system to provide real-time ‘truth’ data about the aircraft's state. This data includes the aircraft's three-dimensional position, velocity and attitude [50].
Figure 11.5 The ASL is a Cessna 172R
A certified roll-steering converter was fitted to the ASL to provide a digital interface to the existing Honeywell KAP140 autopilot. This interface allowed the aircraft's flight management system to command the aircraft's autopilot directly. This capability allows flight plans to be followed autonomously during the cruise phases of flight.
The ASL is also fitted with an Iridium satellite transceiver and a 3G public mobile data network modem. These two communication systems provide the main communication links to the Smart Skies network.
The ASL is fitted with a 1090 MHz extended squitter (ES) ADS-B transmission system. This system provided an excellent means of independently monitoring the ASL during flight trials.
From the MATS point of view the important features of the ASL are its ability to follow predetermined flight plans and its ability to provide accurate information about the aircraft's position and attitude.
The ASL is a typical GA aircraft, which makes it ideal for radar characterisation studies. The ASL also represents a typical ‘intruder’ aircraft. Thus, the ASL is ideally suited to demonstrating how the MATS can support UAS operations in Class G airspace.
11.4.5 The Flamingo UAS
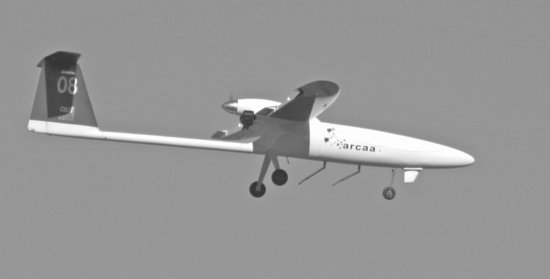
The primary fixed-wing UAS used during the Smart Skies flight trials was based on the Flamingo radio control airframe [3], which is shown in Figure 11.6. The Flamingo system was developed to provide an autonomous unmanned aircraft that could fly beyond visual range. The Flamingo has a maximum takeoff weight of approximately 20 kg, a 4 m wingspan and an endurance of approximately 1 hour.
Figure 11.6 The Flamingo fixed-wing UAS
The avionics payload of the Flamingo included a MicroPilot® MP2128g autopilot, Microhard radio modems, an inertial measurement unit (IMU) and a customised PC104 mission computer. The Flamingo achieved over 70 hours of autonomous flight during the Smart Skies project.
The Flamingo has also served as the image acquisition platform during vision-based collision-detection experiments [32].
11.4.6 Automated Dynamic Airspace Controller
The ADAC provides a capability for automated air traffic control [47]. The ADAC uses existing communication infrastructure, currently the Iridium and 3G public mobile data networks, to control both manned and unmanned aircraft.
The ADAC exchanges custom messages with a data-linked ‘predictive’ flight management system (pFMS), which is on board each manned and unmanned Smart Skies aircraft [47]. These cooperative aircraft periodically send their current and future state information, such as time, position, velocity and attitude, to the ADAC. Each aircraft may also send a message to the ADAC that contains its desired flight plan. The predictive component of the pFMS aims to take into account communication and other latencies so that the ADAC can make latency-compensated decisions.
The ADAC uses the aircraft data to estimate the current and future airspace situation. If the ADAC identifies that a conflict between aircraft may occur, it is able to send a recommended trajectory modification to each aircraft, in the form of a short-term flight plan, to maintain adequate separation between all aircraft. After an aircraft completes the avoidance manoeuvre it returns to its original flight plan.
The ADAC allows the control of cooperative manned and unmanned platforms from any location around the globe that has access to the Internet. During the Smart Skies flight trials this meant that the aircraft flying in Australia were controlled from the United States [47,51,52]. A recent addition to the ADAC is a capability to utilise the information about non-cooperative aircraft that is provided by the MATS.
11.4.7 Summary
This section provided an overview of the elements of the Smart Skies architecture. This architecture provides a comprehensive and flexible system for testing a wide variety of manned and unmanned technologies and concepts.
The MATS used the Smart Skies infrastructure for a variety of ground-based SAA experiments, which are discussed in the following sections.
11.5 Case Study: Flight Test Results
The Smart Skies project provided the opportunity to test the MATS as a ground-based SAA system. The following sections discuss the characterisation of the performance of the MATS, its use in SAA experiments and the radar's ability to detect a variety of aircraft.
11.5.1 Radar Characterisation Experiments
11.5.1.1 Introduction
The aim of the initial series of flight trials was to characterise the performance of the MATS using the ASL. For these tests the ASL was provided with a variety of flight plans to test different aspects of the radar's performance.
There are a large number of variables when testing the detection performance of a radar system. A target's maximum detection range is one of the key metrics when assessing the performance of a radar. The detection range depends on the target's RCS, which is a measure of how detectable an object is with a radar. A target's RCS is a complex function that varies with the radar's ‘view’ of a target. For example, an aircraft flying directly towards the radar will present a different RCS from an aircraft flying directly away from the radar. Thus, the RCS that a target presents to the radar has a direct influence on the maximum range where the target can be detected. The ASL is a typical GA aircraft. This makes the ASL ideal for testing the radar's detection performance because it has a RCS that is typical of an intruder aircraft.
The radar's performance is also influenced by the local environment. Terrain and structures such as buildings can have an impact on detection performance because targets are detected against the associated clutter from the local environment. In these situations target detection depends on the signal-to-clutter ratio and not simply the signal-to-noise ratio.
Some of the initial flight trials were aimed at understanding the performance of the MATS primary radar, including the influence of the background clutter on detection performance. This understanding of the radar's performance was important for the subsequent SAA experiments.
11.5.1.2 The Operating Environment – Watts Bridge
A number of the MATS characterisation flight trials were carried out at Watts Bridge Memorial Airfield, Queensland, Australia (27° 05′ 54′′S, 152° 27′ 36′′E). The airfield has three grass runways: two parallel runways and one cross strip. Mount Brisbane (2244 ft) is located approximately 4 NM to the east of the airfield. Intensive skydiving can often occur at 5 NM to the north-west of the airfield.
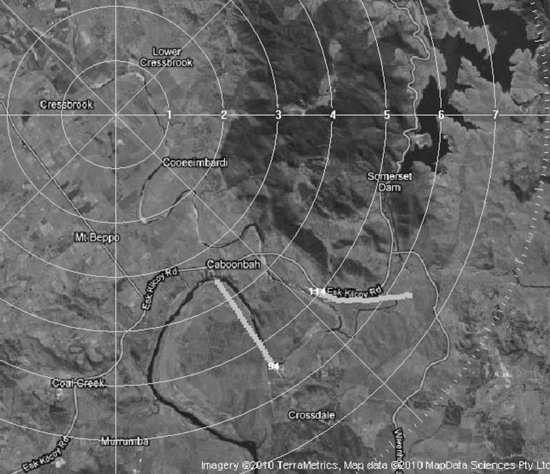
Figure 11.7 Two MATS radar tracks from targets of opportunity in the vicinity of the Watts Bridge Memorial Airfield. Range rings, in one nautical mile increments from Watts Bridge, are also shown. The aircraft speed, in knots, is shown on each track
Insitu Pacific Limited currently uses the airfield for flight training with the ScanEagle UAS.7 Therefore, the airfield represents a realistic environment for testing the MATS.
Many different types of aircraft use the Watts Bridge airfield. These aircraft provide ‘targets of opportunity’ for testing the MATS radar. An example of the radar tracks from two targets of opportunity is shown in Figure 11.7. The figure shows an aircraft that had departed from Watts Bridge airfield and was travelling at 94 knots and an aircraft approaching Watts Bridge airfield at 114 knots.
Targets of opportunity may be used to test the ability of the MATS to track a variety of aircraft. Aircraft may be tracked approaching, departing and performing circuits near the airfield, although the altitude and attitude of the targets of opportunity are unknown and these aircraft also tend to follow their own flight plans. Thus, with the large number of unknown variables involved, it is difficult to get meaningful quantitative results from targets of opportunity alone. The ASL, however, is an ideal aircraft for radar characterisation experiments. It represents a typical GA aircraft and has an accurate on-board position and attitude monitoring system.
11.5.1.3 Circular Flight Paths
For these experiments the ASL was provided with circular flight paths at a number of ranges from Watts Bridge airfield. The circular flight paths meant that the ASL flew at a fixed range from the radar and presented a constant RCS to the radar. Thus, the main variable was the background clutter from the local environment.
Figure 11.8 shows the radar tracks when the radar's long (1.2 μs) pulse was used. The figure shows the tracks from circular flight paths with radii of 2.7 NM (5 km), 3.2 NM (6 km), 4.3 NM (8 km), 6 NM, 10 NM and 14 NM. These results are from flight trials held on 6 May 2010 and 13 July 2010.
Figure 11.8 The MATS radar tracks of the ASL when it flew circular flight paths around Watts Bridge airfield. The flight paths have radii of 2.7, 3.2, 4.3, 6, 10 and 14 NM. The grey shaded regions show the radio wave shadow at 3500 ft AMSL
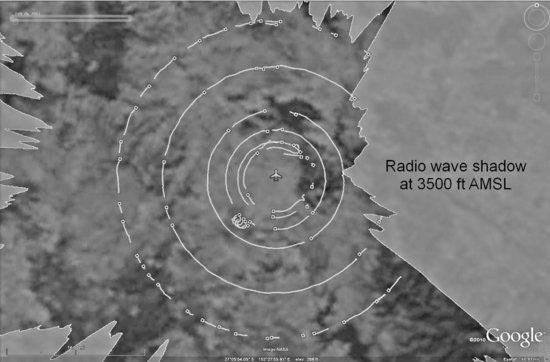
It should be noted that the individual tracks that make up the circular paths have been extracted and plotted in Google Earth.8 Tracks from other aircraft and short-lived tracks have not been included. The gaps in the circular paths represent regions where the ASL was not tracked.
The radio wave shadow regions at 3500 ft AMSL are also shown in Figure 11.8. This map was generated using Global Mapper's Viewshed function.9 NASA's Shuttle Radar Topographic Mission (SRTM) digital elevation data, which provided 90 m resolution, was used in the Viewshed analysis. The large shadow region to the east of Watts Bridge is caused by Mount Brisbane. Airspace restrictions prevented the ASL flying above this shadow region and staying within radio line-of-sight of the MATS. Thus, the ASL was not tracked in this region.
Figure 11.9 shows the background clutter environment from Watts Bridge when the radar used its long (1.2 μs) pulse. The figure shows the significant background clutter that results from Mount Brisbane at ranges of 2–4 NM from the north north-east to the south-east. The figure also shows that the terrain provides high background clutter at other locations (e.g., 5 NM to the north of the radar).
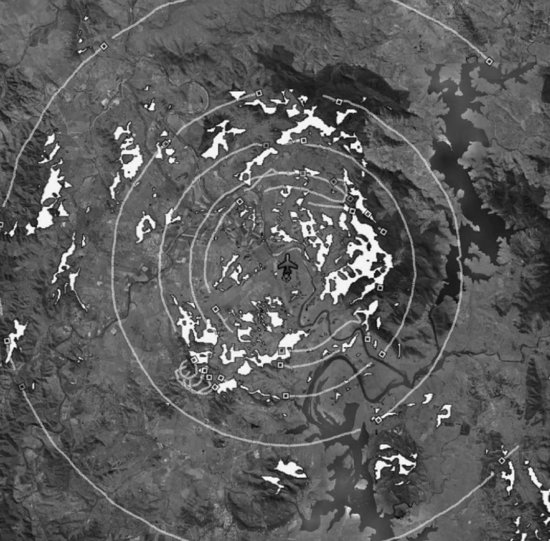
Figure 11.10 shows a map of the areas of the local terrain that are visible to the radar. This figure provides a simple model of where the ground clutter may affect target detection by the primary radar. This map was generated using Global Mapper's Viewshed function. This function highlights all areas that have a clear line-of-sight to the transmitter. An option to show only those regions that have at least a 60% first Fresnel zone clearance was selected.
It should be noted that this is a simple model and does not take into account vegetation or man-made structures. Also, at this stage, no attempt is made to predict the intensity of the backscatter at each location.
Figure 11.8 shows the radar tracks when the ASL flew a number of circular flight paths at different ranges. Whilst some of the longer-range circles are almost continuous, the figure shows that large sections of the shorter-range circular tracks are missing. The background clutter environment shown in Figure 11.9 provides an explanation. The high-clutter regions shown in Figure 11.9 produce low signal-to-clutter ratios, which hamper the detection and tracking of aircraft.
Despite the simplicity of the model, Figure 11.10 confirms that the areas of strong background clutter are produced by terrain that is within radio line-of-sight of the radar.
The high background clutter levels may be mitigated by modifying or replacing the COTS marine radar antenna. The presence of Mount Brisbane, however, highlights that the clutter may be minimised but not completely removed.
Figure 11.8 shows that the 4.3 NM and 6 NM tracks are continuous in the direction of Mount Brisbane. This is because the ASL stayed within radio line-of-sight of the radar. These areas are also located in low-clutter regions, which enhance the detection of aircraft.
Figure 11.8 also highlights the problem of trying to assign a single detection range for the radar. The ASL is almost continuously tracked at 10 NM, outside the terrain shadow region, but the tracks at 14 NM are more intermittent.
In general, aircraft that have a large RCS, such as passenger jet aircraft, will be detected and tracked at longer ranges while aircraft that have a smaller RCS, including small UAS, will only be tracked at shorter ranges.
Figure 11.9 The clutter environment observed by the MATS radar. The clutter signal strength is displayed using a greyscale, where white indicates the strongest clutter. Range rings, in one nautical mile increments, are also shown
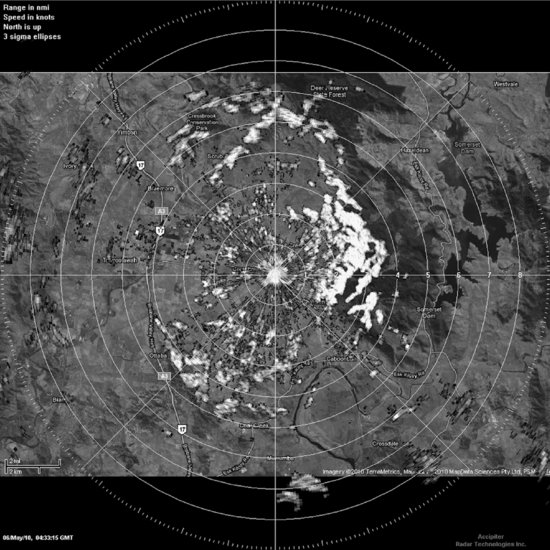
Figure 11.10 A map showing areas of the local terrain that are visible to the radar (lighter areas). This map provides a simple method of predicting where the radar will experience high background clutter. The outer circle shows the 10 NM tracks from Figure 11.8
The flight test results show that the clutter environment leads to both a range and an angular dependence on detection performance. The modelling results show that the poor detection regions are predictable, even with a simple model.
Finally, aircraft are not expected to always fly circular paths. The circular flight paths are, however, a means of keeping many of the detection-related variables constant, thus providing a method of examining the influence of the local environment on the performance of the radar.
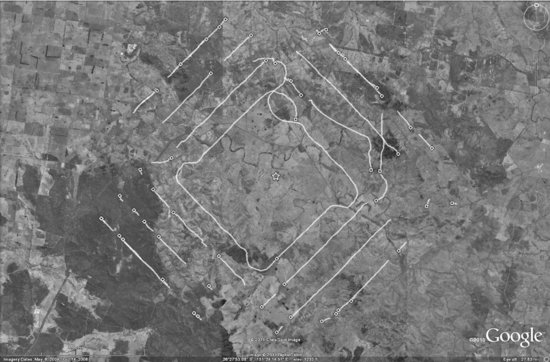
Figure 11.11 The ASL's tracks from a number of diamond flight plans. The flight plans had apices that were 4.3, 6, 8 and 10 NM, respectively, from the local grass runway. The star symbol shows the location of the MATS
11.5.1.4 Diamond Flight Paths
For the flowing flight tests the MATS was located on a farm at Burrandowan, Queensland, Australia (26° 27′ 36.78′′S, 151° 24′ 15.66′′E). The flight tests occurred during November and December 2010.
In the following experiments diamond flight plans were used to test the radar. In these examples the range and the radar–target geometry changes with time. The geometry change means that the RCS presented by the target to the radar also changes.
Figure 11.11 shows the radar tracks when the ASL flew diamond flight plans. Each side of a diamond could represent a flight path where the target is transiting the area near the radar. The diamond flight paths provide a convenient and reproducible means of sampling the large number of possible flight paths.
The diamond flight plans had apices that were 4.3, 6, 8 and 10 NM, respectively, from the local grass runway, which was located approximately 0.6 NM to the south-west of the MATS.
For each side of the diamond flight plan the range from the MATS to the ASL initially decreases and then increases as the aircraft flies by the MATS. The RCS that the ASL presents to the radar also changes along this path, along with the background clutter. Thus, although the flight plans are relatively simple, there are a number of factors that simultaneously influence the detection performance of the radar.
The collection of tracks produced by the diamond flight plans also shows the effect of increasing range from the MATS. At the longer ranges the tracks are consistently lost near the corners of the diamond. In this region the aircraft turns and the RCS presented to the radar changes the most – from an oblique tail-on view of the aircraft to an oblique head-on view.
The ground clutter map measured at Burrandowan did not display a strong azimuth dependence, unlike the measurements at Watts Bridge. This meant the tracks were more consistent with azimuth. As a result, the main variables that influenced the tracking performance, at this location, were the range and the RCS – as expected.
11.5.1.5 Summary
This section presented the results from testing the MATS using the ASL. The ASL and its ‘truth’ system provided a means of quantifying the performance of the MATS because the aircraft's location and state information were independently measured. The ASL could also autonomously follow predefined flight paths and, as a result, provided a capability to gather repeatable results.
Circular flight paths were used at Watts Bridge to gain an appreciation of the influence that the environment has on detection and tracking performance. The results show that high-clutter regions can produce a momentary loss of tracking in some areas.
The high-clutter regions are predictable and many of these areas could be reproduced using a Viewshed analysis. Plans are in place to improve the radar's antenna system. The aim is to reduce the effects of ground clutter.
Tests using diamond flight paths, at a different location, showed the expected range and RCS dependence.
The flight trial results show that, for an ASL-sized aircraft, initial tracking may occur at ranges of approximated 14 NM. Consistent tracking is likely to occur at shorter ranges, approximately 6 to 10 NM. These ranges are greater than what can be expected from the visual observers that are currently required to support UAS operations.
The results also show that the UA operating volume, as shown in Figure 11.1, may be restricted to a range of 6 to 10 NM. The aim is to provide a spatial buffer between the areas where an intruder may be detected and where the UA is being operated. The speed of the intruder and the distance to the UA may be converted into a warning time, which may be used to manoeuvre the UA well clear of the intruder.
Figure 11.8 also suggests that a buffer may be required around any local terrain features that cause a radio wave shadow. Shadow regions reduce the detection range of intruding aircraft, and hence the warning time. This means that the UA operating volume may not be as symmetrical, in practice, as the one shown in Figure 11.1.
What if longer-range radar coverage is required? There are two general options. The first uses a primary radar that provides the desired range coverage. The second option uses a network of low-cost radars [46]. The logistics and costs of this option can be weighed against those of the single-radar option.
11.5.2 Sense and Avoid Experiments
11.5.2.1 Introduction
The aim of the MATS is to support UAS operations. A typical place to operate a UAS is a small non-towered aerodrome in Class G airspace. At this type of aerodrome it is usual to have a variety of aircraft approaching and departing. If these aircraft carry VHF radio then their position and intent are easy to obtain. In general, this radio-based coordination works well.
A percentage of the aircraft, however, will not carry VHF radio. Therefore, coordinating UAS activities with these aircraft will not be possible. The result is that the primary radar of the MATS is one of the only ways to track these aircraft. Non-cooperative aircraft that do not carry VHF radio represent the most challenging class of airspace user – for both manned and unmanned aircraft. This is also the scenario where the primary surveillance radar comes into its own.
There is an important question to be answered: if a non-cooperative intruder aircraft is detected by a radar then what actions should the UAS pilot take to avoid conflicts with the aircraft? Some action may be required if the intruder aircraft penetrates the UA operating volume, as shown in Figure 11.1.
The aim of this section is to explore the operation of a UAS in non-segregated airspace where intruder aircraft are also part of the environment.
11.5.2.2 Intruder Scenario
The general scenario being considered is:
- a small UA is operating near a non-towered aerodrome;
- UA operations are supported by a primary radar whose role is to detect aircraft beyond the visual range of any observers at the aerodrome;
- intruder aircraft are non-cooperative and are not carrying VHF radio; and
- intruder aircraft may arrive at any time from any direction.
The intentions of the intruder aircraft are likely to be unknown. One option is for the intruder to overfly the airfield, join the circuit (traffic pattern) and land. Another option is that the intruder will transit the area. The intruder may also have a less-predictable flight path, such as general sight-seeing. As such the UA may need to move to a new location or change altitude to mitigate the risk of collision.
11.5.2.3 Speeds and Distances
It is quite common for an intruding GA aircraft to have a speed advantage over a small UA. This means the UA will not, in general, be able to outrun the intruder.
The speed advantage of the intruder limits the separation options of the UA. If the intruder is detected at 6 NM and is flying at 100 knots, then it will reach the aerodrome in 216 seconds (1 NM in 36 seconds). A UAS flying at 50 knots can only travel 3 NM in this time (1 NM in 72 seconds). If the UA is more than 3 NM away from the aerodrome then it will not be able to reach the circuit area before the intruder reaches the aerodrome.
11.5.2.4 The Minimum Altitude of an Aircraft
Aircraft should not generally fly near any city, town or populous area, at a height lower than 1000 ft above ground level (AGL). In other areas an aircraft should not fly lower than 500 ft AGL. Thus, the region between the ground and 500 ft AGL may provide a safe place for a UA to loiter when intruder aircraft approach the UAS operational area.
Near an aerodrome, by convention, the following circuit (traffic pattern) heights are flown [53]:
- High-performance aircraft, above 150 knots: 1500 ft AGL.
- Medium-performance aircraft, between 55 knots and 150 knots: 1000 ft AGL.
- Low-performance aircraft, maximum 55 knots: 500 ft AGL.
This structure provides an example of a procedure that separates aircraft with different performance characteristics. The structure also shows that aircraft are not expected below 500 ft.
11.5.2.5 Unmanned Aircraft Locations and Actions
There are four general geographic areas where the UA may be located. These areas have been defined below, based on the recommended course of action for the UA. These areas are:
1. Danger – The UA is between the intruder and the aerodrome but outside the circuit area. This configuration limits the time for the UAS to act.
2. Transit – The UA is outside the circuit area but it is in the likely transit area of the intruder.
3. Hold – The UA is outside the circuit area and is positioned laterally to the current flight path of the intruder.
4. Circuit – The UA is within the boundary where it can reach the circuit (traffic pattern) area before the intruder.
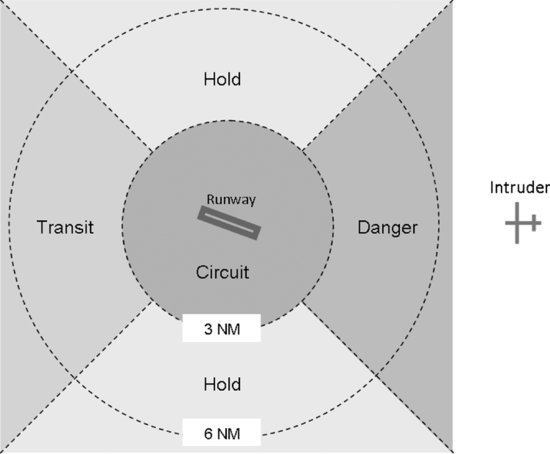
Figure 11.12 shows the layout of the four geographic areas with respect to where the UA may be located. The idea is to rotate the figure so that the danger area is oriented towards the intruder aircraft.
A 3 NM radius circuit area is shown for the Flamingo. In general, this radius is set by the speed capabilities of the UA. A 6 NM circle is shown for reference purposes. The aim is that this threshold distance and intruder speed will allow a calculation of the time until the aircraft reaches the aerodrome.
The UAS actions, when the UA is located in each area, are as follows:
| Area | UA command |
| Danger | Descend to ≤ 400 ft AGL and orbit. |
| Transit | Track to a hold area and orbit. |
| Hold | Orbit or maintain speed and heading, whichever is safer. |
| Circuit | Track to the ‘dead’ side of the circuit at ≤ 400 ft AGL and orbit. |
The other options considered for the UA were landing or climbing. The general problem with landing the UA is that if there is an accident on landing, the UA will then become a hazard for the intruder aircraft as it lands. The general problem with commanding the UA to climb is that the climb rate of small UA is often too slow to be useful as an avoidance manoeuvre.
Figure 11.12 The UAS action map. The map shows the layout of the four geographic areas where the UA may be located. The map is rotated so that the danger area is oriented towards the intruder aircraft
Commanding the UA to join the circuit was also considered. This idea was rejected because it would involve a small and difficult-to-see aircraft (the small UA) mixing with manned aircraft where the traffic density may be relatively high.
Zero conflict airspace has been proposed as one method of managing UAS operations in response to other air traffic [20]. The aim of Figure 11.12 and the associated UA actions is to provide a more flexible concept for managing operations.
11.5.2.6 Results
The Smart Skies project provided an opportunity to examine the operation of a UAS when an intruder aircraft approaches the operational area. In these experiments the ASL played the role of the intruder.
For these experiments the Flamingo unmanned aircraft was only permitted to operate within a 2 NM radius of the local airfield and from the ground to 2700 ft AMSL. This restricted the UA options that could be tested in the following experiments.
Figure 11.13 shows one example of the intruder experiment, which was performed on 5 August 2010. The radar and GPS-based ‘truth’ tracks for the ASL are shown in the figure.
Figure 11.13 The radar tracks of the ASL (white) and the Flamingo UA (black). The thick lines show the radar tracks whilst the fine lines show GPS-based ‘truth’ tracks. The star symbol shows the location of the MATS. This experiment was performed on 5 August 2010
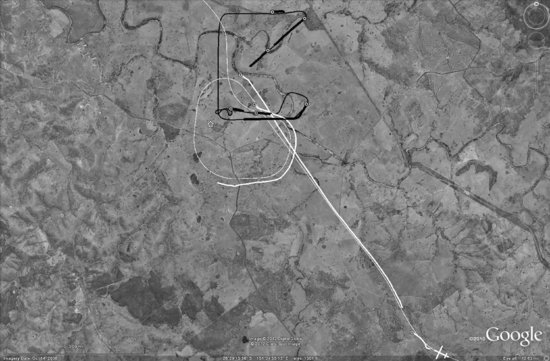
The Flamingo UAS was being operated from its GCS, which was located on the airfield. The radar and GPS tracks for the Flamingo are also shown in the figure.
The MATS was located approximately 0.38 NM to the south-west of the Flamingo's GCS. This means that position reports from the MATS were provided to the UAS pilot using VHF voice radio calls.
Figure 11.14 shows a second example of the intruder experiment. The MATS was moved to a different location, approximately 0.6 NM to the north-east of the airfield. In this case, the MATS initially tracked the aircraft moving away from the airfield towards the north-east. The aircraft then turned towards the airfield.
Figure 11.14 The radar tracks of the ASL (white) and the Flamingo UA (black). The thick lines show the radar tracks whilst the fine lines show GPS-based ‘truth’ tracks. The star symbol shows the location of the MATS. This experiment was performed on 10 December 2010
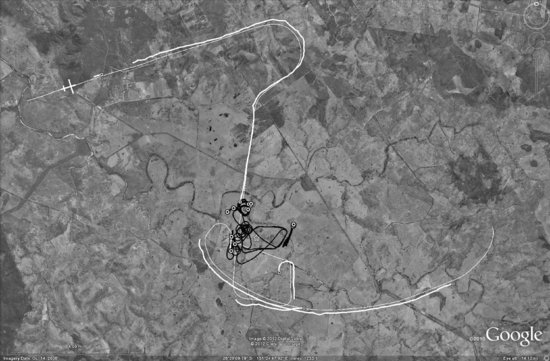
Position reports from the MATS were again provided to the UAS pilot using VHF voice radio calls.
11.5.2.7 Discussion
Figure 11.13 and Figure 11.14 provide examples of the ASL acting as an intruder. The MATS tracked the intruder and radar-based position reports about the intruder were provided to the Flamingo UAS pilot using VHF voice radio calls.
The UAS pilot, located in the GCS, was responsible for operating the UAS. The UAS pilot was also responsible for acting on the position, speed and heading reports provided by the MATS operator.
The experiments confirmed that it was difficult to control the UAS and mentally track the location of the intruder from the radio reports. Receiving and comprehending the radar-derived reports was found to lengthen the SAA timeline [20, 21]. As one report was being interpreted by the UAS pilot another radio broadcast would begin. Training and practice may help with the management of the workload. There is a suspicion, however, that if the number of aircraft in the vicinity increases then the UAS pilot will again be overwhelmed.
A common approach is to operate the UAS with two people inside the GCS: one operating the UAS and the other managing airspace-related issues. In this configuration the aim of the MATS is to provide information to the airspace manager. This method has been used successfully in other flight trials.
The next technological step is for the radar to display the real-time airspace picture inside the GCS. The radar's remote display, the TVW, provides this capability [46]. The TVW will also help to prioritise the UAS manoeuvres for multiple intruder scenarios. Some initial trials of using the TVW have also been successfully completed.
11.5.2.8 Summary
The aim of this section was to consider the practical problems associated with operating a UAS near a non-towered aerodrome. A strategy for manoeuvring the UAS when the MATS detects intruder aircraft was presented. The strategy is particularly relevant for small UAS where a GBSAA system is supporting their operations.
The examples demonstrated the ability of the MATS to detect and track the intruder aircraft. In these scenarios the radar and the UAS pilot form a pilot-in-the-loop SAA system: the MATS provides the ‘sense’ function and the UAS pilot provides the ‘avoid’ function by manoeuvring the UA.
The airspace picture provided by the MATS is frequently updated. This must be contrasted with the current situation where intermittent position and intention reports are only provided by radio-equipped aircraft.
GBSAA systems are able to detect and track aircraft at greater ranges than visual observers. This greater range translates into more operational freedom and more time to manoeuvre the UA well clear of any intruder aircraft.
11.5.3 Automated Sense and Avoid
One of the highlights of the Smart Skies flight test programme was the automated SAA experiments. These experiments used the MATS primary radar to provide the ADAC with information about non-cooperative aircraft. The ADAC's role was to control the cooperative aircraft.
The non-cooperative aircraft could not be controlled by the ADAC if a potential conflict was identified. Instead, the cooperative aircraft involved in the conflict could be issued with an updated flight plan to keep all the aircraft separated from each other.
The Smart Skies architecture was shown in Figure 11.2. The automated SAA experiments used this architecture in an integrated manner. In these experiments the MATS and the aircraft were located in Australia while the ADAC was situated in the United States. The 3G public mobile data network was used by the MATS to provide the ADAC with information about the non-cooperative aircraft.
In these experiments the ASL acted as a non-cooperative aircraft, which was tracked by the primary radar of the MATS. The cooperative aircraft used in the experiment were simulated, but this makes no difference to the ADAC as they behave like real cooperative aircraft: they produce periodic position reports and can receive updated flight plans from the ADAC.
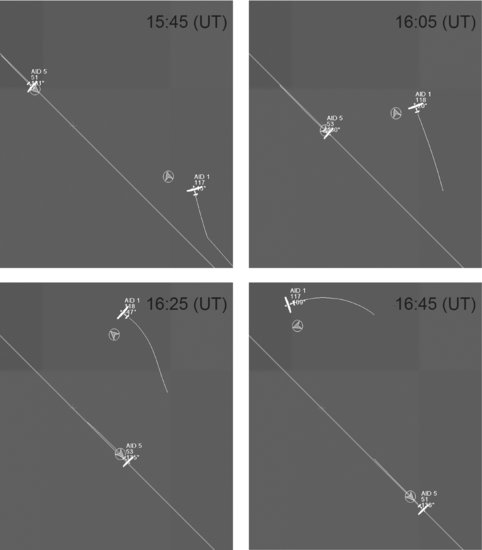
Figure 11.15 shows an example of the results from the automated SAA experiments. Initially, the non-cooperative ASL (AID 5) and the cooperative virtual aircraft (AID 1) were following their respective flight plans. The cooperative aricraft (AID 1) was then issued with an updated flight plan, by the ADAC, to avoid the non-cooperative aircraft (AID 5), which was detected by the MATS. After the encounter the cooperative aircraft returned to its original flight plan.
Figure 11.15 A sequence of displays that show the results from an automated SAA experiment. The straight line shows the original flight plan of each aircraft. The cooperative aircraft (AID 1) was then issued with an updated flight plan, by the ADAC, to avoid the non-cooperative aircraft (AID 5), which was detected by the MATS. The cooperative aircraft returned to its original flight plan after the encounter
Examples of automated SAA, for cooperative aircraft, were the focus of the early Smart Skies flight trials [47,51,52]. These experiments demonstrated the automatic control of aircraft from a remote location using the Internet.
Non-cooperative aircraft are part of today's aviation environment. A capability to detect and track these aircraft was provided by the MATS. The Smart Skies architecture has also provided the opportunity to extend automated SAA to include non-cooperative aircraft. Although only one example is provided here, the Smart Skies flight test programme used both diamond and circular flight plans to test automated SAA.
TCAS and ADS-B provide examples of cooperative technologies that are in use today. The Smart Skies network may be seen as an extension to these cooperative technologies, where additional information can be sent and received over the data links. The ADAC exchanges custom messages with a data-linked pFMS, which is on board each manned and unmanned aircraft [47]. These messages include the desired flight plan of an aircraft and a commanded flight plan, which is issued by the ADAC when a conflict is identified.
Today, small UAS are operating in an environment with both cooperative and non-cooperative aircraft. This section demonstrated the ability of the Smart Skies architecture to automatically manage a variety of aircraft from a remote location, in what is currently non-controlled airspace.
11.5.4 Dynamic Sense and Avoid Experiments
The Smart Skies project developed a number of SAA technologies [3]. One of these technologies is a computer vision system that aims to provide an on-board automated SAA capability that is at least as good as a pilot.
The dynamic sense and avoid (DSA) experiments were performed as part of the Smart Skies flight trial programme. The experiments involved the ASL flying a number of head-on and tail-chase encounters with a target aircraft. The aircraft were always separated by a minimum of 500 ft in altitude during the experiments. The ASL was used as the test platform that carried the computer vision equipment. The target aircraft was a Cessna 182P.
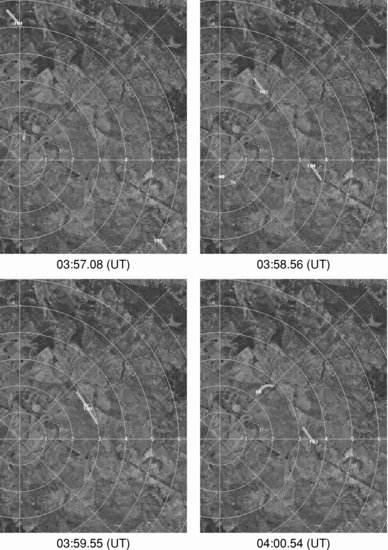
The MATS was used to observe these experiments passively. Figure 11.16 shows a sequence of screen shots from the experiments. Initially, the ASL is shown 5 NM north of the MATS. The target aircraft is located 6 NM to the east south-east of the MATS. The figure shows the two aircraft approaching and then departing the encounter point.
Figure 11.16 A sequence of MATS displays from the head-on SAA experiment conducted on 7 December 2010. The images are approximately 1 minute apart. The ASL is initially shown to the north of the MATS. The target aircraft is shown to the east south-east of the MATS. The aircraft speed, in knots, is shown on each track
The DSA experiments provided an opportunity to monitor a simulated midair collision. The experiments also demonstrated the radar's ability to track two aircraft and provide information about the local airspace users in an area that is currently non-controlled airspace.
Pilots take 12.5 seconds to recognise and react to a potential collision [12], and are able to detect potential head-on collisions at ranges of approximately one nautical mile. The MATS, by contrast, was able to monitor each aircraft during the entire encounter. This real-time view of the local airspace users also demonstrates the value of the MATS in supporting UAS operations.
The networking capability of the MATS also allows radar-tracking information to be viewed at a remote location. Therefore, the MATS could be used to provide low-cost surveillance at a currently non-towered aerodrome.
11.5.5 Tracking a Variety of Aircraft
11.5.5.1 Introduction
The ASL provided the ideal platform for testing the MATS. The ASL represents a typical GA aircraft, which also represents a typical intruder aircraft from a radar point of view. The ASL was also fitted with a GPS–INS navigation system to provide real-time and independent ‘truth’ data about the aircraft's state.
For any GBSAA system there is a need to demonstrate the ability to track a variety of aircraft. The FAA, for example, has provided some interim operational approval guidance for UAS flight operations [23], which notes:
If special types of radar or other sensors are utilized to mitigate risk, the applicant must provide supporting data which demonstrates that:
- both cooperative and non-cooperative aircraft, including targets with low radar reflectivity, such as gliders and balloons, can be consistently identified at all operational altitudes and ranges, and,
- the proposed system can effectively deconflict a potential collision.
The results shown in this section provide examples of the supporting data that may be included in applications for greater access to airspace for UAS operations.
11.5.5.2 Royal Flying Doctor
The MATS was operated at Kingaroy Airport, Queensland (26° 34′ 48′′S, 151° 50′ 30′′E). This provided an opportunity to track a Royal Flying Doctor Service aircraft, a twin-engine Hawker Beechcraft B200 King Air. Figure 11.17 shows the radar and ADS-B tracks for the arrival at and subsequent departure from Kingaroy Airport.
Figure 11.17 Radar (thick lines) and ADS-B (fine line) tracks of the Royal Flying Doctor Service arriving at and then departing from Kingaroy Airport, Queensland, on 28 September 2010. The inset shows a photograph of the King Air
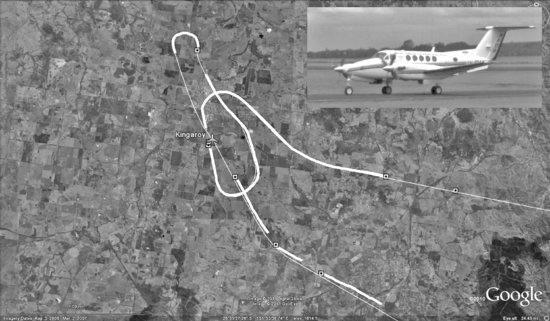
The figure shows that the aircraft approached from the south-east. The radar track starts approximately 10 NM away from the airport. The aircraft later departs the airport and heads east. The aircraft is tracked by the radar until it is 11 NM from the MATS. The ADS-B receiver was able to track the approach of the aircraft from 38 NM from the airport. When the aircraft departed it was tracked until 42 NM from the airport.
The correspondence between radar and ADS-B tracks has been reported elsewhere [54]. These tracks had a distinctive ‘signature’, occurring on predefined flight paths. In one example the received ADS-B information allowed the aircraft to be identified as a Boeing 777-2D7ER, which was on descent to Brisbane International Airport. At the closest point the aircraft was 16 NM from the MATS. A large variety of aircraft have since been simultaneously tracked by the radar and ADS-B systems.
The aim of an ADS-B receiver for the MATS is to: (a) provide detailed information about the aircraft that are also detected by the radar, and (b) provide information about equipped aircraft that are beyond the radar's operational range.
One advantage of ADS-B is that the identity, altitude and velocity are also provided for an aircraft. Therefore, ADS-B-equipped aircraft are able to act as alternative calibration sources for the primary radar.
11.5.5.3 Microlight
A wide variety of GA aircraft uses the Watts Bridge airfield. Figure 11.18 shows the MATS radar tracks from a microlight aircraft. As the figure shows, the microlight initially heads south-east, then flies around Mount Brisbane, over Somerset Dam, before returning to Watts Bridge. The figure shows that, for most of the flight, the aircraft stays within radio line-of-sight of the MATS.
Figure 11.18 The radar tracks from a microlight flight on 13 July 2010. The inset shows a photograph of the microlight
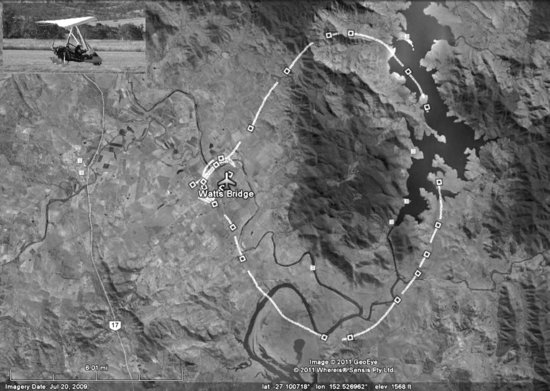
One of the aims of this example is to demonstrate the ability of the MATS to track a small aircraft over an extended flight. This aircraft is also of interest because of its construction; it does not have a traditional aluminium-clad airframe.
The construction of an aircraft has a direct influence on its RCS. Obtaining a theoretical model of the RCS for an aircraft is a complex process. Field measurements, however, provide a practical way of understanding the ability of a radar to detect such aircraft.
11.5.5.4 Tracking Unmanned Aircraft
Section 11.4.3.1 noted that tracking the operational UAS is not the main mission of the MATS because the location of the UA is often known. The GCS typically receives real-time information from the UA under its control.
An example of tracking the ScanEagle® unmanned aircraft with the MATS was presented in [54]. The ScanEagle has a wing span of 3.11 m and a length of 1.37 m. Small UA will generally have a RCS that is smaller than GA aircraft. This means that the detection and tracking of small UA will occur at shorter ranges than for GA aircraft.
The Smart Skies flight test programme provided the opportunity to track the Flamingo unmanned aircraft. Details of the Flamingo were provided in Section 11.4.5. Figure 11.13 and Figure 11.14 provided examples of the MATS tracking the Flamingo. Figure 11.19 provides an example with a longer flight time. The figure shows both the radar tracks and the GPS-based ‘truth’ tracks.
Figure 11.19 The MATS radar tracks of the Flamingo unmanned aircraft from the Smart Skies flight trial on 10 December 2010. The thick lines show the radar tracks whilst the fine line show the GPS-based ‘truth’ tracks. The star symbol shows the location of the MATS. The inset shows a photograph of the Flamingo
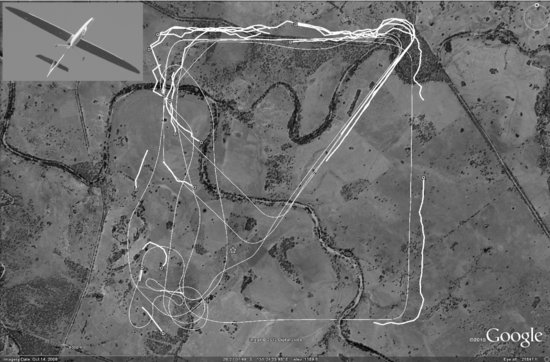
The figure shows that tracking tends not to occur near the radar. At short ranges the position of the aircraft with respect to the radar is important. If the altitude of the UA is too high, for example, then it may not be within the radar's field of view. Operating the radar at a different location may be considered if tracking the UA throughout its flight is important.
A small systematic offset between the UA track and the radar tracks may be observed in Figure 11.19. The data shown is as recorded, but this offset could be calibrated out of the system if required. The offset is small and is approximately one long-pulse range resolution cell.
Figure 11.19 demonstrates the ability of the MATS to track a low RCS aircraft when it is within the radar's field of view. Why track an unmanned aircraft? One option is to use UAS to test and calibrate other systems, such as the MATS. Many UAS already log position, speed and other information as part of their operations. As this section has demonstrated, this independent ‘truth’ information is valuable for GBSAA systems.
11.5.5.5 Summary
The MATS has demonstrated its ability to track a wide variety of aircraft, from large passenger aircraft to a small unmanned aircraft. The ability to track non-cooperative and cooperative targets was demonstrated. One example also showed the close correspondence between radar and ADS-B tracks. A microlight and an unmanned aircraft demonstrated the ability of the MATS to track low-RCS targets.
Targets of opportunity are valuable for demonstrating a radar's ability to track a variety of aircraft. Limited tracking opportunities and other unknowns, such as altitude, can make the radar performance information from these aircraft difficult to generalise.
On-board GPS logging and ADS-B systems can provide independent information about an aircraft. This information may be used to calibrate and test GBSAA systems.
Targets of opportunity also demonstrate the ability of the MATS to provide information about the local airspace users to the UAS pilot. These aircraft provide realistic examples of unknown aircraft approaching and departing an aerodrome at unpredictable times and directions. Other studies have also shown the ability of radars to improve the situation awareness of UAS pilots [55].
11.5.6 Weather Monitoring
Weather information has always been important to aviation. With advances in technology, more accurate information is available to assess the current conditions and to make forecasts.
Many countries now have dedicated weather radar networks. The individual radars are often located to provide coverage over major population centres. From a UAS perspective these radars will not always be able to provide coverage in the required operational area. This section shows that the MATS may be used by the UAS pilot to sense and avoid weather.
Figure 11.20 shows a sequence of four clutter maps from the MATS radar taken at 30-minute intervals. Within 5 NM the clutter is relatively static, from image to image, as this is ground clutter from the local terrain.
Figure 11.20 The radar clutter maps show the approach of a storm on 28 September 2010. The clutter signal strength is displayed using a greyscale, where black indicates the strongest clutter. The time between each image is 30 minutes. The range rings are in 5 NM increments
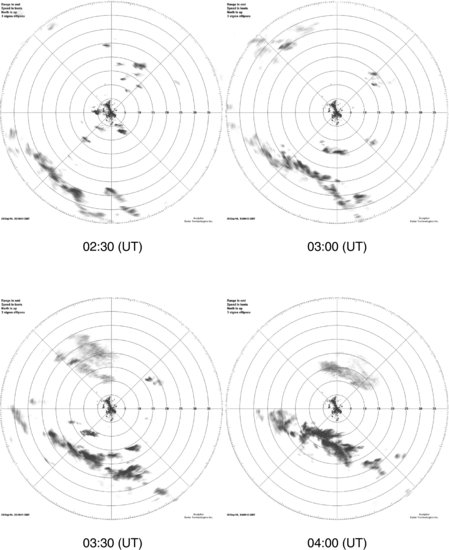
One of the largest features is the storm that is initially located to the south-west of the MATS. The images show that the storm moves towards the radar over the next hour and a half.
The images also show other rain areas. One less-intense rain area is initially observed towards the north-west of the MATS. The rain is seen to move south-east until it is located to the north-east of the radar in the last image.
Other smaller rain areas may be seen to move between each image. These other areas can be tracked by using the higher time resolution data that is available – the radar has an update rate of 2.5 seconds.
This example demonstrates the ability of the MATS to provide information about precipitation within the radar's coverage. This near real-time weather information is useful because it provides a picture of the conditions that may affect UAS operations.
The calibration and use of an X-band marine radar as a cost-effective weather radar has been studied [56]. The cost per installation was estimated to be less than one-sixth of that of a state-of-the-art X-band weather radar system. The use of low-cost and low-infrastructure X-band radars for meteorology has also been investigated [57]. The study compared the results of the X-band radar with an S-band weather radar and reported ‘outstanding’ results. Therefore, the MATS is able to provide valuable weather information that can support UAS operations.
11.5.7 The Future
The next phase of development of the MATS is likely to be an upgrade of the standard antenna system. The aim is to reduce the effects of ground clutter and increase the radar's vertical coverage.
The data from the MATS sensors are not currently fused in real time. Work is underway to present a fused common operating picture (COP) to the UAS pilot, which is similar to what is provided to air traffic controllers [58]. This fused picture will make it easier to identify non-cooperative aircraft – an important aspect of operating in the NAS.
11.6 Conclusion
Unmanned aircraft require a capability to sense and avoid in order to gain greater operational freedom within the NAS. Many solutions to this problem are being developed. In this chapter we have demonstrated the ability of a low-cost mobile radar system and an ADS-B receiver to support UAS operations.
GBSAA systems are particularly relevant to small unmanned aircraft as they often have a very limited capacity to carry additional sensors or systems. GBSAA systems can, of course, support a wide variety of unmanned aircraft. One advantage of GBSAA systems is that they are able to support UAS operations without any modifications to the unmanned aircraft.
The MATS was tested as part of the Smart Skies project using a specially equipped aircraft, which flew predetermined flight plans, and with other aircraft of varying shapes and sizes. The flight trial results show that the MATS is able to support UAS operations in non-segregated airspace within the NAS.
The flight trial results show that the local terrain can have an influence on the performance of GBSAA systems. As a result, some consideration must be given to the positioning of the system to achieve the desired surveillance coverage. Another aspect of the operating environment is the weather. The flight test results also demonstrated the ability of radars to monitor rainfall, which is useful information for UAS operations.
The military also has an interest in flying UAS in the NAS. This interest includes training, research and development and testing. The US Department of Defense has provided an incremental NAS Access Strategy that starts with line-of-sight operations [41]. The next step uses a GBSAA system to support terminal area operations. The subsequent steps all involve the use of GBSAA systems to support the UA transiting airspace. Thus, GBSAA systems are likely to be a key component of a layered approach to the integration of UAS into the NAS.
GBSAA systems can help to make a case for ‘file and fly’ UAS operations. These routine and regular operations will provide important experience with operating UAS in the NAS, a key ingredient for conducting civilian and commercial operations using unmanned aircraft.
Acknowledgements
I would like to thank the Smart Skies team for all their efforts during the project. In particular I would like to thank Mr Duncan Greer, Mr Rhys Mudford, Mr Scott NcNamara, Mr Ryan Fechney, Mr Chris Turner and Professor Rod Walker, who were the pilots and crew of the ASL and made an important contribution to the MATS. The constructive comments of all the reviewers were greatly appreciated. I would also like to thank Insitu Pacific Limited for making the MATS available during the Smart Skies project.
The expert advice of Mr Peter Rogers was also greatly appreciated.
This research is part of the Smart Skies Project and is supported, in part, by the Queensland State Government Smart State Funding Scheme.
References
1. ‘Comprehensive set of recommendations for sUAS regulatory development’, Small Unmanned Aircraft System Aviation Rulemaking Committee, April 2009.
2. ‘Civil aviation safety regulations 1998 (CASR) part 101, unmanned aircraft and rocket operations’, Civil Aviation Safety Authority (CASA), 2010.
3. R. Clothier, R. Walker, R. Baumeister, M. Brünig, J. Roberts, A. Duggan, and M. Wilson, ‘The Smart Skies Project’, IEEE Aerospace and Electronic Systems Magazine, 26, 14–23, 2011.
4. ‘Unmanned aerial vehicles roadmap: 2000–2025’, Office of the Secretary of Defense, April 2001.
5. M. DeGarmo, ‘Issues concerning integration of unmanned aerial vehicles in civil airspace’, Tech. Rep. MP 04W0000323, The MITRE Corporation, 2004.
6. ‘Annex 11 to the convention on civil aviation: Air traffic services’, International Civil Aviation Organization (ICAO), 2001.
7. ‘Limitations of the see-and-avoid principle’, Research Report ISBN 0 642 16089 9, Australian Transport Safety Bureau (ATSB), 1991.
8. C. Morris, ‘Midair collisions: Limitations of the see-and-avoid concept in civil aviation’, Aviation, Space, and Environmental Medicine, 76(4), 357–365, 2005.
9. J. W. Andrews, ‘Unalerted air-to-air visual acquisition’, Lincoln Laboratory, Massachusetts Institute of Technology, November 1991.
10. R. Wolfe, ‘NASA ERAST Non-Cooperative DSA Flight Test’, AUVSI Conference Proceedings, pp. 1–15, July 2003.
11. R. J. Kephart and M. S. Braasch, ‘Comparison of see-and-avoid performance in manned and remotely piloted aircraft’, Digital Avionics Systems Conference, vol. 25, pp. 4.D.2-1–4.D.2-8, May 2008.
12. ‘Pilots’ role in collision avoidance’, Advisory Circular 90-48C, Federal Aviation Administration, 1983.
13. K. Colvin, R. Dodhia, and R. Dismukes, ‘Is pilots’ visual scanning adequate to avoid mid-air collisions?’, Proceedings of the 13th International Symposium on Aviation Psychology, pp. 104–109, 2005.
14. ‘Introduction to TCAS Version 7’, Federal Aviation Administration, November 2000.
15. R. C. Matthews, ‘Characteristics of U.S. midairs’, FAA Aviation News, 40, 1–3, 2001.
16. ‘Review of midair collisions involving general aviation aircraft in Australia between 1961 and 2003’, Research Report B2004/0114, Australian Transport Safety Bureau (ATSB), May 2004.
17. J. N. Simon and M. S. Braasch, ‘Deriving sensible requirements for UAV sense-and-avoid systems’, Digital Avionics Systems Conference, DASC, pp. 6.C.4-1–6.C.4-12, October 2009.
18. A. Lacher, D. Maroney, and A. Zeitlin, ‘Unmanned aircraft collision avoidance – technology assessment and evaluation methods’, The 7th Air Traffic Management Research & Development Seminar, pp. 1–10, 2007.
19. D. Seagle, ‘NATO developments in UAS airworthiness and sense & avoid functional requirements’, International Council of the Aeronautical Sciences (ICAS), pp. 1–22, 2007.
20. ‘Sense and avoid (SAA) for unmanned aircraft systems (UAS)’, Federal Aviation Administration, October 2009.
21. A. Zeitlin, ‘Issues and tradeoffs in sense & avoid for unmanned aircraft’, IEEE Systems Conference, pp. 61–65, April 2010.
22. ‘Airspace integration plan for unmanned aviation’, Office of the Secretary of Defense, November 2004.
23. ‘Interim Operational Approval Guidance, 08-01, Unmanned Aircraft Systems Operations in the U.S. National Airspace System’, Federal Aviation Administration, AIR-160, 2008.
24. M. Contarino, ‘All weather sense and avoid system for UASs’, Report to the Office of Naval Research for R3 Engineering, 2009.
25. A. Lacher, A. Zeitlin, D. Maroney, K. Markin, D. Ludwig, and J. Boyd, ‘Airspace integration alternatives for unmanned aircraft’, AUVSI's Unmanned Systems Asia-Pacific, pp. 1–19, February 2010.
26. S. Hottman, K. Hansen, and M. Berry, ‘Literature review on detect, sense, and avoid technology for unmanned aircraft systems’, Tech. Rep. DOT/FAA/AR-08/41, Federal Aviation Administration, 2009.
27. Y. K. Kwag and C. H. Chung, ‘UAV based collision avoidance radar sensor’, International Geoscience and Remote Sensing Symposium, IGARSS, pp. 639–642, 2007.
28. B. Korn and C. Edinger, ‘UAS in civil airspace: Demonstrating “sense and avoid” capabilities in flight trials’, Digital Avionics Systems Conference, DASC, pp. 4.D.1-1–4.D.1-7, October 2008.
29. D. Longstaff, M. AbuShaaban, and S. Lehmann, ‘Design studies for an airborne collision avoidance radar’, Proceedings of the 5th EMRS DTC Technical Conference, pp. 1–9, 2008.
30. S. Kemkemian, M. Nouvel-Fiani, P. Cornic, and P. Garrec, ‘MIMO radar for sense and avoid for UAV’, Phased Array Systems and Technology (ARRAY), 2010 IEEE International Symposium, pp. 573–580, October 2010.
31. R. Carnie, R. Walker, and P. Corke, ‘Image processing algorithms for UAV “sense and avoid” ’, Proceedings of the 2006 IEEE International Conference on Robotics and Automation, pp. 2848–2853, 2006.
32. J. Lai, L. Mejias, and J. Ford, ‘Airborne vision-based collision-detection system’, Journal of Field Robotics, 28(2), 137–157, 2011.
33. ‘Standard Specification for Design and Performance of an Airborne Sense-and-Avoid System’, F2411-07, ASTM International, 2007.
34. B. Karhoff, J. Limb, S. Oravsky, and A. Shephard, ‘Eyes in the domestic sky: An assessment of sense and avoid technology for the army's “Warrior” unmanned aerial vehicle’, Proceedings of the 2006 Systems and Information Engineering Design Symposium, pp. 36–42, April 2006.
35. ‘Guidance Material on Comparison of Surveillance Technologies (GMST)’, Tech. Rep. Edition 1.0, International Civil Aviation Organization (ICAO) – Asia and Pacific, September 2007.
36. P. Howland and M. R. Walbridge, ‘ “What is the range of your radar?” and other questions not to ask the radar engineer’, IEE Colloquium on Specifying and Measuring Performance of Modern Radar Systems, pp. 3/1–3/9, March 1998.
37. P. Weber and T. Nohara, ‘Device and method for 3D height-finding avian radar’, US Patent 7,864,103 B2, 2011.
38. T. McGeer, ‘Safety, economy, reliability, and regulatory policy for unmanned aircraft’, Aerovel Corporation, pp. 1–9, March 2007.
39. M. R. Endsley, ‘Toward a theory of situation awareness in dynamic systems’, Human Factors, 37(1), 32–64, 1995.
40. M. R. Endsley, B. Bolte, and D. G. Jones, Designing for Situation Awareness: An approach to human-centered design. Taylor & Francis, London, 2003.
41. ‘Final Report to Congress on Access to National Airspace for UAS’, US Department of Defense, 2010.
42. C. E. Fossa, R. A. Raines, G. H. Gunsch, and M. A. Temple, ‘An overview of the IRIDIUM low Earth orbit (LEO) satellite system’, IEEE National Aerospace and Electronics Conference, pp. 152–159, 1998.
43. S. Pratt, R. Raines, C. Fossa, and M. A. Temple, ‘An operational and performance overview of the IRIDIUM low earth orbit satellite system’, IEEE Communications Surveys & Tutorials, 2(2), 2–10, 1999.
44. F. Gonzalez, R. Walker, N. Rutherford, and C. Turner, ‘Assessment of the suitability of public mobile data networks for aircraft telemetry and control purposes’, Progress in Aerospace Sciences, 47(3), 240–248, 2011.
45. G. Spence and D. Allerton, ‘Simulation of an automated separation management communication architecture for uncontrolled airspace’, AIAA Modeling and Simulation Technologies Conference, pp. 1–8, 2009.
46. T. Nohara, P. Weber, G. Jones, A. Ukrainec, and A. Premji, ‘Affordable high-performance radar networks for homeland security applications’, IEEE Radar Conference, pp. 1–6, 2008.
47. R. Baumeister, R. Estkowski, and G. Spence, ‘Automated aircraft tracking and control in Class G airspace’, International Council of the Aeronautical Sciences, pp. 1–13, 2010.
48. P. Weber, A. Premji, T. Nohara, and C. Krasnor, ‘Low-cost radar surveillance of inland waterways for homeland security applications’, IEEE Radar Conference, pp. 134–139, 2004.
49. ‘Minimum operational performance standards for 1090 MHz extended squitter Automatic Dependent Surveillance – Broadcast (ADS-B) and Traffic Information Services – Broadcast (TIS-B)’, December 2009.
50. D. Greer, R. Mudford, D. Dusha, and R. Walker, ‘Airborne systems laboratory for automation research’, International Council of the Aeronautical Sciences, pp. 1–9, 2010.
51. R. Baumeister, R. Estkowski, G. Spence, and R. Clothier, ‘Evaluation of separation management algorithms in Class G airspace’, AIAA Modeling and Simulation Technologies Conference, no. AIAA-2009-6126, pp. 1–14, 2009.
52. R. Baumeister, R. Estkowski, G. Spence, and R. Clothier, ‘Test architecture for prototyping automated dynamic airspace control’, Council of European Aerospace Societies (CEAS), European Air and Space Conference, pp. 1–14, 2009.
53. ‘Operations in the vicinity of non-towered (non-controlled) aerodromes’, CAAP 166-2, Civil Aviation Safety Authority (CASA), 2010.
54. M. Wilson, ‘A mobile aircraft tracking system in support of unmanned aircraft operations’, International Council of the Aeronautical Sciences, pp. 1–11, 2010.
55. J. Denford, J. Steele, R. Roy, and E. Kalantzis, ‘Measurement of air traffic control situational awareness enhancement through radar support toward operating envelope expansion of an unmanned aerial vehicle’, Proceedings of the 2004 Winter Simulation Conference, pp. 1017–1025, 2004.
56. R. Rollenbeck and J. Bendix, ‘Experimental calibration of a cost-effective X-band weather radar for climate ecological studies in southern Ecuador’, Atmospheric Research, 79, 296–316, 2006.
57. G. A. Pablos-Vega, J. G. Colom-Ustáriz, S. Cruz-Pol, J. M. Trabal, V. Chandrasekar, J. George, and F. Junyent, ‘Development of an off-the-grid X-band radar for weather applications’, IEEE International Geoscience and Remote Sensing Symposium (IGARSS), pp. 1077–1080, July 2010.
58. ‘Guidance Material on Issues to be Considered in ATC Multi-Sensor Fusion Processing Including the Integration of ADS-B Data’, International Civil Aviation Organization (ICAO), 2008.
59. ‘Unmanned Aircraft Systems (UAS). ICAO Circular 328’, International Civil Aviation Organization (ICAO), 2011.
1. The International Civil Aviation Organisation (ICAO) has adopted UAS instead of unmanned aerial vehicle (UAV) [59].
2. Speed limitations are not applicable to military aircraft.
5. http://www.kinetic-avionics.co.uk
6. http://www.airservicesaustralia.com/projects/ads-b/
7. http://www.insitu.com/scaneagle
8. Available from http://earth.google.com/
9. Available from www.globalmapper.com