
Chapter 2
Analyzing Content-Sharing Metrics
IN THIS CHAPTER
![]() Using standard analytics to evaluate content-sharing success
Using standard analytics to evaluate content-sharing success
![]() Evaluating internal metrics for blogs, videos, podcasts, and photos
Evaluating internal metrics for blogs, videos, podcasts, and photos
![]() Estimating ROI for content sharing
Estimating ROI for content sharing
You’ve built a blog, updated hundreds of photos, created a podcast, or shot a series of videos. You’ve nurtured and fed your effort with multiple posts and episodes. You’ve promoted your creative endeavor, and now you want to know how many people have visited, how engaged they were, and most of all, whether they shared your content with others, giving your efforts maximum exposure.
Developing good content is hard work. Like with any of your other marketing efforts, you need to understand your return on investment (ROI). In this chapter, we show you how to figure out your ROI and evaluate the effectiveness of your content-sharing social channels.
Measuring the Effectiveness of Content Sharing with Standard Analytics
If you use content as a marketing tool, how do you know whether your message is getting out there? How do you measure your results? How viral is your content? Are viewers or readers recommending your content to people other than those you reached directly through your own efforts? Your website stats reveal the most information, but you can also glean effective information from specific statistics for each type of content sharing.
Maximizing website stats
You can find an amazing amount of information about the effectiveness of your content simply by using the program that tracks your website statistics, whether that’s Google Analytics or any other program we mention in Chapter 1 of this minibook. Table 2-1 summarizes which of the primary content-sharing sites integrate with Google Analytics or offer their own.
TABLE 2-1 Analytics Availability on Content-Sharing Sites
Website |
URL |
Description |
Google Analytics Integration? |
Own Analytics Package? |
|---|---|---|---|---|
Image Sharing |
||||
Flickr |
Well-known photo-sharing site |
No |
No |
|
Popular app used to share photos and videos from mobile device on social media sites |
Yes |
Yes |
||
Share and collect photos on visual scrapbooks |
Yes |
Yes |
||
Video/Audio Sharing |
||||
Medium |
Write and share blog posts |
Yes |
Yes |
|
Spotify |
A digital music service where you can listen to millions of songs |
No |
Yes |
|
IBM Video Streaming |
Platform for live, interactive broadcast video |
No |
Yes |
|
Vimeo |
Created by filmmakers and videographers to share creative work; commercial accounts available on Pro version |
Yes |
Yes |
|
YouTube |
Well-known video sharing site |
Yes |
Yes |
|
Blogs |
||||
Blogger |
Google’s blog platform |
Yes |
Yes |
|
Tumblr |
Share text, photos, links, music, videos, and more |
Yes |
Yes |
|
Typepad |
Inexpensive blog platform |
Yes |
Yes |
|
WordPress.com |
Blog/website platform with hosting |
Yes |
Yes |
|
WordPress.org |
Blog/website platform without hosting |
Yes |
Yes |
|
 Perhaps the easiest solution is to install Google Analytics on every content-sharing platform for which it’s offered.
Review your general statistics to find the following types of information:
- The number of visitors who land on the home page of your blog or other content site: Watch for variations in the number and timing of visits, as well.
- The number of visitors seeking specific posts, videos, or podcasts: This information tells you that visitors found the post through an external link or perhaps a specific set of keywords in a search engine. Most analytics enable you to search content results to the page level.
- How visitors arrived at your content-sharing site: Someone might have used a search engine, entered the URL for your social-sharing presence, or linked from another website.
How long visitors remain on a specific post page: If the duration of a visit is shorter than the potential length of time spent reading the post and pondering its contents, the post wasn’t effective. You can infer the effectiveness of a post from the bounce rate.
 Capitalize on effective posts by creating similar posts. When you analyze your web statistics, you’ll know which posts are effective.
- The number of unique visitors to your content-sharing site compared to the number of visitors to your website: For example, content posts can consist of unique information about your products or services. The more unique visitors you have to specific content posts — or to your content, in general — the better your information is received. If your blog attracts more unique visitors than your site does, consider creating links in your blog posts to related information on your website. If your site receives more hits than your blog, add some links from the specific products or services you offer to blog posts about these specific items.
- The number of people who linked to your website from one of your content-sharing pages. The more people link from a content-sharing site, the more effective that channel is for your marketing.
- The geographical location of your content visitors: If the majority of visitors are from a country or an area other than your target market, change your message.
- The direction of traffic: After you have an established content-sharing presence, your traffic rate and number of incoming links to your website should increase. If they aren’t increasing, consider shaking things up a bit by offering different content. Look at which posts have been popular in the past. Expand on those topics or put a new spin on them, and carefully monitor the results.
- Which pages are most frequently used to enter or leave the site: If visitors are entering and exiting the home page and spending only a short length of time on your site, they’re skimming only one or two posts before getting out of Dodge. If you’re facing this situation, it’s time to rethink your message. Visitors entering your site on a specific page, however, have honed in on a specific post from either a search engine result or an incoming link. If you have a lot of these kinds of visitors and they’re spending a fair amount of time on your site and exiting from a different page, you have an effective content-sharing site.
Tracking comments
Beyond statistics, one of the most valuable ways to assess the success of your content-sharing sites is by tracking how many and what type of comments people leave. Look for the following information in the Comments section on blogs, YouTube, podcasts, and any other content-sharing sites that permit comments, reviews, rankings, or likes and unlikes.
Third-party social alert and monitoring sites may help you analyze comments for sentiment (an assessment of the positive or negative feelings found in comments). See Book 2, Chapter 3 for helpful tools to use when the number of comments becomes overwhelming.
Here are some metrics to watch when assessing comments:
- Number of comments on each blog post: This information is important if your goal is to stimulate interaction with potential customers. If certain blog posts are drawing more comments than others, the information in those posts is more relevant to your subscribers.
- Comment length: If you’ve written a lengthy post and you receive lengthy comments, you’ve struck a chord with subscribers and presented useful information. If comments are sparse, however, which indicates that you haven’t given your user-base food for thought, consider changing the nature of your posts or the type of information you post.
The tone of comments on your posts: If comments on the majority of your posts sound positive and you receive a lot of comments, you’re sending the right message. You can be somewhat controversial at times and stir up provocative comments, but unless you’re a shock jock, make it the exception and not the rule. If, on the other hand, the comments aren’t flattering, you know what you need to do.
If the number of comments for new posts is decreasing, you’re losing your audience — and you probably need to review your messages. Be sure that you’re inviting responses with an open question like, “What do you think?” You may need to provide explicit directions about where to click to make a comment.If you’re receiving comments on individual podcast episodes, people are downloading the podcast from your website rather than using a subscription. Analyze which episodes reward you with the most comments — and then include that type of information in future podcasts.
- Number of visitors versus the number of comments: If you have a fairly high ratio of comments to visitors, you’re creating interesting material that gets visitors thinking.
Evaluating Blog-Specific Metrics
Each of the primary blogging sites provides analytics information such as that seen in Figure 2-1. Blogger, WordPress, Tumblr, and Typepad all integrate with Google Analytics. However, Blogger (which is owned by Google) and Typepad (http://help.typepad.com/overview_and_stats.html) offer their own proprietary tools, in addition or as an alternative to Analytics. WordPress.com, the hosted version of this popular blog software, also offers its own statistical package at http://support.wordpress.com/stats.
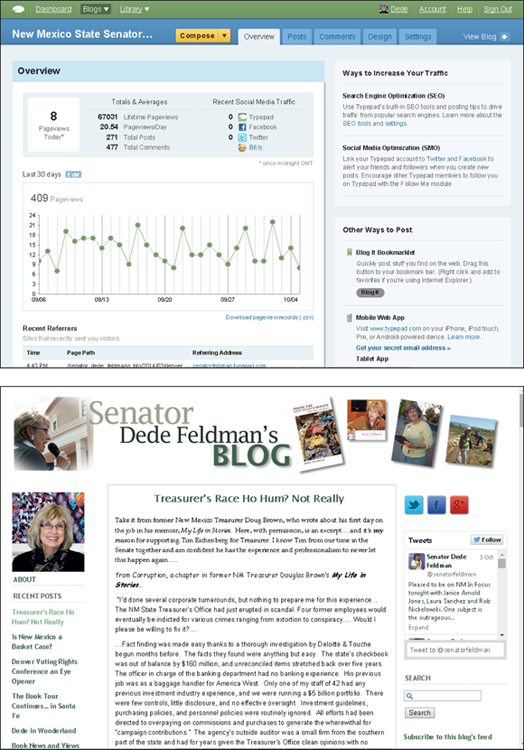
Reproduced with permission of Dede Feldman Co., Melody Mock, designer; Suzanne Prescott, manager
FIGURE 2-1: Typepad stats (top) for the blog run by former New Mexico State Senator Dede Feldman (bottom).
If your blog is your only online effort, internal statistics may be enough. However, if you want to be able to compare and contrast multiple components of your web presence, you need Google Analytics or another package.
Of course, you’ll watch for the number of incoming visitors in your blog dashboard. You also want to look at the number of people who have decided to follow you — by subscribing through the service, getting email notifications, or using RSS.
Visualizing Video Success
After you post a video to a third-party site (such as YouTube or Vimeo), you can look there for some stats about views, click-throughs, and more.
After logging into YouTube (using your Google credentials), type studio.youtube.com into the address bar and click the Analytics link in the left sidebar to get to the screen shown in Figure 2-2. The Overview tab shows how many subscribers you have, the total watch time your videos have gotten, and the total number of views for your channel.

FIGURE 2-2: Viewing statistics for YouTube videos.
In addition to the Overview tab, there’s a tab showing your channel’s Reach (impressions, CTR, traffic sources, and so on), Engagement (watch time, top videos listed by watch time, and so on), and Audience (when people are watching your videos, demographic information, other videos viewers have watched, and so on).
Clicking the See More link under any of the charts in the center of the page takes you to a screen with even more metrics you can use to determine how your channel and videos are performing (see Figure 2-3). Take some time to go through each of the screens to familiarize yourself with the available data.
Because YouTube is owned by Google, YouTube analytics have many of the same metrics as Google Analytics. In other words, the analytics data available to you are pretty robust and can tell you quite a bit about your audience. Best of all, it’s free!
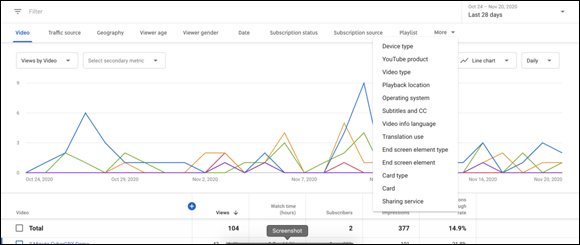
FIGURE 2-3: A plethora of metrics to gauge the performance of your video content.
On Vimeo, basic analytics are included, but to get more detailed information you have to upgrade to a paid account. To access the analytics data on your free account, hover your mouse over the Manage Videos link at the top of the screen and select Analytics from the drop-down menu. On your Vimeo analytics dashboard, you can see things such as how many views your videos got, the number of unique viewers, how many times viewers watched an entire video, geographical region, and average watch time.
To assess the performance of your video content, watch the following important metrics:
- Number of subscribers: At YouTube, you find this information in the left sidebar of your YouTube channel page. If you’re creating relevant videos, you should notice a steady increase in subscribers with each new video you upload.
- Growth in the number of subscribers: You should experience steady growth as you regularly add new videos to your channel. If you notice a significant spurt after you post a video, analyze its content to determine why the video caused the growth spurt. Chances are good that you did something different or found a topic of particular interest to your subscribers. If, on the other hand, you notice a decline in new subscribers or a decrease in subscribers after posting a video, figure out what you did wrong and refrain from posting similar videos.
- Average viewing time: If people are watching your videos all the way through, that’s a good indicator that they’re enjoying the content. If most viewers are dropping off a few seconds into a 30-second video, for example, you may want to take a closer look at that particular video to determine what the issue could be. Is it an interesting topic? Is it easy to understand? Is it entertaining? These are a few questions to keep in mind.
Engagement: Are people liking the video and leaving comments? Are they tagging friends in the comments to call attention to the video?
Always keep an eye on the comments section of your channel. Not only should you acknowledge comments (as appropriate), but you can also make sure people aren’t leaving spam comments or other inappropriate messages. If a person leaves a negative comment, use your best judgment before you delete it. Responding to negative comments shows your community that you’re listening and gives you an opportunity to clarify something or answer for something that may have been poorly communicated in the video. On the other hand, if the person leaving the comment is just being a troll and name-calling or cursing, go ahead and delete the comment.- Number of people viewing individual videos: You can find this information by visiting your dashboard. On Vimeo, you can see the number of plays for each video by scrolling down to the center of the page on your analytics dashboard and looking at the Most views and Most finishes sections. On YouTube, at the bottom of the Overview tab, a section lists all of the top videos along with how many views each got and the average view duration.
Understanding Podcast Metrics
Like with blogs, you need to watch several primary statistics on your podcasts:
- The number of people listening to your live podcast: This tells you the effectiveness of your marketing efforts. When you have a lot of visitors, you’ve created informative media that’s in demand.
- The number of streams and episode listen duration for your podcast: Streams tell you how many people pressed play on your podcast, and listen duration shows how long you can keep the attention of your average listener.
- The number of people who subscribe to and download your podcast: This measure of engagement indicates whether your content is helping you develop a loyal following of listeners.
- The number of people who rate your podcast highly or refer it to others or both: High ratings and referrals indicate that others are helping share your message.
Include a social media share button (see Book 2, Chapter 4) whenever possible to encourage your readers, viewers, and listeners to post the link to your material on their own social media pages.
Apple Podcasts is the most popular directory, accounting for around 55 to 60 percent of all podcast downloads, and the platform has a built-in analytics feature called iTunes Connect (itunesconnect.apple.com). The information available through iTunes Connect answers questions such as
- How many people are listening to the podcast?
- Are people skipping over your episode intro or any ads you have?
- How have the episodes (and podcast in general) been performing over time?
- Where are listeners located geographically?
For more information on Apple Podcasts and Podcasts Analytics, check out Apple’s documentation at https://itunespartner.apple.com/podcasts and at https://itunespartner.apple.com/podcasts/articles/check-your-podcast-performance-3071.
Measuring Your Results from Pinterest
When it first launched, Pinterest offered only the briefest of statistics on the number of boards, Pins, likes, followers, and following, running across the page horizontally below your header image, as shown in Figure 2-4.
Now Pinterest offers useful, private analytics that show how users interact with your Pins, your profile, and your website. You can also use Pinterest Analytics to find out more about the demographics of your audience.
To access Pinterest Analytics, you must first create a business account, as described in Book 7. From your business account, go to your profile page and click Analytics in the top menu bar, as shown in Figure 2-5.
You can easily convert a personal account that you’ve been using for your business into a business account, as described in Book 7.
After you’re in Analytics, the screen shown in Figure 2-6 appears, where clicking the drop-down menu under the Performance Over Time section lets you pull up a wealth of data about your Pins for the past 30 days, including impressions, engagements, and link clicks.
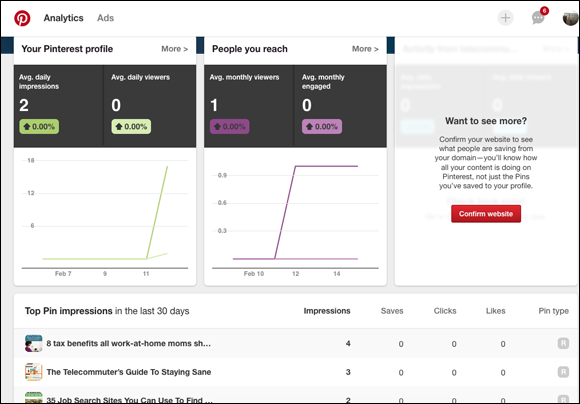
FIGURE 2-4: Basic statistics on Pins and followers were visible to everyone who visited your Pinterest site.

FIGURE 2-5: Access Pinterest Analytics from the menu bar on your business Profile page.
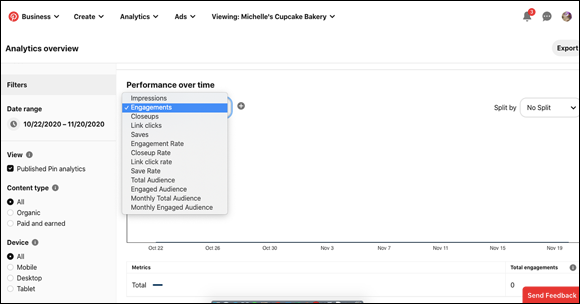
FIGURE 2-6: Pinterest’s analytics provide valuable information about users and how they interact with your Pins and profile.
The available metrics are
- Impressions: The total number of times your Pins were shown to viewers
- Engagements: The total number of engagements on your Pins including saves, closeups, link clicks, and carousel card swipes
- Closeups: The number of times people viewed a close-up version of your Pin
- Saves: The number of times people saved your Pins to a board
- Link clicks: The number of times people clicked on your Pin to be taken somewhere on or off of Pinterest
- Video views: The number of views for at least 2 seconds with 50 percent of the video screen shown
- Average play time: The average time spent watching your video
- Saves: The number of times people saved your video Pin to a board
- Link click rate: The number of video Pin clicks that drive to a destination, on or off Pinterest
- Played at 95%: The number of times your video was viewed to 95 percent of its length
- Total watch time: The total watch time for your video in minutes
- 10-second views: The number of times your video was viewed for at least ten seconds
For more information, see https://business.pinterest.com/insights/the-point and https://help.pinterest.com/articles/pinterest-analytics.
Finding out about your Pinterest audience
As with all marketing, it’s helpful to understand the demographics of your audience and to compare the demographics of Pinterest users to those of your desired target market and also to users on your other social media channels. After you log in and click the Analytics tab at the top of the page, select Audience Insights from the drop-down menu.
The Audience Insights page offers details about what your existing and potential customers are interested in, based on their behavior on Pinterest. You can view data from just your own page’s audience (just engaged audience or total audience), from Pinterest as a whole, or you can compare the two. Figure 2-7 shows audience information for all Pinterest users. Additional audience information is further divided into five sections: Categories and Interests (see Figure 2-7), Age, Gender, Location, and Device.
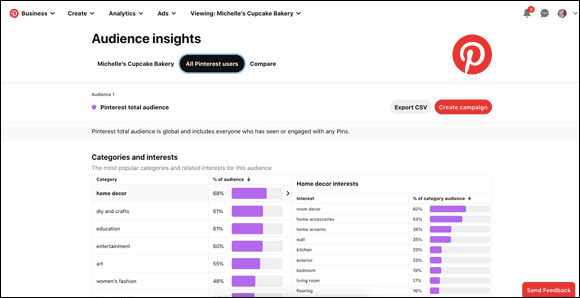
FIGURE 2-7: Gain more insights into your Pinterest audience.
Learning more details about what your audience is engaging with while on Pinterest can help you develop your Pinterest content strategy, because you’ll now have a better idea about the topics that will perform the best.
Third-party Pinterest analytics
In addition to the comparative data you find in the Social section of Google Analytics, you can obtain Pinterest information from Tailwind (www.tailwindapp.com/pinterest-analytics), a third-party provider of Pinterest tools.
As part of its Pinterest marketing and management suite, Tailwind measures the progress of Pins and boards over time, helping you assess the value of Pinterest in terms of ROI. It offers a free trial, with paid versions starting at $9.99 per month. Among its metrics, Tailwind allows you to do the following:
- Archive historical data.
- Analyze Pin performance by hashtag, keyword, board, or category, including changes in the performance of specific Pins over time.
- Compare the viral value and engagement levels of your Pinterest content against that of your competition.
- Integrate with Google Analytics.
- Analyze revenue and site traffic generated from Pinterest.
Look at referrers to your primary website in Google Analytics to compare how much traffic to your site comes from Pinterest or other image-sharing sites versus traffic that arrives from websites, other social media, advertising, or search engines.
Comparing Hard and Soft Costs versus Income
Smart business people don’t spin their wheels. If something doesn’t gain traction, they do something else. After analyzing the number of visitors that your content-sharing effort receives, consider your ROI to see whether the effort is really worthwhile. (For more on ROI, see Book 1, Chapter 2.)
Unless you’re selling your content, this is a subtle number to figure out. You need to derive sales results indirectly.
Remember to consider two types of costs in your evaluation:
- Hard: The number of man-hours needed to create content for your podcast, blog, photos, or videos. Also, the cost to host any media online, which would be web hosting fees and any fees you pay to a designer to get your media online. If you’re paying for premium video hosting such as Vimeo Pro, factor in this cost, as well.
- Soft: The amount of time you personally spend creating content. Did that time take you away from any other profitable activities, such as hobnobbing with the rich and famous, or other potential clients?
Include a question at your online checkout that asks buyers which forms of social media they use. If you aren’t using a social media network that attracts your customers, you may want to modify your social media efforts to see whether you can increase your business.