Chapter 2
Tallying the Bottom Line
IN THIS CHAPTER
![]() Estimating the cost of customer acquisition
Estimating the cost of customer acquisition
![]() Figuring sales metrics and revenue
Figuring sales metrics and revenue
![]() Managing and converting leads
Managing and converting leads
![]() Breaking even
Breaking even
![]() Calculating return on investment
Calculating return on investment
In this chapter, you deal with business metrics to determine whether you see a return on investment (ROI) in your social media marketing services. In other words, you get to the bottom line! For details on performance metrics for various types of social media as parameters for campaign success, see Book 9.
By definition, the business metric ROI involves revenues. Alas, becoming famous online isn’t a traditional part of ROI; it might have a public relations value and affect business results, but fame doesn’t necessarily make you rich. This chapter examines the cost of acquiring new customers, tracking sales, and managing leads. After you reach the break-even point on your investment, you can (in the best of all worlds) start totaling up the profits and then calculate your ROI.
To get the most from this chapter, review your business plan and financial projections. You may find that you need to adjust some of your data collection efforts to ensure that you have the information for these analyses.
 If numbers make your head spin, ask your bookkeeper or accountant for assistance in tracking important business metrics from your financial statements. That person can ensure that you acquire the right data, set up spreadsheets to calculate key metrics, and provide regular reports — and then he or she can teach you how to interpret them.
You don’t want to participate in social media marketing for its own sake or because everyone else is doing it. The following sections help you make the business case for yourself.
Preparing to Calculate Return on Investment
To calculate ROI, you have to recognize both costs and revenue related to your social media activities; neither is transparent, even without distinguishing marketing channels.
Surprisingly, the key determinant in tracking cost of sales, and therefore ROI, is most likely to be your sales process, which matters more than whether you sell to other businesses (business-to-business, or B2B) or consumers (business to consumer, or B2C) or whether you offer products or services.
The sales cycle (the length of time from prospect identification to customer sale) affects the timeline for calculating ROI. If a B2B sale for an expensive, long-term contract or product takes two years, expecting a return on your investment within a month is pointless.
For a pure-play (e-commerce only) enterprise selling products from an online store, the ROI calculation detailed in this chapter is fairly standard. However, ROI becomes more complicated if your website generates leads that you must follow up with offline, if you must pull customers from a web presence into a brick-and-mortar storefront (that method is sometimes called bricks-and-clicks), or if you sell different products or services in different channels. Table 2-1 provides resource sites that relate to these issues and other business metrics.
TABLE 2-1 Resources for Business Metrics
Site Name |
URL |
What You Can Do |
|---|---|---|
Hootsuite |
|
Measure social media success. |
Harvard Business School Toolkit |
Use the break-even analysis tool. |
|
Calculate lifetime customer value. |
||
National Retail Federation |
Research, news, and white papers from the NRF’s digital retail community. |
|
Olivier Blanchard Basics of Social Media ROI |
|
View an entertaining slide show introduction to ROI. |
Accounting for Management |
|
Target profit sales calculator. |
HubSpot |
Calculate customer acquisition costs. |
|
Infineca |
|
Set up Google Analytics to measure social media ROI. |
Search Customer Experience |
Find information about the customer experience. |
|
WhatIs |
Search a dictionary and an encyclopedia of IT-related business terms. |
 Include the business metrics you intend to monitor in the Business Goals section of your Social Media Marketing Plan, found in Book 1, Chapter 3, and the frequency of review on your Social Media Activity Calendar discussed in Book 1, Chapter 4.
Accounting for Customers Acquired Online
The customer acquisition cost (CAC) refers to the marketing, advertising, support, and other types of expenses required to convert a prospect into a customer. CAC usually excludes the cost of a sales force (the salary and commissions) or payments to affiliates. Some companies carefully segregate promotional expenses, such as loyalty programs, that relate to branding or customer retention. As long as you apply your definition consistently, you’re okay.
If your goal in social media marketing is branding or improving relationships with existing customers, CAC may be a bit misleading, but it’s still worth tracking for comparison purposes.
The definition of your customers and the cost of acquiring them depend on the nature of your business. For example, if you have a purely advertising-supported, web-only business, visitors to your site may not even purchase anything. They simply show up, or perhaps they register to download some information online. Your real customers are advertisers. However, a similar business that’s not supported by advertising may need to treat those same registrants as leads who might later purchase services or pay for subscriptions.
The easiest way to define your customers is to figure out who pays you money.
Comparing the costs of customer acquisition
You may want to delineate CAC for several different revenue streams or marketing channels: consumers versus businesses; products versus services (for example, software and support contracts); online sales versus offline sales; and consumers versus advertisers. Compare each one against the average CAC for your company overall. The formula is simple:
customer acquisition cost = marketing cost ÷ number of leads
Be careful! This formula can be misleading if you calculate it over too short a time frame. The CAC may be too high during quarters that you undertake a new activity or a special promotion (such as early Christmas sales or the introduction of a new product or service) and too low during quarters when spending is down but you reap benefits from an earlier investment in social media.
Calculate your CAC over six months to a year to smooth out unique events. Alternatively, compute rolling averages (taking an average over several months at a time, adjusting the start date each month — January through March, February through April, March through May, and so on) to create a better picture of what’s going on.
In Figure 2-1, Rapport Online ranks the return on investment, defined as cost-effectiveness in generating leads, for a variety of online-marketing tactics. The lowest ROI appears at the bottom of the cube, and the highest appears at the top.

Courtesy of Rapport Online Inc., ROI
FIGURE 2-1: Social media would fit near the top of the ROI scale for Internet-marketing tactics.
Social media marketing runs the gamut of rapport-building options because it involves some or all of these techniques. On this scale, most social media services would probably fall between customer referral and SEO or between SEO and PR/link building, depending on the type and aggressiveness of your effort in a particular marketing channel. Traditional offline media, by contrast, would have a lower ROI than banner advertising.
As with performance metrics, business metrics such as CAC and ROI aren’t perfect. If you track everything consistently, however, you can at least compare results by marketing channel, which can help you make informed business decisions.
If you garner leads online but close your sales and collect payments offline, you can frame CAC as the cost of lead acquisition, recognizing that you may need to add costs for staff, collateral, demos, travel, and other items to convert a lead.
To put things in perspective, remember that the traditional business school model for offline marketing teaches that the CAC is roughly equivalent to the profit on the amount a customer spends during the first year.
Because you generally see most of your profits from future sales to that customer, you must also understand the lifetime customer value (how much and how often a customer will buy), not just the revenue from an initial sale. The better the customers, the more it’s worth spending to acquire them. Harvard Business School offers an online calculator for determining lifetime customer value at http://hbswk.hbs.edu/archive/1436.html.
 Be sure that the cost of customer acquisition (CAC) doesn’t exceed the lifetime customer value.
Try to keep the total cost of marketing by any method at 6 percent to 11 percent of your revenues; you can spend less after you have an established business with word-of-mouth referrals and loyal repeat customers. Remember, customer acquisition is only part of your total marketing budget; allow for customer retention and branding expenses as well.
Small businesses (fewer than 100 employees), new companies, and new products usually need to spend toward the high end of the scale on marketing initially — perhaps even more than 11 percent. By comparison, mature, well-branded product lines and companies with a large revenue stream can spend a lower percentage on marketing.
Obviously, anything that can reduce marketing costs offers a benefit. See whether your calculation bears out that cost level for your investment in social media.
One is silver and the other gold
You might remember the words to that old Girl Scout song: “Make new friends but keep the old; one is silver and the other gold.” To retain customers, apply that philosophy to your policy of customer satisfaction. That may mean anything from sending holiday greetings to establishing a loyalty program with discounts for repeat buyers, from entering repeat customers into a special sweepstakes to offering a coupon on their next purchase when they sign up for a newsletter.
A marketing truism states that it costs anywhere from 3 to 30 times more to acquire a new customer than to retain an existing one. (For details, see www.linkedin.com/pulse/what-cost-customer-acquisition-vs-retention-ian-kingwill.) Although costs vary with each type of business, it’s common sense to listen to customers’ concerns, complaints, product ideas, and desires.
Thus, while you lavish time and attention on social marketing to fill the top of your funnel with new prospects, don’t forget its value for improving relationships with current customers and nurturing their involvement with your brand.
Establishing Key Performance Indicators for Sales
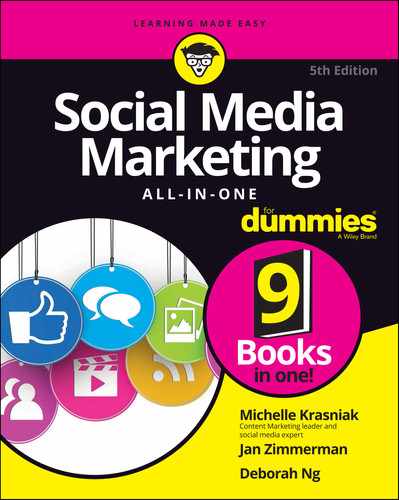
If you track ROI, at some point you must track revenue and profits as business metrics. Otherwise, there’s no ROI to compute. Unlike the previous emphasis on social media for customer engagement, recent statistics show a rapid increase in social commerce (direct sales from social media), as shown in Figure 2-2. According to data from Statista, social commerce sales in the United States is expected to quadruple in the next five years, from $22 billion in 2019 to $84 billion in 2024.
If you sell online, your storefront should provide ways for you to slice and dice sales to obtain crucial data. However, if your sales come from services, from a brick-and-mortar store, or from large contractual purchases, you probably need to obtain revenue statistics from financial or other external records to plug into your ROI calculation.
If you manage a bricks-and-clicks operation, you may want to integrate your online and offline operations by selecting e-commerce software from the vendor who provides the point-of-sales (POS) package for your cash registers. That software may already be integrated with your inventory control and accounting packages.
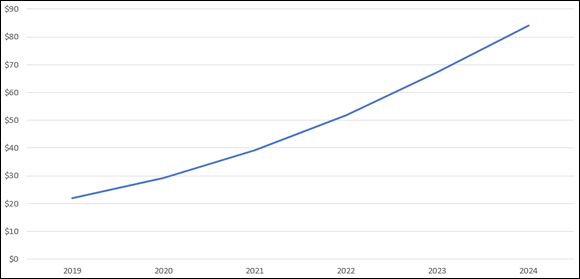
FIGURE 2-2: Social commerce revenues will grow rapidly over the next five years (in billions).
Just as with performance metrics, you should be able to acquire certain key performance indicators (KPI) for sales by using storefront statistics. Confirm that you can access this data before purchasing your e-commerce package:
- You should be able to determine how often customers buy (number of transactions per month), how many new customers you acquire (reach), and how much they spend per transaction (yield).
- Look for sales reports by average dollar amount as well as by number of sales. Plugging average numbers into an ROI calculation is easier, and the results are close enough as long as the inputs are consistent.
- You should be able to find order totals for any specified timeframe so that you can track sales tied to promotions, marketing activities, and sale announcements.
- Look for the capability to sort sales by new and repeat customers; to allow for future, personalized offers; and to distinguish numbers for CAC.
- Your sales statistics should include a conversion funnel (as described in Chapter 1 of this minibook). Try to trace the path upstream so that you can identify sales initiated from social media.
- Check that data can be exported to a spreadsheet.
- Make sure that you can collect statistics on the use of promotion codes by number and dollar value so that you can decide which promotions are the most successful.
- Having store reports that break down sales by product is helpful. Sometimes called a product tree, this report shows which products are selling by SKU (stock keeping unit) and category.
Table 2-2 lists some storefront options that integrate with social media and offer sales analytics. Unfortunately, not all third-party storefront solutions offer ideal tracking. Many storefront solutions use Google Analytics, shown in Figure 2-3, to track transactions.
TABLE 2-2 Social Media Store Solutions Offering Sales Statistics
Name |
URL |
Type of Sales Stats Available |
|---|---|---|
Google Analytics ECommerce Tracking |
|
Google Analytics for e-commerce. |
Ecwid |
Integrated storefront that works on social media, mobile, and blog sites. |
|
ProductCart |
Google Analytics integration at the product level. |
|
Shopify |
Offers its own reports as well as integration with Google Analytics, Facebook pixel, and Pinterest tag. |
|
BigCommerce |
Social commerce platform that works with Instagram, Facebook, Pinterest, as well as eBay, Amazon, and Google Shopping. |
|
3dcart |
E-commerce platform that is a one-stop shop for creating an online store. It connects with Facebook, eBay, Amazon, and other channels. |
As the value of social media for generating sales has grown, many social media channels have improved their tracking options for sales completed on a website. In addition to Facebook’s long-offered conversion pixel, Pinterest now has a tag code tool and Twitter generates conversion code for placement on a “thank-you” page at the conclusion of a purchase.
If you created alternative SKUs for products sold by way of social media for tracking, be sure to merge them into the same category of your product tree. Using multiple SKUs isn’t recommended if your storefront solution includes inventory control.
You can input the numbers from your social media sales metrics into a sales calculator to forecast unit sales needed to meet your goals. Figure 2-4 shows a calculator from AccountingforManagement.org at www.accountingformanagement.org/target-profit-sales-calculator. Users enter values for the variables in the fields at the top of the image and click Calculate; different forecasts appear below the fields.

Courtesy of SEOReseller.com
FIGURE 2-3: Typical e-commerce statistics available on Google Analytics.

Courtesy of AccountingforManagement.org
FIGURE 2-4: Target Profit Sales calculator from AccountingforManagement.org.
Tracking Leads
Often, your social media or web presence generates leads instead of, or in addition to, sales. If your sales process dictates that some or all sales are closed offline, you need a way to track leads from initiation to conversion. Customer relationship management (CRM) software helps you track prospects, qualified leads, and customers in an organized way. A simple database might allow different managers, salespeople, and support personnel to share a client’s concerns or track the client’s steps within the selling cycle.
The process of CRM and lead management may also include qualifying and nurturing leads, managing marketing campaigns, building relationships, and providing service, all while helping to maximize profits. Table 2-3 lists some lead-monitoring and CRM software options.
TABLE 2-3 Lead-Monitoring and CRM Software
Name |
URL |
What You Can Do |
Cost |
|---|---|---|---|
HubSpot |
All-in-one software; manage inbound leads, lead generation, and more. |
Free 14-day trial; starts at $40 per month after free trial |
|
Freshsales |
|
Lead scoring, phone, email, activity capture, and more. |
Free 14-day trial; starts at $19 per month after free trial |
SplendidCRM |
Install open source CRM software. |
Options range from free open source download to unlimited use for $960 per user |
Although often thought of as the province of B2B companies offering high-ticket items with a long sales cycle, lead-tracking tools can help you segment existing and prospective customers, improve the percentage of leads that turn into clients, and build brand loyalty.
Understanding Other Common Business Metrics
Your bookkeeper or accountant can help you compute and track other business measurements to ensure that your business turns a profit. You may want to pay particular attention to estimating your break-even point and your profit margin.
Break-even point
Computing the break-even point (the number of sales needed for revenues received to equal total costs) helps determine when a product or product line will become profitable. After a product reaches break-even, sales start to contribute to profits.
To calculate the break-even point, first you need to figure out the cost of goods (for example, your wholesale price or cost of manufacturing) or average variable costs (costs such as materials, shipping, or commission that vary with the number of units sold) and your fixed costs (charges such as rent or insurance that are the same each month regardless of how much business you do). Then plug the amounts into these two formulas:
- revenues – cost of goods (variable) = gross margin
- fixed costs ÷ gross margin = break-even point (in unit sales)
Figure 2-5 shows this relationship. This graph of the break-even point shows fixed costs (the dashed horizontal line) to variable costs (the solid diagonal line) to plot total costs. After revenues surpass the break-even point, each sale contributes to profits (the shaded area on the right).

FIGURE 2-5: The break-even chart plots fixed plus variable costs; each sale after the break-even point contributes to profits.
The break-even analysis tool from the Harvard Business School Toolkit (http://hbswk.hbs.edu/archive/1262.html) can also help you calculate your break-even point.
Profit margin
Net profit margin is defined as earnings (profits) divided by revenues. If you have $10,000 in revenues and $1,500 in profits, your profit margin is 15 percent (1500 ÷ 10000 = 0.15).
Revenue versus profit
One of the most common errors in marketing is to stop analyzing results when you count the cash in the drawer. You can easily be seduced by growing revenues, but profit is what matters. Profit determines your return on investment, replenishes your resources for growth, and rewards you for taking risks.
Determining Return on Investment
Return on investment (ROI) is a commonly used business metric that evaluates the profitability of an investment or effort compared with its original cost. This versatile metric is usually presented as a ratio or percentage (multiply the following equation by 100). The formula itself is deceptively simple:
ROI = (gain from investment – cost of investment) ÷ cost of investment
The devil is, as usual, in the details. The cost of an investment means more than cold, hard cash. Depending on the type of effort for which you’re computing ROI for an accurate picture, you may need to include the cost of labor (including your own!), subcontractors, fees, and advertising. When calculating ROI for your entire business, be sure to include overhead, cost of goods, and cost of sales.
You can affect ROI positively by either increasing the return (revenues) or reducing costs. That’s business in a nutshell.
Because the formula is flexible, be sure that you know what other people mean when they talk about ROI.
You can calculate ROI for a particular marketing campaign or product, or an entire year’s worth of marketing expenses. Or compare ROI among various forms of marketing, comparing the net revenue returned from an investment in social media to returns from SEO or paid advertising.
Run ROI calculations monthly, quarterly, or yearly, depending on the parameter you’re trying to measure.
Try the interactive ROI calculator at www.clickz.com/website-optimization-roi-calculator, which is also shown in Figure 2-6. You can modify this model for social media by treating Monthly Site Visits as social media visits, Success Events as click-throughs to your main site, and Value of Success Events as the value of a sale. See what happens when you improve the business metric (the value of a sale) instead of, or in addition to, improving performance (site traffic or conversion rate).
Courtesy of ClickZ.com
FIGURE 2-6: Play around with variables, such as the value of a sale, and performance criteria.
ROI may be expressed as a rate of return (how long it takes to earn back an investment). An annual ROI of 25 percent means that it takes four years to recover what you put in. Obviously, if an investment takes too long to earn out, your product — or your business — is at risk of failing in the meantime.
If your analysis predicts a negative ROI, or even a very low rate of return over an extended period, stop and think! Unless you have a specific tactical plan (such as using a product as a loss leader to draw traffic), look for an alternative effort with a better likelihood of success.
Technically, ROI is a business metric, involving the achievement of business goals, such as more clicks from social media that become sales, higher average value per sale, more repeat sales from existing customers, or reduced cost of customer acquisition.
Many people try to calculate ROI for social media based on performance metrics such as increases in
- The amount of traffic to website or social media pages
- The number of online conversations that include a positive mention of your company
- References to your company versus references to your competitors
- The number of people who join your social networks or bookmark your sites
- The number of people who post to your blog, comment on your Facebook page, or retweet your comments
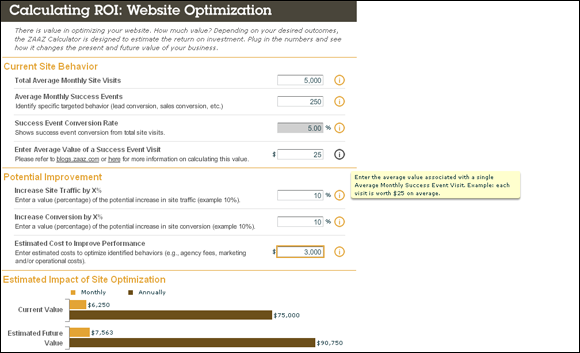
These measurements may be worth monitoring, but they’re only intermediate steps in the ROI process, as shown in Figure 2-7.
Source: BrandBuilder, “Olivier Blanchard Basics of Social Media ROI”
FIGURE 2-7: The relationship between performance metrics and business metrics for ROI.
Here’s how to calculate your return on investment:
Establish baselines for what you want to measure before and after your effort.
For example, you may want to measure year-over-year growth.
Create activity timelines that appear when specific social media marketing events take place.
For example, mark an event on an activity timeline when you start a blog or Twitter campaign.
- Plot business metrics over time, particularly sales revenues, number of transactions, and net new customers.
Measure transactional precursors, such as positive versus negative mentions online, retail store traffic, or performance metrics.
For example, keep a tally of comments on a blog post or of site visits.
- Line up the timelines for the various relevant activities and transactional (business) results.
- Look for patterns in the data that suggest a relationship between business metrics and transactional precursors.
Prove those relationships.
Try to predict results on the basis of the patterns you see, and monitor your data to see whether your predictions are accurate.
Improvement in performance metrics doesn’t necessarily produce better business results. The only two metrics that count toward ROI are whether your techniques reduce costs or improve revenue.