
Visual Studio 2010 has great testing features and management tools for testing. These features are greatly improved from previous versions of VS. The Test Impact View is the new test management tool added to the existing tools such as Test View, Test List Editor, Test Results, Code coverage Results, and Test Runs from the main IDE.
Team Explorer is the application tier that is integrated into Visual Studio to connect the source control tool, Team Foundation Server. Using this explorer, the developer can browse through the Team Projects in the TFS. TFS is the central source control repository for managing and controlling Team Projects. From Team Explorer IDE, we can connect to the Team Foundation Server, and the Team Project collection, and Team Project. After connecting to the server, we can use Team Explorer to browse through the details of the Team Project.
Team Explorer provides features to work with Team Project details such as:
- Accessing project process guidance documents that explain the process to be followed for the Team Project such as work items, reports, queries, and work products.
- Managing work items such as tasks, defects, issues, and requirements.
- Importing and exporting work items.
- Accessing the project files and source code.
- Adding, removing, configuring, and managing Team Projects.
- Creating, managing, and automating project builds.
- Managing favorites which are the shortcuts to the favorite node of the Team Project.
- Managing reports. It could be defect reporting or any type of work items reporting.
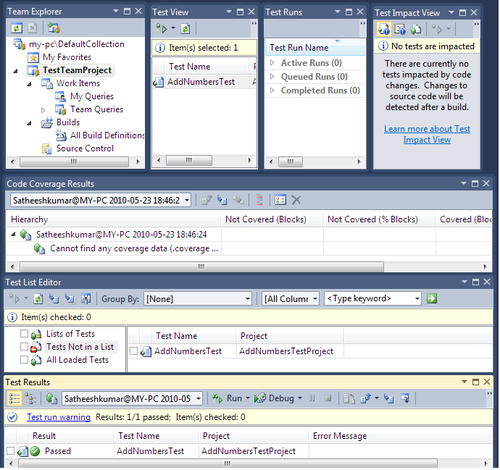
Visual Studio 2010 provides many tools to create, run, debug, and view results of tests. The following is an overview of the tools and windows provided by Visual Studio to view test details and test output details. We will look into more details of the actual usage of these tools later, in Chapter 9,
Let us see how we can create a new test project using Visual Studio 2010 and then we will test a sample project to get to know the tools and features.
Open Visual Studio 2010 and open the solution. We will not go into the details of the sample application AddNumbers now but we will just create a test project for the sample application and see the features of the tools and windows. The application referred to throughout this chapter is a very simple application for adding two numbers and showing the result.
In the same way as adding the projects and code files to the solution, we have to create the test project and test files, and add the test project to the solution. There are different ways of creating test projects under the solution:
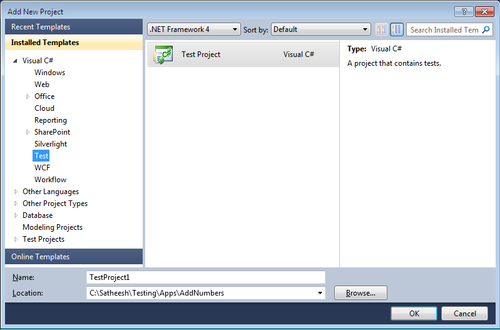
- Select the solution and add a project using the Add | New Project.... Then select the project type as Test from the list of project types under the language which we are going to use. Then select the template as Test Project.
- Select the solution and then from the top toolbar menu option select the option Test | New Test.... This will list all the test type templates to offer the type of template we need for the testing. You can see the option which is a dropdown saying Add to Test Project with the options as list of
<projectnames>, Create a new Visual C# test project…, Create a new Visual Basic test project..., and three more options.
For our sample testing application, we will select the second option mentioned previously and choose the simple Unit Test type.
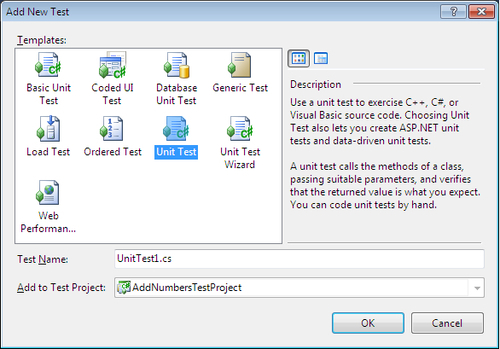
The Add New Test dialog contains nine different template options for creating tests. Unit testing templates consist of four types, one is a basic unit test, the second one is Database unit test, the third for the general unit test, and the fourth is for using Unit Test Wizard. The following are the file extensions for each of the VS test types shown in the preceding image:
.vbor.csis for all types of unit tests and coded UI tests.generictestis for the Generic test type.loadtestis for a test which is of type Load Test.webtestis for Web Performance Testing
After selecting the test type, give a name for the test in the Test Name field. Select the Create new Visual C# test Project… in the Add to Test Project option. Now assign a name for the new test project. Let us name it AddNumbersTestProject.
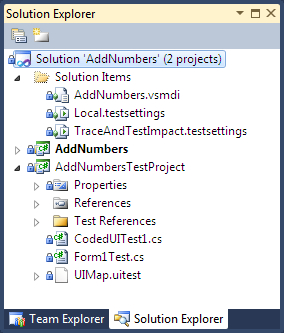
Now we can see that there are two files created,<ProjectName>.vsmdi, which is the metadata file, and the Local.testsettings file created under the solution items for the test projects. The metadata file is an XML file which contains all the information about the tests list. Let us add a couple more tests to this test project to run different tests using the tools available.
Now let us see the different windows and tools that support all the tests that we can execute using Visual Studio. We will walk through the tools by using the sample unit test.
Visual Studio 2010 provides the Test View window to view the list of all tests available in the current solution. Test View provides the option to change the column display, grouping of tests based on test properties, search for specific tests from the list, and select and run the test from the list as well. The test view window is available under the Test | Windows menu option in Visual Studio IDE. The following screenshot shows a sample of the Test View window which displays the list of all tests created in the current solution:
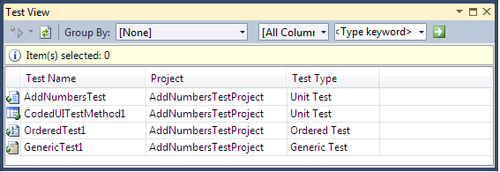
The Test View window has its own toolbar for the multiple operations that can be performed on the list. The leftmost option in the toolbar is the run and debug option with which we can start and debug the selected tests in the list.
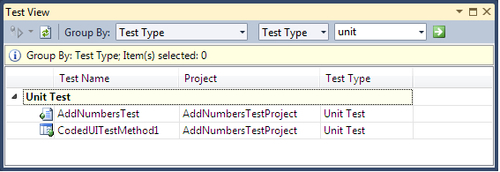
The second and third options in the toolbar are for Filtering the list by choosing the column from the dropdown and entering matching text in the keyword area. When you submit filter conditions using the button to the right, the list gets filtered and only the test matching the condition is shown. For example, the following screenshot shows the list of tests filtered with Test Type as Unit Test:
The third option in the toolbar is to group the lists based on some common property of the tests. Clear the above selected filters to list all available tests.
Now select any of the values available from the Group By dropdown.
On selecting a value from the dropdown we can see the list regrouped based on the type selected.
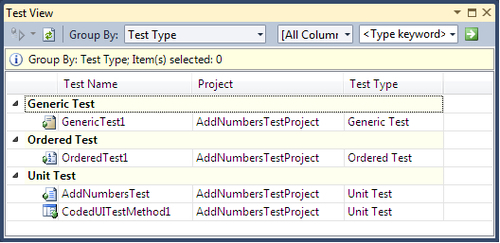
The following screenshot shows the tests grouped by Test Type. There are two unit tests, one Generic test, and one Ordered test.
The following screenshot shows the tests grouped by Class Name. The Ordered test and Generic test do not have class names as they are not derived from any class and do not have a class.

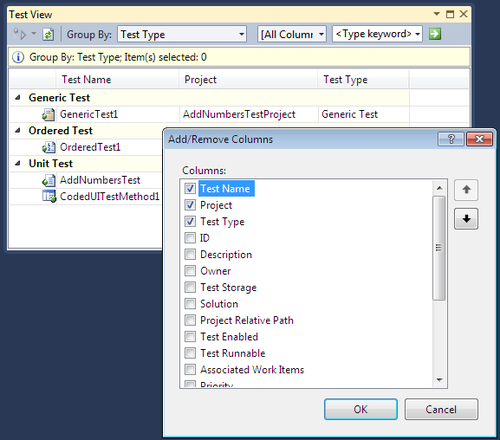
In Test View, we can customize the display of columns and the sorting of these columns:
- Right-click on the columns that are available in the Test View window, and select the Add/Remove Columns option and the Add/Remove Columns dialog box gets displayed.
- Check and uncheck the columns based on the columns that are needed on the display.
To change the sorting order of the list, just click on the column header. If the same column is already sorted then the sorting order will be changed.
All features available in Test View are also available in the Test List Editor with some additional features such as creating new Test Lists by selecting multiple tests from the available list of tests.
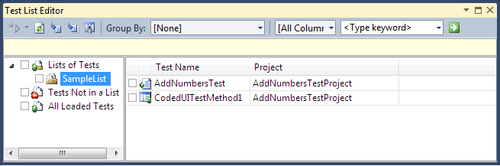
The following screenshot is the Test List Editor opened using the menu option, Test | Windows | Test List Editor. The editor shows all available tests under All Loaded Tests:

The toolbar in the Test List Editor window has the same features as we saw in the Test View window. But you can see the detail section of the list window is split into two panes. The left pane of the window has three nodes and the right pane displays all the tests in the lists based on the selection in the left pane. The Test List editor displays the following three options as nodes:
- List of Tests displays the available Test Lists and acts as an interface to create a new Test List
- Tests Not in a List is the second option, which provides all the tests which are not part of any of the Test Lists
- All Loaded Tests is the third option, which provides the list of all the tests in the solution whether the test is part of any list or not
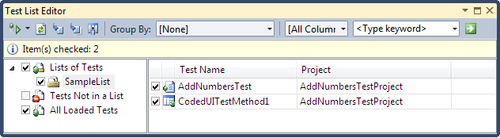
The following screenshot contains a Test List which contains a couple of tests selected from the available list of all tests in the solution. You can right-click on the node and select the Create New Test List option and provide the required details to create the new Test List.
After creating the Test List and adding the required tests to the corresponding list, you may want to check the tests that are not part of any of the list. The screenshot here shows the second option of displaying the tests not part of any of the list:

Now we know that there are tests which are part of a Test List and some are not part of any List but how can we see all of the available tests under the solution? To get this, you have to choose the third option, All Loaded Tests, from the Editor window.
By listing all tests from the solution we can also move the tests around from one list to another, or remove the test from any list, or add tests to a new list.
This window provides the status of all test runs including the error messages and an option to rerun the test irrespective of whether it passed or failed. Using this window, we can export the test results or import the exported results. We can also get detailed information about the test run by double-clicking on the test result. Select the unit test and Coded UI test from Test View or Test List Editor and run the tests.
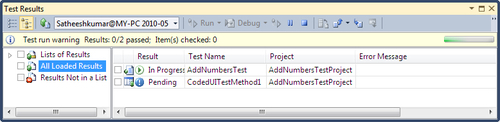
The following screenshot shows the different stages of test runs in the result window. From the following image we see that the first test is still in the process of test execution and the second test is pending execution.
The following image shows the final execution status of the selected tests. One test executed successfully and the other test failed. The error message for the failed test is also displayed. We can also select a test from the result window and rerun a test. This would be very useful in executing a failed test.

To get more information such as the detailed error message, the stack trace of the error, the time duration of the test run, and other details, just double-click on the test result which will open a new window with more details.
On execution of any test in VS, a test result file is created with all the test result information. The file is automatically created with the username and the machine name with date and the extension .trx . In the preceding image the name for the test result file is generated as Satheeshkumar@MY-PC 2010-05-25 23_24_32. The test result file is an XML file with all the result information. The following screenshot shows the default folder structure and the files created for the test results:

In the case of multiple test runs and multiple tests, we sometimes need the test to be stored somewhere or to keep the copy of the test run trace for future analysis of the test, or we may prefer sharing the result with another team member. In that case we can use Export Test Run Results or Export Selected Test Results from the toolbar which exports the entire trace file for the tests selected.
Visual Studio provides this code coverage feature to find out the percentage of code that is covered by the test execution. Through this window, we can find out the number of lines covered in each method by the test. To activate the code coverage for the test project, the test settings have to be changed. This is a little bit different from VS 2008. To configure the test project, open the local.testsettings file and select the Data and Diagnostics option from the list of settings options.

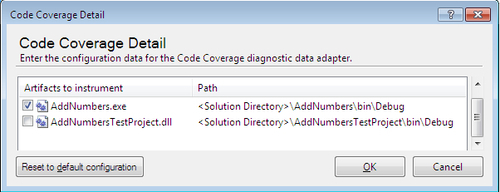
Choose Code Coverage from the list of diagnostics and enable it. You can see that the Configure option on top of the list is enabled now. Click on Configure to open the Code Coverage Detail page which would lists all the projects and artifacts available under the solution. Choose the required artifacts from the list for which the code coverage has to be captured during the test run. Apply the settings and close the window.
After completing the configuration, select the test from the Test View/List Editor and run the test. The test run will capture the code coverage and store the coverage result in a separate file with the default name of data.coverage.
Select the tests run result from the results window and then right-click and choose the code coverage results or open this using Test | Windows | Code Coverage Results from the menu option. The following screenshot shows the code coverage results from the test run. The result window provides information such as number of code blocks not covered by the test, percentage of code blocks not covered, covered code blocks, and percentage of covered code blocks from the selected assembly.
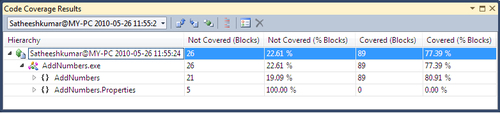
The result window also provides an option to directly open the source code associated with the listed blocks, and methods to easily navigate and fix.
There are several types of configuration and settings used for testing an application in VS 2010 and each type of test uses its own type of file to store the test related information.
- Test Metadata file: This file stores the tests and lists of categories for the tests in an XML format under the file with the extension
.vsmdi. Whenever you create a new test project, this file is created under theSolution Itemsfolder. The file name is the same as the solution name. - Test Results file: This file contains the results of the tests that were run. This file is created automatically by Visual Studio when any test is run. It has the extension of
.trx - Test Run Configuration file: This file contains the settings required for the test run. Using these settings we can define the Data and Diagnostics information to be collected during the test run, deployment files, scripts for setup and cleanup activities before and after the test runs, and the required settings for the Web and unit test runs. This file is created under the solution with the extension
.testsettings. - There are other XML files for different test types with some specific extensions such as
.webtest, .loadtest, .orderedtest, and.generictest.