
We have seen different types of testing methods and run the tests using Visual Studio 2010. Previous chapters explained different ways of running the tests and looking at the test results through the Test Results and the Test Run window. The Test View window, Test List Editor, and the Solution Explorer window are used for maintaining the tests. The test result summary window displays the selected test result after the test run. But how do we get the collective information about all the tests run based on some specific parameters? Visual Studio 2010 Integrated with Team Foundation server 2010 provides built-in reports to get collective information on all the tests runs. There are several other reports to get information about work items, Team Project builds, and the task level status of the project. These reports are very useful to study and analyze the project quality and status at any point in time.
TFS comes with different process templates that can be used for the team project. Each process template in TFS contains a number of predefined reports. The Team Project is the central place for data to store multiple projects. The data store maintains all the information about projects including source code, build details, and tests. Team Explorer is the user interface to get details about work items, test results, and builds.
Team Foundation Server and Visual Studio 2010 integrate with the SQL Server 2008 Reporting/Analysis Services to create and manage reports. SQL Server is the default data store used by TFS 2010 to maintain all information about the projects including the source code, tests, reports, documents, and build information. Whenever a new Team Project is created, a set of predefined reports from the selected process template is created and viewed under the Reports folder in Team Explorer. All these reports can be customized based on the requirement. Alternatively, we can also create new reports and share these with the other projects.
Creating reports for Team Projects can be done by using any tool that connects to a Relational database or Analysis database. It could be Microsoft Excel or Visual Studio Report Designer. Excel is easier to use, but provides less functionality when compared to the Report Designer. Some of the important features provided by the Report Designer are:
All these reports can be exported or printed. The reports can be exported in different formats such as XML, CSV, TIFF, Acrobat (PDF), and Excel. There is a print option that comes along with the report to print the current report result for the selected parameters.
TFS has several built-in reports readily available for the selected process template. Some of these reports are specific to defects and some are specific to testing while some others are common to work items. The names and format of reports have been modified in Visual Studio 2010 compared to its older version. The following sections explain a couple of out of the box reports available in TFS
This report is used to track progress in bug status such as new bugs, resolved bugs, and closed bugs. The report shows the cumulative count of the bugs based on priority, Severity and State of the bugs.
Bugs are the list of defects found during the test run or code compilation or during the build. All these defects can be added as work items of type Bug to the team project under TFS. There are different parameters to the work item such as the iteration, area, priority, triage, description, title, and other additional details for the defect. Every time the defect is modified, a history is maintained. The first time the defect is added, the status becomes active. Whenever the defect is fixed, the developer can change the status to resolved so that the tester can test the defect in the next deployment of the application and change it to closed or reopened based on the test result. All these activities are tracked and a history is maintained in the SQL Server by TFS. The details for the defects can be filtered using the start and end dates, iteration and area paths, bug state, and priority and severity.
This report is very useful to see status such as how soon the defects are getting fixed and tested, the priority of defects being fixed and closed, the defects count based on severity and priority, and the module which is getting the most defects which helps us to see the quality of work.
The report provides a detailed graphical view by plotting the number of active, closed and resolved defects against a timeline. At any point in time, the report shows the total count of defects based on the state.
The other pie chart provides the Active bugs by Priority or Severity with the legends that show the priority/severity values.
Active/Resolved Bugs by Assignment is the horizontal bar chart that provide the total bugs assigned to the team members and the total bugs resolved by the team members.
This report is very useful to track the progress in case of projects having multiple iterations. This report provides the graphical view of the number of stories closed, Progress in hours for each iteration, and then the number of Bugs per iteration. To get accurate reports, the project team should plan the Iterations, User stories, Iterations, Area, and defect logging in such a way that everything is tracked on time.
The number of stories denotes the user stories which are closed.
The Progress in hours shows horizontal bars which depicts the Original estimate, completed hours, and then the hours remaining based on the roll up of hours defined for tasks. The tasks are created during the project schedule and the tasks include the duration and start and end date planned for the completion of the tasks. This report is based on the task allocation and the tasks planned for each iterations.
The bug with the numeric value and bar charts denotes the number of active, resolved, and closed defects within each iteration for the project.
These reports help us to see the health of the project at any time. For example, an unhealthy project is one in which the user stories were not closed within the iteration or if there is a wide difference between the estimated and completed hours or number of defects and defect rate is not decreasing after multiple Iterations . But a healthy project would be the one with better progress on all of the iterations and within the estimated schedule.
These are the list of reports readily available for getting the project status and the quality:
- Bug Status Report—this report provides the total bug count based on the severity, priority, and state, to track the progress of resolving and losing bugs.
- Bug Trends Report—this report is used for tracking the bugs which are discovered and resolved over time. This is very useful in the case of bigger teams working towards discovering new bugs and resolving and closing the bugs.
- Reactivations Report is used to determine how effectively the team is fixing the bugs. Reactivation refers to reopened bugs, which are resolved or fixed prematurely.
- Build Quality Indicators Report is used to collect the test coverage, code churn, and bug counts for a specific build. This is helpful to see the quality of the build before releasing the code.
- Build Success over Time Report summarizes the build and test results for a set of build definitions for one or more projects over time. The reports provide day wise information for Build failed, Build Succeeded with No tests, Test Failed, Test passed with Low coverage, and Build Passed.
- Build Summary Report provides information about test results, test coverage, code churn, and other details of each build.
- Burndown and Burn rate Report—Burndown shows the trend of how much work has been completed and how much remains over a period of time. Burn rate specifies the rate at which the work is completed and the required rate for the remaining work.
- Remaining Work Report is useful to track the progress of work and identify if the task completion is on track or if there is any delay.
- Stories Overview Report lists all user stories and how much work each story requires. Also provides the completed work status, status of tests for the story, and bugs raised against each story.
- Stories Progress Report shows the status and progress of tasks defined to implement the story.
- Unplanned Work determines the work that is added at a later point to the iteration after the start of the iteration. This type of work is called unplanned work because the work and tasks are planned before the start of the iteration. The work could be a new requirement, or new test case, or any type of new work item.
- Test case readiness report how many test cases are defined and ready to execute.
- Test plan progress report is used to determine how much of the testing is complete and how much is remaining. Also provides information on how many tests are passed, failed, and blocking. This report is useful to find out if the testing would complete on time or not.
Visual Studio has the in-built report wizard to create a report definitions file associated with report viewer control. The wizard provides the steps to create report definition by specifying report data and organizing the data in row and column groups in a tablix data region, so select a layout format and choose a style.
Open Visual Studio 2010 and select file | new | project which opens the project templates. Select the reports application from the reporting templates, which opens the report wizard:

- The first step is to define the dataset to use from the data source. The wizard provides the list of all data sources such as Database, Service, Object, and SharePoint. Select the required data source and continue. Database is the source for this example.
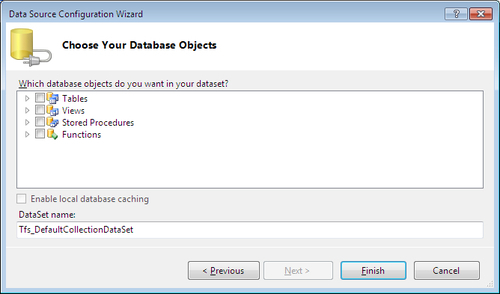
- The Next step is to select the database model which could be a Dataset or Entity Data Model. Select Dataset and continue the wizard. Select or create a new connection for the dataset and continue. Select the Database objects from the database after successful connection, such as TestResult table and then provide a name for the dataset.
- The next step in the wizard is Arrange fields to arrange fields into row groups, column groups, and detail rows for the tablix data region. Based on the row and column groups, the tablix region displays the data in the grid layout.

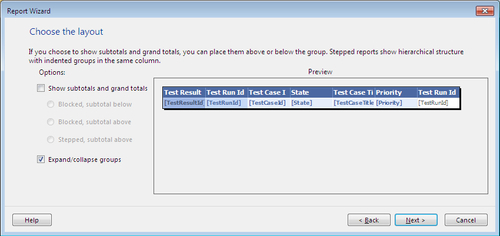
- The next step in the wizard is choosing the layout for the report. The layout defines the place where the totals, subtotals, and aggregates should be shown in the report.
- The final step is to define the style for the report. Select any specific style from the list of available styles.

After selecting the style, the report is created and added to the project. Run the project to see the result. The report wizard is flexible to create reports according to requirements.

The report can be modified however you want it by dragging and dropping the fields from the Dataset and by defining the layout.