
After completing all requests recording, click on the Stop option in the Web Recorder pane which will stop recording and close the browser window. Now you can see the WebTest editor window open and the recording details in the WebTest editor.

The editor shows the tree view of all the requests captured during recording. This editor also exposes the different properties of requests and the parameters for each request. We can set not only the properties, but also the Extraction and Validation rules using this editor. There are different levels of properties that we can set using the WebTest editor on the recorded requests:
- Properties at WebTest root level, which applies to the entire Web Performance Test, for example, setting the user credentials and giving a description to the test.
- Request level properties that apply to individual requests within the web test. For example, we can set the timeout, think times, and recording results properties on each request level.
- Properties for a request parameter apply to the requests using HTTP-POST or HTTP-GET protocol. Each parameter in the request contains parameters such as URL encodes, value, and name.
- Setting the extraction and validation rules for the responses to make sure the request gets the expected results and that they are validated.
Apart from all these the Web Performance Test editor has a toolbar that provides different functionalities such as running the test, adding a new data source, and setting the credentials and parameters, which are explained in detail in the coming sections.
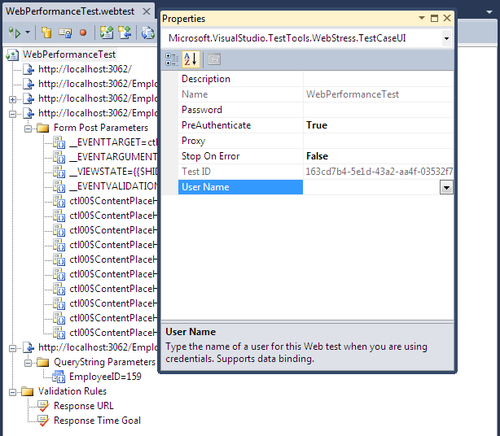
The following are the different Properties of the WebTest that we can set using the editor:
|
Property |
Description |
|---|---|
|
Description |
To specify the description for the current test |
|
Name |
Name of the current WebTest application |
|
User Name |
This is to specify the username of the user for this test, if we are using a user credential; we can also associate this with a data source of any type such as CSV file, XML file, or a Database |
|
Password |
This field is useful in the case of the use of any specific credentials for the test; this is the password for the username specified in the Username field |
|
PreAuthenticate |
This is a Boolean filed, which indicates whether the page has to be authenticated on every request or not; only if this property is set to true, the authentication header is sent for each request, otherwise headers are sent, if required; the default is True |
|
Proxy |
In some cases, the requested web pages in the test might be outside the firewall which has to go through the proxy server; so we can use this field to set the proxy server name to be used by the test |
|
Test ID |
This is the unique ID to identify the test; this ID is auto generated when we create the test; this can be used to define the test in a coded Web Performance Test; this property gets the unique identifier when implemented in the derived class |
|
Stop On Error |
This is useful to inform the application whether to stop the test or continue in case of any errors; if this value is true, the execution of the complete test will stop in the first occurrence of the error; the default is True. |
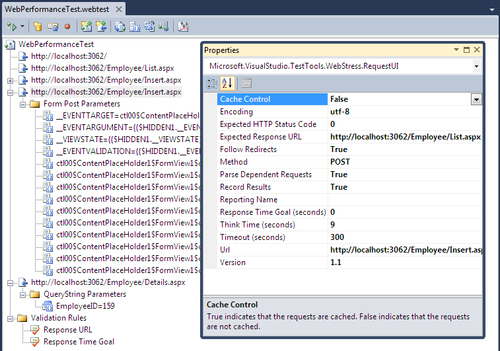
The following are the properties of the requests within the Web Performance Tests. If you select any request from the tree view and open the properties, you can find these properties for each request:
|
Property |
Description |
|---|---|
|
Cache Control |
This property is to simulate the caching property of the web pages. The value can be true or false. If it is set to true, it means that caching is turned on, which means that the dependent requests are retrieved only once for subsequent requests. For example, an image file used in all the web pages is retrieved from the source only once and kept in cache and re-used for all further requests. If we turn caching off, then the dependent requests are retrieved from the source for every web page request. If it is an image, then the same image file will be retrieved for every request even though it is the same image. This property is very useful when testing performance by turning the caching on and off. Based on the performance we can see whether to cache the data or not. This property is set to the main request but not to dependent requests of the main requests. An image embedded within the web page is one of the best examples of a dependent request. The default value for this property is False. |
|
Encoding |
This is defaulted to utf-8 as most of the HTTP requests are utf-8 encoding. It can be changed if we need a different encoding for the texts. |
|
Expected HTTP Status Code |
We can set this to the expected status code for the request. For example, if we don't want this request to be found on the server then we set this value to 404. The error code 404 denotes that the resource cannot be found. The default is set to 0 which returns pass if the return status is in the 200 or 300 range and returns fail if the return status is in the 400 or 500 range. |
|
Expected Response URL |
This is set to the final URL response that we expect after the current request and redirects, if any, are made. This is to validate the response. The expected response is validated using the validation rule. |
|
Follow Redirects |
This is set to true or false based on whether we want to allow the page redirects made by the request to follow or not. If set to true, then the request continues to its redirected web page and verifies if the status is the code entered for Expected HTTP Status Code. If it is false, the redirects are not followed. For example, if the value of the Expected HTTP Status Code is set to any value between 200 and 300, and the Follow Redirects is set to True, then the end result status of the request after all redirects should be a success. Status code with 200 or 300 level is a pass while status level with 400 or 500 is a failure. |
|
Method |
This property is used to set the request method used for the current request. It can either be GET or POST. |
|
Parse Dependent Requests |
This property can be set to True or False to parse the dependent requests within the requested page. For example, we may not be interested in collecting the details for the images loaded in the web page. So we can turn off the requests for loading images by setting this to False. Only the main request details will be collected. We should not get confused with this property and the Cache control property. Cache is to disable the dependent requests after caching the first occurrence of the request, but this property is to completely switch off the dependent requests or to completely turn them on. |
|
Record Results |
This is a Boolean value which can hold true if the performance data has to be collected for this HTTP request. It is false if the data is not required to be collected |
|
Response Time Goal(Seconds) |
There are situations where users need the application to respond quickly without any delay. To test this scenario, we can set this property to the expected maximum response time and then test the pages to find out the ones which do not meet the requirement. This value is specified in seconds. The default value is 0, which means the property is not set |
|
Think Time(Seconds) |
This is set for the think time required by a user between pages. This is not the exact time that the user can spend thinking, but is a rough estimation. Also, this property is not very useful for the normal single user Web Performance Test. This is very useful in the case of a Load Test where we can predict the load including the think time of the user between the pages. The recorder automatically records the think times at the same time as recording the test |
|
Timeout (Seconds) |
This is the expiry time for the request. This is the maximum time for the request to respond back. If it doesn't return within this limit, then the page gets timed out with an error. |
|
Version |
This is to set the HTTP version to use for the request, which can be 1.0 or 1.1. The default is 1.1 which is the normal or the latest of the HTTP versions. |
|
Url |
This is the URL address for the request. |
Each request in the Web Performance Test has its own properties, and there may be many dependent requests for each main request. We can get and set some properties even at the dependent request level. This is based on the request submit method GET or POST used for the request. We can set the values for the parameters used in the request. Also, there are some validation rules and extraction rules that can be used to extract the information from the request response.
These are the parameters sent along with the request if the method used for the request is POST. All field entries made by the user in the web page are sent to the server as Form POST Parameters. After recording we can check the actual values of the parameters that were sent during the request.
- Name denotes the name of the component used for collecting the data.
- Recorded Value is the value entered by the user during recording. This is a read-only field which is assigned while recording.
- URL Encode determines whether the Name and Value of the parameter should be URL encoded or not. The default is True.
- Value is the actual parameter value which should be used during testing. Initially, it is set to the same value as the recorded value, but the user can change it. This property also has the flexibility to be bound to a different data source such as a Database or XML file or a CSV File. This is very useful in the case of testing for different sources of information and multiple test runs with different sets of data. The next section covers more on how to add the new data source and point to the fields.
In the following screenshot, the Middle Name field was not entered by the user before submitting the form, so it contains nothing. The tester can change the parameter value by selecting the form parameter property and changing the value field.

Sometimes, there are additional properties based on the type of control we use on the web page. In that case, we may have to set those properties as well. For example, if we use the File Upload control, we may have to set the type of file that can be uploaded.
This is very similar to Form POST Parameters. These query string parameters are listed under the request which uses the QueryString method for the request.

The properties and the usage of QueryString Parameters are the same as Form Post Parameters properties, except for an additional property which is Show Separate Request Result. This property is used for grouping the requests based on the value of this query string parameter. This is very useful when Load Testing for grouping a bunch of requests based on this field value. The default is False.
Extraction rules are useful for extracting data or information from the HTTP response. Normally in any web application, the web forms are interdependent. This means that the request is based on the data collected from the previous request's response. Each request from the client in the web receives some kind of response from the server with the expected data within it. The data from the response has to be extracted and then passed on to the next request by passing the values using query strings or values persisted in the ViewState object, or using Hidden fields.
In previous examples, we used the new employee creation page where the user can enter details to create new employee details, or the user can select the employee from the list page and get the employee details displayed, or select the emergency contacts or absence details for the employee. In this case, once the user selects a particular employee from the list, we have to validate the user and pass on the user information to the next absence.aspx or emergencycontacts.aspx page where the absence details and emergency contact details are displayed.
This validated user information is hidden somewhere in the request using ViewState or Hidden fields. In this case, we can use the extraction rules to extract the user information and pass it on to the next request, or to further requests. We can extract the information and store it in the context parameter and use it globally across all requests following this.
Visual Studio 2010 provides several built-in types of extraction rules. This helps us to extract the values based on the HTML tags or different type of fields available in the web form. If we need additional extraction behavior, which is not supported by the existing one, then we can go for the custom rules. The following are the existing Extraction rule types.
|
Rule Type |
Description |
|---|---|
|
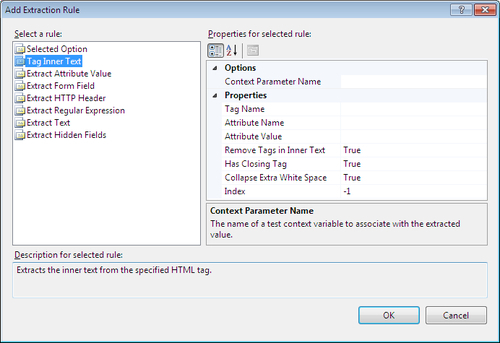
Tag Inner Text |
To extract the inner text from the specified HTML tag. We can use the attribute name and value parameters to find the exact match of the attribute and then find the inner text from the matching attribute. |
|
Extract Attribute Value |
This is to extract the attribute value from the request page based on the tag and the attribute name; we can also use the optional matching attribute name and value within the same tag to find out the required attribute easily; the extracted value will be stored in the context parameter |
|
Extract Form Field |
This is to extract the value from one of the Form fields in the response; the field name is identified here |
|
Extract HTTP Header |
This is to extract the HTTP message header value in the response page |
|
Extract Regular Expression |
This extracts the value using the regular expression to find the matching pattern in the response |
|
Extract Text |
This is to extract the text from the response page; the text is identified based on its starting and ending value with text Casing as optional |
|
Extract Hidden Fields |
This extracts all hidden field values from the response and assigns them to the context parameter |
The screenshot below shows the sample image added to the employee maintenance web pages. The image source is highlighted in the following screenshot of the code:

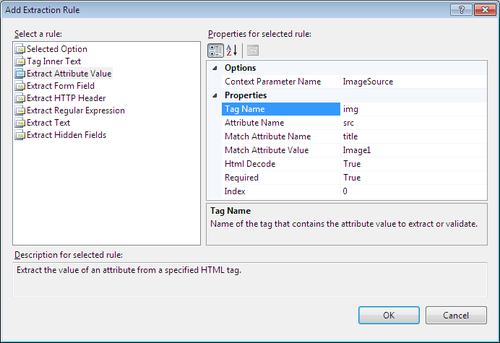
Now let us add an extraction rule for the image that we have for the employee maintenance web pages. The following screenshot shows how to set the properties of the Extraction Rules. This extraction rule is created for a sample HTML image used on the page. The extraction rule type is an Attribute Value rule to find the image source URL used for the image.
We can add as many rules as we want, but should make sure that the Context Parameter Names are unique across the application. It is like a global variable used in the application, which is referred to in all the forms.
By default, Visual Studio adds extraction rules for hidden fields automatically. The references to the hidden fields are also automatically added to the Form POST Parameters and Query String Parameters.
For coded Web Performance Tests we can create a custom extraction rule by deriving from the ExtractionRule class.
Every application has some sort of validation done on the input and output data, for example, a valid e-mail address, a valid username without any special characters, or a valid password which is not less than six letters. All these validations are performed using the validation rules against the fields as per expectation.
Validation rules are simply defining criteria which the information contained in the response has to pass through. All the data collected from the response is validated against the set of defined rules. If it passes it means that the response is validated, otherwise the test fails. For example, if the user has to enter a specific value or if the user has to select a value from a set of values then we can define these validations as rules and use them against the values returned in the response fields.
Visual Studio 2010 provides a set of predefined rules for validations. These rules are used for checking the text returned by the response.
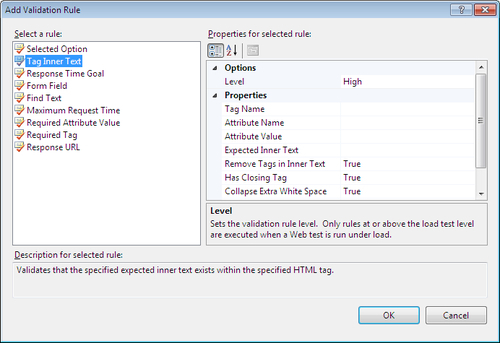
To add the validation rules, just right-click on the request and select the Add Validation Rule option which opens the validation rules' dialog. Select the type of validation rule required and fill in the parameters required for the rule.
|
Validation Rule Type |
Description |
|---|---|
|
Selected Option |
Validates that the specified option in the HTML 'select' tag is selected. The parameters are: Select Tag Name Expected Selected Option Index Ignore Case |
|
Tag Inner Text |
Validates if the specified expected inner text exists within the specified HTML tag |
|
Response Time Goal |
Validates if the response time for the request is less than or equal to the response time goal as specified on the request |
|
Form Field |
The existence of the form field name and value is verified using this; the parameters are: Form Field Name Expected Value |
|
Find Text |
This is to verify the existence of a specified text in the response; the parameters used for this are: Find Text Ignore Case Use Regular Expression Pass If Text Found |
|
Maximum Request Time |
This is to verify whether the request finishes within the specified maximum request Time Max Request Time (milliseconds) |
|
Required Attribute Value |
This is similar to the attribute used in the Extraction rules; in extraction rules we just extract the value of the specific attribute using the tag and the other attribute within the tag; but here in validation rules, we use the same tag to find out whether the attribute is returning the expected value; the parameters used here are the same as the ones used in extraction rules with an additional field to specify the expected value. The properties are: Tag Name Attribute Name Match Attribute Name Match Attribute Value Expected Value Ignore Case Index The index is used here to indicate which occurrence of the string to validate; if the index is set to -1, then it checks any form field value in the form and passes the test if any one match is found |
|
Required Tag |
To verify if the specified tag exists in the response; we can also set the minimum occurrence if there is a chance of getting the same tag many times in the response; the parameters are: Required Tag Name Minimum Occurrences |
|
Response URL |
This is to verify whether the URL is the same as the Expected URL; the property is the level for the response URL; the level can be High, Medium, or Low |
We can keep adding as many number of validation rules as we want, but as the number grows, the performance or the time taken for the test will also grow. So we should decide which one is the most important for Load Testing. These rules will affect the time taken for the test.
In all the above rule types, we have a special parameter known as the Level that can be set to Low, Medium, or High. As mentioned earlier, the Load Test performance is affected directly by the number of validation rules we have. So to control the execution of rules in a request during the Load Test, we can use the Level property. The level does not mean the priority for the rule, but it defines when it should get executed based on the Load Test property. The Load Test also has properties of Low, Medium, or High.
Based on the following Load Test property, the rules with the corresponding levels will get run during the Load Test:
- Low—All validation rules with level Low will be run
- Medium—All validation rules with level Low and Medium will be run
- High—All validation rules with level Low, Medium, and High will be run
Based on the importance of the Load Test, we can set the properties of the rules.
We will see more details about this in the chapter which talks about Load Test
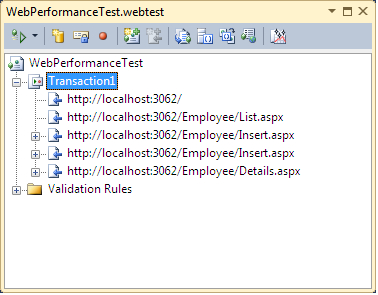
Transactions are very useful when grouping a set of activities. In this case, we can group a set of requests so that we can track the total time taken for this set of requests for our analysis. This is also helpful in collecting the timing of the individual requests.
We simply need to state the starting request and the ending request for the transaction so that all the requests in between will be part of the transaction, including these two requests.
To add a transaction, select the starting request and right-click and choose the Insert Transaction option.

The Transaction dialog requires a name for the transaction and then the requests for the first item and the last item of the transaction. When you choose both and say OK, the transaction is added before the first item is selected for the transaction and all the other requests between the first and last item including the first and last are part of the transaction as shown here:
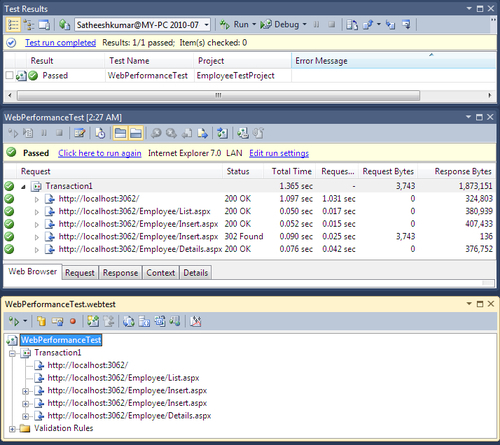
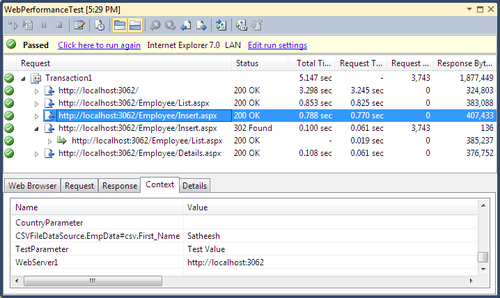
So when the test is run you can see the total time taken for all the requests under the transaction.
The web test editor has a toolbar to work on the Web Performance Tests. There are different options such as adding a data source, setting credentials, adding more requests recording, adding plug-ins to the test, generating code, parameterizing web servers, and creating the performance session for the test.
We have seen the Form POST parameters and QueryString parameters and how to set the values of the parameters using the property. Now, each and every time we test the application, we have to change the property. In the case of load or web performance testing, it is difficult and time consuming to test for more users. To automate the process, we can directly link the parameters to the available data from a different data source.
Visual Studio supports different types of data sources such as CSV, SQL Server database, XML File, Access, Excel, and any other database using the OLE DB provider connection.
To add a new data source:
- Select the Add Data Source button from the Web Test editor toolbar which opens the New Test Data Source Wizard.
- Name the data source and select the type of data source (Database, CSV, XML File, and so on).
- If you select the database, you can create a new connection using either OLE DB, ODBC, SQL Server, or the Oracle data provider. For our example here, select the CSV file as the data source and in the next screen select the CSV file from the file location.
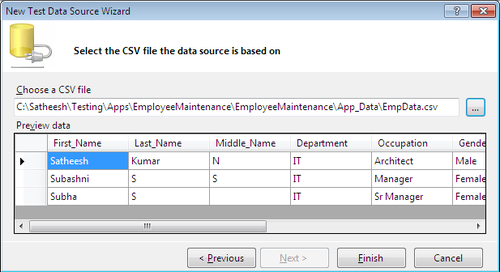
- Once you select the file you can see the data in the Preview data grid.
- Select OK to see the data source added to the test project.
You can add any number of data sources based on the requirement and on the sources of data we have for testing.
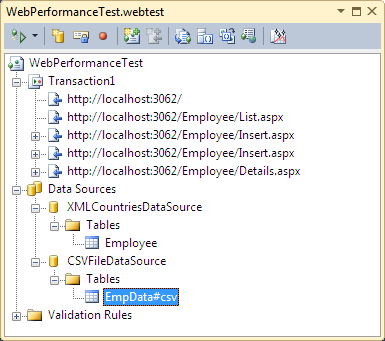
The following screenshot shows two data sources, CSVFileDataSource is for new user data and XMLCountriesDataSource is for the list of countries for the user.
Once the data source is ready, we can change the source of the Form Post or QueryString properties. To do this, select the Form Post Parameter under the request, then right-click and choose Properties. In the Value property, select the data source and select the field from the data source.
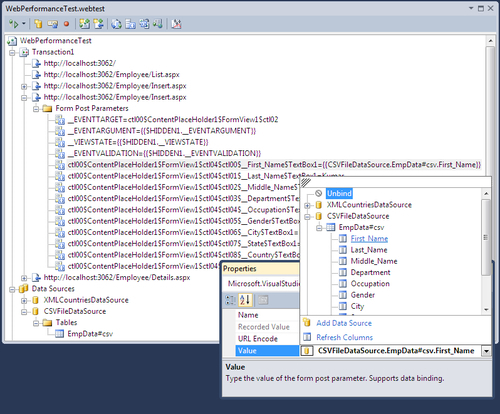
You can see the value assigned to the form post parameters. It is pointing to the field in the selected data source as in: {{CSVFileDataSource.EmpData#csv.First_Name}}
At runtime, this field is replaced with the exact value extracted from the CSV file and the test runs successfully.
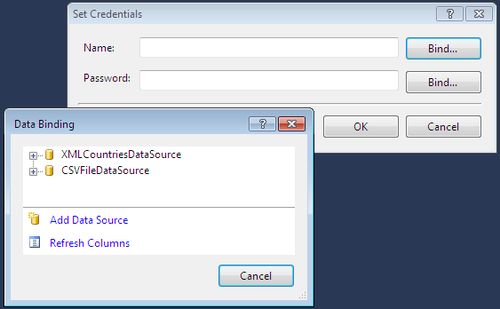
This is useful for setting other user credentials to be used for the test instead of the current user credentials. You can apply this user credential to test the page, which uses basic authentication or integrated authentication. If we have multiple user credentials to be tested against this web page, and if the user credentials are stored somewhere, we can use this as a data source for credentials and bind the credentials field to these data source fields.
Credentials can be set using the option in the Web Performance Test editor toolbar. Click the Set Credentials option and enter the User Name and Password values. If you have the data source already, you can click on the Bind... option and choose the data source and the field for the multiple user credentials test for the test page.
This option adds a new request recording to the existing test. Sometimes we may forget to browse certain web pages during the recording. So after recording is done, we can still add requests to the recording using this option. On clicking the option Add Recording in the Web Performance Test editor toolbar, you will see the recording window opened up for new recording. After completing the recording, this current recording will get added to the existing Web test recording. This is one of the ways to edit the recording. We can also delete a request from the existing recording and add a new one.
All Web Performance Tests are recorded and conducted using one web server. If we have to test the same test on another web server, we then have to re-record the testing on the new server and test again. But now Visual Studio provides a feature for parameterizing the web servers. It means that the web server to which all the Web Performance Test requests should point is identified at runtime using these parameters.
For example, this is required when performing the same kind of testing but with different hardware configurations. The requests in the Web Performance Test should point to different hardware every time the configuration is changed. The test scenario is the same in all these cases, but only the configuration changes based on the parameter values set at runtime. This is very useful when the application is tested for load testing, performance testing, and integration testing where only the configuration has changed.
To parameterize the web server in a Web Performance Test:
- Select the Parameterize Web Servers option in the Web Performance Test editor toolbar, which opens the dialog that lists different web servers used by the Web Performance Test. The list contains the context parameter names and the web server URLs associated with the context parameter.

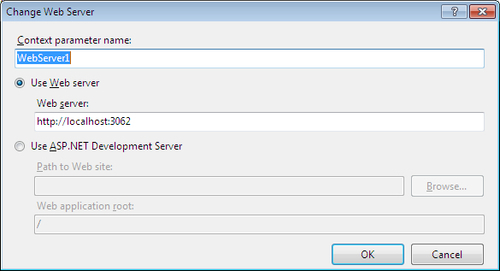
If you are planning to use the local ASP.NET development server, choose the second option, Use ASP.NET Development Server, and provide the local website path and the application root.
After changing the value for the new context parameter, close the Parameterize Web Server dialog box. Now we can see the context parameter added to the Web Performance Test under the Context Parameters folder. Also, we can see that the server addresses in all the request URLs of the Web Performance Tests are replaced with this new parameter, and the value is held by the context parameter.

We can see that the context parameters are used in the requests within the brackets as in {{WebServer1}}, which is replaced by the actual value at runtime.
There are different ways of creating Context Parameters:
- Context parameters can be created by right-clicking on the Context Parameters folder and selecting Add Context Parameter
- The plug-in can create the context parameter and assign the value in the event that runs before the Web Performance Test
For example, the following plug-in assembly code creates a new context parameter for the current window, Country, and adds the parameter to the Web Performance Test. The code also assigns the Country value to the existing Form Post Parameter field, TextBoxCountry.
// Sample plug-in assembly code to create new context parameter
public override void PreWebTest(object sender, PreWebTestEventArgs e)
{
e.WebTest.Context["CountryParameter"] = System.Environment.UserName.ToString();
e.WebTest.Context["ctl00$ContentPlaceHolder1 $FormView1$ctl04$ctl08$_Country$TextBox1"] = e.WebTest.Context["CountryParameter"];
}
When the Web Performance Test is run, we can see the value assigned to the context parameter as well as the Country Text Box form post parameter.
We can also have the Context Parameter added to the Web Performance Test at design time and assign the value at runtime using the plug-in.
Plug-ins are a set of external libraries or assemblies written for custom functionality which can run along with the Web Performance Test. Each plug-in runs once for every iteration of the test. For example, a currency converter could be an external service, which can be used as a plug-in to convert a currency value in the test.
To add a plug-in, we need to first create an assembly or a separate class library with a class containing the custom code. The class should inherit from Microsoft.VisualStudio.TestTools.WebTesting.WebTestPlugin and should implement the PreWebTest() and PostWebTest() methods. At least one of the following methods should be implemented:
PreWebTest():This code will run before the Web Performance Test starts executionPostWebTest():This code will run after the Web Performance Testing is over
To get this namespace, we have to add the Microsoft.VisualStudio.QualityTools.WebTestFramework reference to the assembly. After completing the coding, add this assembly project reference to the Web Performance Test project. Then select the Web Performance Test and choose the Add Web Test Plug-in option from the toolbar, which will list the classes within the assembly. On selection, the class for the plug-in will get added to the test project.

For example, if the class contains the following code, we can see the context variable with the value added to each request in the Web Performance Test. Create an assembly containing the class derived from WebTestPlugin and add the reference to this assembly in the test project.
using System;
using System.Collections.Generic;
using System.Linq;
using System.Text;
using Microsoft.VisualStudio.TestTools.WebTesting;
namespace ClassLibrary1forPlugIn
{
public class Class1 : WebTestPlugin
{
public override void PostWebTest(object sender,
PostWebTestEventArgs e)
{
}
public override void PreWebTest(object sender,
PreWebTestEventArgs e)
{
e.WebTest.Context["TestParameter"] = "Test Value";
}
}
}
e.WebTest.Context contains the current context of the Web Performance Test. The e is the current object that fires the event. The parameters and properties for the current context can be accessed using the e.WebTest.Context object. Click on Add Web Test Plug-in in the Web Performance Test toolbar to open the dialog box that displays the available plug-ins.

Now when the test is run, you can see the context variable added to each request's context.
This is very similar to the Web Performance Test plug-in, but the only difference is that the plug-in code runs for every request in the Web Performance Test. This is the custom code written for complex functionality which should run before or after every request in the Web Performance Test.
The code assembly should reference the library, Microsoft.VisualStudio.QualityTools.WebTestFramework, and the class should inherit from Microsoft.VisualStudio.TestTools.WebTesting.WebTestPlugin and implement the PreRequest() or PostRequest() methods based on whether the code should execute before the request or after the request.
After running the test we will only see the success or failure result of the test, and the different parameter values handled in the test. To get the actual performance of the functions or method calls and the time taken for all the methods within the test, VSTS provides the option to create a performance session. This performance session uses the profiling tool that collects runtime performance data for the application.
Performance session reports various information such as method calls, memory allocations, and time spent in running the methods. To run the performance session:
- Select the Web Performance Test and choose the option, Create Performance Session for this Test, which opens the Performance Wizard. The wizard provides four options for the session type:

- CPU Sampling: This technique collects information such as the CPU time taken for the methods. Moreover, the information is collected between specific time intervals. This is to identify the expensive method which takes the most CPU time to process the code.
- Instrumentation: This technique is used in that case where more information is collected from the test and the external programs are called within the test. This method is used in the case of smaller tests, as the information collected is more than the sampling.
- .NET Memory Allocation (Sampling): This technique collects information like type, size, and the number of objects created or destroyed. The total bytes allocated to the objects are also collected with this profiling
- Concurrency: This technique is used for collecting information about multithreaded applications.
- Resource contention occurs when threads are forced to wait until the shared resources are accessed by multiple threads. This option is used for reporting the total number of contentions and the total time spent waiting for the resource.
- The concurrency visualizer provides general information about how the multi threaded application interacts with hardware, operating system, and other processes.
- After selecting the required option, choose the current test application from the list.
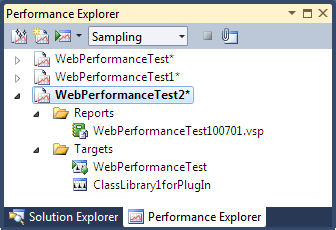
Performance Explorer opens with the new performance session for the selected test. The explorer contains two folders, Targets and Reports. Targets is the applications under profiling. The Report folder contains the list of reports collected on every test run from the performance explorer.
Now launch the test application from Performance Explorer using the options in the explorer. This starts the application at the same time the profiler starts, collecting the execution data from the running application. We need to enter the details and browse through the application UI so that the performance profiler will collect the details up until we finish working with the application. At the end of completing the application run, the profiler produces a report, with all the information collected, by grouping them based on the functionality, as shown below. This is the default summary view of the report that shows the hot path that takes most of the CPU time during the run and the functions that are performing most of the work.
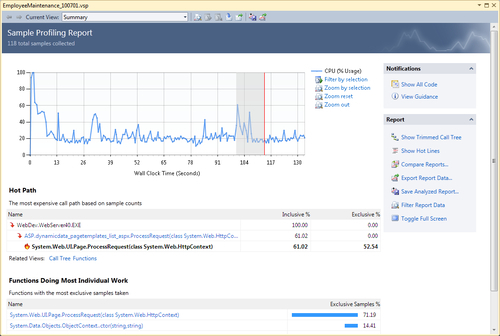
We can change the summary view to show different types of views like Call tree, Modules, Functions, Processes and so on, by selecting the different options given in the toolbar or using the link provided under the reports section in the summary view. The result can be exported for further analysis.
Performance Explorer also provides options to set or change different properties of the profiling. We can change the type of profiling and the data to be collected during data collection like clock cycles, page faults, system calls, and performance counters. We can also set properties for CPU Counters, Windows Events, and Windows Counters.
