
4 Predicting dengue incidence in Thailand from online search queries that include weather and climatic variables
Abstract: This chapter presents machine learning techniques to help public health agencies mitigate vector borne disease, in particular dengue outbreaks. The methods presented in this study will predict the number of dengue cases so that public health authorities may devise adequate interventions to address dengue outbreaks. Search queries from digital sources are used to forecast the number of dengue cases prior to officially reported cases. This is achieved by processing query terms related to vector-borne dengue disease. Climate has been correlated to the vector’s dynamics; hence, query terms related to weather are utilized for the forecasting of dengue cases.
4.1 Introduction
In recent years the significance of the terms used in Internet searches has become increasingly evident. In particular, web search data can be used as trend indicators in a variety of fields. Making use of its direct access to mining search queries, Google offers the web service Google Trends, which presents frequency and location of search terms in different formats (Choi & Varian 2012). Such trends include the categories shopping, arts and companies. Third party providers make use of information obtained from search engines to target specific areas of interest, such as most desired travel locations as defined by Google searches (Shankman 2012). Information about user characteristic has been mined by analyzing sequences of searches and search modifications (Jansen et al. 2000), as well as the use of browsing history to provide personalized search results for different users despite the use of the same search terms (Sugiyama et al. 2004). Similarly, social network analysis techniques have been applied to mine the Web, blogs and online forums to predict long-term trends on the popularity of concepts. Such trends include the popularity of brands, outcomes of political elections, and the winners of movie awards (Gloor et al. 2009). Correlation between health data and information mined from the Internet has been shown in different studies. As an example, Google Flu Trends uses this information to estimate flu activity in the United States. Due to delays in reporting and underreporting in the healthcare system, these search trends may instead serve as early predictors of outbreaks. Regional outbreaks can be detected as early as 7–10 days before surveillance systems by the Centers for Disease Control and Prevention (CDC) (Carneiro & Mylonakis 2009).
4.1.1 Dengue disease in the world
The CDC’s division of vector-borne disease (DVBD) recognizes dengue as one of the vector-borne diseases in its priority list (CDC 2013). Dengue, specifically, is a viral disease that is transmitted via mosquito bites to humans. Dengue, as a reemerging disease, has gained the attention of international health agencies, such as the World Health Organization (WHO) and the Pediatric Dengue Vaccine Initiative (PDVI). The PDVI was founded in 2001 to advance the development of pediatric dengue vaccines for use in developing countries. Based on their collaboration with the WHO, governments, industry, and the scientific community, the PDVI has been actively involved in the development of improved policies and guidelines for clinical evaluations and vaccine testing. Now their work is continued by the Dengue Vaccine Initiative (DVI), a consortion of four organisations: The International Vaccine Institute, the World Health Organization, the International Vaccine Access Center, and The Sabin Vaccine Institute (The Dengue Vaccine Initiative 2014).
The WHO and the PDVI have estimated between 2.5 to 3.6 billion people to be at risk of contracting dengue. In 2010, about 50 million dengue cases resulting in 22,000 deaths were reported worldwide (see Fig. 4.1) (WHO 2010). In the same year, the US territory of Puerto Rico experienced the longest and largest incidence of dengue cases reported since the 1960s (Sharp et al. 2013).
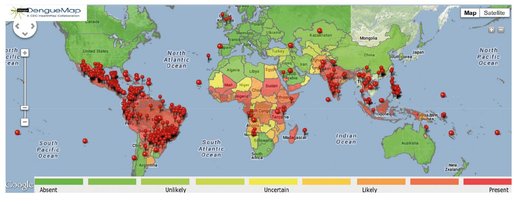
Fig. 4.1: Map of human dengue cases in 2013. Generated and adapted from (healthmap.org 2013).
Studies have shown that variation in temperature acts as an important con-founder affecting metabolic processes and the reproduction of the pathogen within a vector. In addition, variation in temperature influences the number of laid eggs; thereby, modifying the dynamics of the vector population; consecuently, the incidence of dengue in the human population. Peak numbers of human dengue cases during hot-dry and rainy seasons have been reported (Altizer et al. 2006). Moreover, it has been hypothesized that transovarial38 transmission and infected eggs during the diapause39 state may be a contributor of the survival of the virus during inter-endemic periods (Xiao-Xia et al. 2004).
The use of analytic tools such as mathematical and computational models, permit both quantitative and qualitative analysis of virtual contagion scenarios and the forecasting of future outbreaks. Computational disease models allow public health experts to investigate the impact of each mode of transmission, both horizontal and vertical transmission. The ubiquitous access to the Internet and the accessibility of information stored in data centers have given the scientific community a unique opportunity to apply modern statistical techniques to the study of disease dynamics. Making use of these scientific tools, public health authorities can anticipate imminent dengue outbreaks, establish adequate preparedness plans, and develop effective policies that provide rapid interventions and optimal utilization of public health resources. The systematic study of virtual disease scenarios and forecasting will allow health authorities to develop the necessary skills and capabilities today to cope with real sanitary emergencies of tomorrow.
The transmission risk of dengue is strongly dependent on the ambient temperature of the geographic region. Temperature will determine the rate at which mosquitoes develop from egg to adult and therefore the number of vectors. Further, the extrinsic incubation period (EIP), which describes the time until an infected vector becomes infectious is temperature dependent. Therefore, it is imperative for predictive models to include data about climate and climate change.
4.2 Epidemiology of dengue disease
There are two species of vectors that are a natural reservoir of dengue disease; these are Aedes aegypti and Aedes albopictus. The causative agent of dengue is in the category of arboviruses. Four serotype40 strains of the virus DEN-1, -2, -3, and -4, are known to induce dengue fever (DF), dengue hemorrhagic fever (DHF), and life-threatening dengue shock syndrome (DSS). The four dengue serotypes are transmitted and disseminated into the human population through the bites of infected host mosquitoes (Anderson & May 2002).
Once a person acquires dengue, the onset of symptoms begins approximately 4–7 days after the mosquito bite. This time period is known as the latent period. The duration of symptoms typically lasts approximately 3–10 days. It is not unusual that infected people show no symptoms. A large number of dengue virions must be present in the blood stream of the infected person in order to transmit the disease back to the vectors (CDC 2010). Human infection caused by one of the serotypes leads to specific antibodies that provide long lasting immunity. After recovering from a dengue infection, a period of approximately 12 weeks (84 days), immunity is acquired for the other serotypes (Krause 1997).
While feeding on human infected blood, a mosquito digests the dengue virions that will reproduce and infect the vectors cells. Once the virions have reached the salivary glands of the mosquito, it is said to be an infectious mosquito, which will remain in this condition for the rest of its adult life. The elapsed time between digestion and salivary glands infection is known as the extrinsic incubation period (EIP). It is estimated that the EIP can last approximately 8–12 days (CDC 2010). The transmission of dengue disease that occurs between the vector and human population and vice versa is known as horizontal transmission. The annual reemergence of dengue outbreaks varies according with the vector abundance. Moreover, the abundance or the dynamics of the vector population is determined, among other factors, by weather change.
4.2.1 Temperature change and the ecology of A. aegypti
Temperature variation affects the phases of the A. aegypti life cycle. The mosquito life cycle encompasses four metamorphic phases: egg, larva, pupa, and adulthood. Effects in the life cycle of the vector are the shortening or stretching of embryo maturation; the augmentation or decreasing of the viability; and the prolonging or reduction of the life span of the mosquitoes. The influence of temperature on two of these biological phases in eggs, larvae, and pupae are depicted in Fig. 4.2.
Temperature variation not only influences the completion time of biological processes but also establishes the duration of the virus’s extrinsic incubation period (EIP) within the host (known as latent period). The effect of temperature in the efficacy of dengue transmission from A. aegypti into susceptible primate hosts have been reported by Burke et al. (Watts et al. 1987).
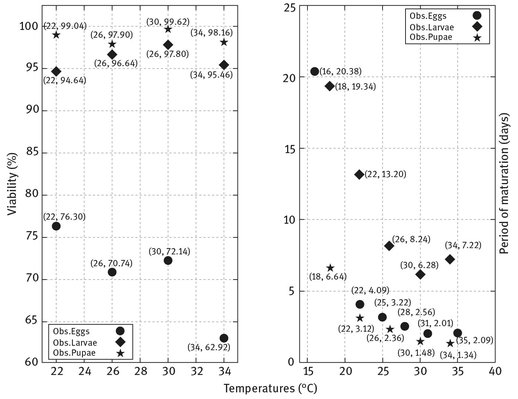
Fig. 4.2: Average viability and maturation time of the egg, larva, and pupa phases of the A. Aegypti mosquito (Beserra et al. 2006; Farnesi et al. 2009).
Unfavorable weather conditions affect the reproduction of the dengue virus within vectors. At temperatures below 24°C, the EIP stretches beyond the life span of mosquitoes. Since the end of the EIP determines the start of the vector’s infectious period, it becomes apparent that it is unlikely that transmission of the virus through mosquito biting could take place, giving no opportunity to the continuation of an endemic process.
There exists another form of dengue transmission, the transovarial transmission, which seems to contribute to the perennial and recurrent annual outbreaks. The transovarial transmission is the transmission of the dengue virus from an infected female vector to its offspring. It is known that infected eggs, under unfavorable conditions, enter into a diapause state, maintaining a dormant generation of future infected mature vectors (Xiao-Xia et al. 2004; Bennet & Joshi 2008). In Fig. 4.3, the change in duration of the extrinsic incubation period by means of change in temperature and a flow diagram describing the transovarial transmission of dengue from a mature vector into the immature phases of the vector are presented.
To this point, we discussed the relationship among temperature, dengue virus, and disease-host A. aegypti. Thus far, the description of these relationships was centered at the organism level; however, another type of relationship exists between the host vector A. aegypti and the dengue virus which can be traced to the level of gene expression (Shuzhen et al. 2012). Knowing the importance of these relationships, each one can be taken into consideration in the design of detailed computational tools to anticipate the trends of seasonal dengue outbreaks. Detailed computational tools necessitate specific data to be available to design such methods. The ubiquity of the Internet and online data sources have become valuable assets for researchers and scientists in the field of public health. Available cyberinfrastructure where online activity, statuses, and queries of millions of people are stored every day has encouraged the advancement and development of methods to predict seasonal outbreaks. In previous work, the use of cyberinfrastructure and computational methods have allowed researchers to forecast yearly trends of infectious disease (Corley et al. 2009). These results have motivated the use of such cyberinfrastructure to design and implement predictive models to the prediction of vector-borne diseases. Recognizing the existing relationships among weather, host, and disease, it is the intent of the following section to introduce available methodologies that can serve as the guiding oracle for the public health experts in the control of vector-borne diseases.
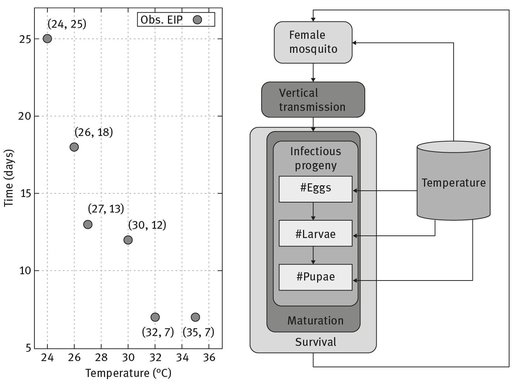
Fig. 4.3: Distribution of dengue virus at different temperatures in head, thorax-abdomen, and salivary glands of the A. aegypti have been reported in (Watts et al. 1987). The graph on the left displays the observed time when the presence of the virus was detected in the salivary glands. The graph on the right exemplifies both the influence of temperature in the phases of the mosquito life cycle and vertical transmission of dengue.
4.3 Using online data to forecast incidence of dengue
This section demonstrates the effort of monitoring dengue outbreaks or forecasting the number of dengue cases to support public health authorities in the planning to mitigate dengue epidemics. This study utilized data from the Internet to predict the number of dengue cases ahead of official reported cases. Several machine learning algorithms were applied to build predictive models. This research aims to confirm that online data are useful for disease surveillance and compare the performance of predictive models.
4.3.1 Background and related work
Dengue is currently the most serious vector-borne disease globally (Guha-Sapir & Schimmer 2005; Racloz et al. 2012). The outbreaks of dengue have affected a large number of people throughout the world, especially in tropical and sub-tropical nations (Map 2012; WHO 2012). Mitigation of this particular vector-borne disease requires a tremendous amount of monetary resources every year, especially in hospitals, where the number of patients grows rapidly during an epidemic. To cope with such outbreaks efficiently, governments require experts, equipment, medicine, and response strategies to assist patients adequatly and to reduce the mosquito population.
There are different challenges during a vector-borne epidemic, which include the lack of vaccine to prevent the infection; severe flu-like illness in children with weak immune systems; the lack of solid plans to control the disease’s outbreak; and the lack of sufficient specialists (Palaniappan & Awang 2008; Potts et al. 2010; Madoff et al. 2011). Governmental budget constraints, and administration inefficiencies are other factors that will result in ineffective response plans. Furthermore, a short incubation period of 4–7 days leads to a quick spread of dengue, which mostly occurs in developing countries (WHO 2012) and often affects a large number of people.
Public health agencies need to cope with dengue outbreaks efficiently. The implementation of a surveillance system is one strategy that can be used to monitor the epidemics of dengue, which may help to mitigate or reduce the disease outbreaks. Epidemiological surveillance systems gather, analyze, and interpret data about a particular disease and the results will be reported to the relevant public health authorities. However, delayed reporting of dengue cases, due to the time-consuming diagnosis process to confirm cases, may render existing surveillance systems ineffective.
Researchers have studied how viruses spread and predicted the distribution of diseases in different regions by modeling and simulating the disease epidemics. This has helped relevant public health agencies to implement active response plans, improve early detection of the outbreak, controlling mosquito populations, migrating at-risk people, and preparing enough physicians and hospitals to respond to the epidemic (Focks et al. 1995; Derouich & Boutayeb 2006; Medeiros et al. 2011). However, accurate modeling and simulation depends on the data, models, and parameters used, to which simulation results are very sensitive. For instance, a minor change of one particular parameter may result in drastically different results. In addition, some experiments may require high performance computing for modeling and simulation of the disease epidemics; otherwise, experiments can not be easily completed within reasonable time frames (Keeling & Ross 2008; Mikler et al. 2009; Bisset et al. 2010).
Another technique to prepare for the spread of infectious diseases is the development of surveillance systems that utilize data from other resources, including websites or social networks. Twitter, for instance, is a type of online social network with data that has been used to predict disease epidemics using different methods in order to help epidemiologists and public health organizations control the disease outbreak (Gomide et al. 2011; Signorini et al. 2011). The use of social network data can help researchers estimate the number of such dengue incidences ahead of official reports, which are often delayed due to the laboratory process. The results of this type of study can help researchers make reasonable predictions about the number of dengue cases at near real-time even though the people who tweeted did not go to hospitals or get diagnosed. This approach is called syndromic surveillance, which is conducted to quickly detect and monitor disease epidemics before diagnoses are confirmed. This will help prepare public health workers and medical facilities to accoma-date potential patients, thereby reducing mobidity and mortality (Buehler et al. 2008; Henning 2008).
The use of social media to advance the epidemiology of Influenza is a good example of improving disease surveillance. Corley et al. collected data from Spinn3r during the Fall flu season from August 1st to October 1st, 2008. After the data was mined and analyzed, the results showed a high correlation between the data on Spinn3r and the US Center for Disease Control and Prevention surveillance reports (r = 0.767) with 95% confidence (Corley et al. 2009).
Twitter data from social networks are another resource that can be used for monitoring disease epidemics. Researchers from the United Kingdom, for instance, analyzed Twitter data for 24 weeks during the occurrence of the seasonal flu H1N1 in 2009. The results indicated that the Twitter data can be used to monitor flu activity in regions. The correlation between the normalized Twitter data and the UK Health Protection Agency (HPA) for five regions was over 0.8 (Lampos & Cristianini 2010). In addition, methodological approaches for utilizing tweets for disease surveillances have been widely used to monitor not only Influenza H1N1, but also many other diseases including malaria, dengue, yellow fever, measles, poisoning, cholera, typhoid, hepatitis, and smallpox (Achrekar et al. 2011; Gomide et al. 2011; Krieck et al. 2011; Signorini et al. 2011).
Regarding the effort of utilizing the social networking data from Facebook, which has become a popular social network, many studies have conducted experiments to gather Facebook data that people posted in public for analyzing, monitoring, and predicting trends (Chu et al. 2011; Cyijiki & Michahelles 2011; Nguyen & Tran 2011). Fan and Yeung collected Facebook data for modeling virus propagation. The findings of this research show that people posted information about their illnesses in their messages on Facebook for entertainment. This indicates that Facebook data can be used for monitoring disease outbreaks (Fan & Yeung 2010).
Data from social networks in the previous examples indicate that such data can be used in syndromic surveillance systems: the systems can track disease epidemics, predict the number cases, and identify the disease outbreak at near real-time. In addition, Achrekar et al. introduced the framework called Social Network Enabled Flu Trends (SNEFT), which performs a crawling over the Twitter messages that are related to the H1N1 symptoms and the data from the influenza-like illness (ILI) reports (this report is always delayed by 1–2 weeks). Researchers collected 4.7 million tweets from Oct 18th, 2009, to Oct 31st, 2010, and used the auto-regression model to analyze the data and predict the ILI incidences. The correlation of the two sets of data was very high (r = 0.98), indicating that Twitter data are useful data for disease surveillance (Achrekar et al. 2011).
Different data mining or machine learning algorithms, such as Naive Bayes, Descision Tree, Artificial Neural Networks, Support Vector Machine, can be used for analyzing disease data in order to identify the high season of outbreaks and to predict the number of cases (Chakoumakos 2012). In previous work, researchers predicted the occurrence of heart disease by analyzing data in the fields of medicine, computer science, and engineering from journals and publications provided on the Internet. Different algorithms were used; the results showed that Decision Tree outperforms Naives Bayes and Artificial Neural Networks (Soni et al. 2011).
In a second study, researchers collected healthcare data from a database at the University of California at Irvine. The data consists of different attributes related to heart disease, such as age, sex, blood pressure, and blood sugar. These data have been analyzed using multiple algorithms, including Rule Based, Decision Tree, Naive Bayes, and Artificial Neural Networks. The findings showed that the Naive Bayes model outperformed the others. The model could predict a heart attack with the accuracy of 84% (Srinivas et al. 2010).
The efforts in disease surveillances have been extended to dengue fever. For instance, Gomide and others collected data from two different sources in Brazil: the Twitter data that are related to dengue terms (dengue) and the official dengue cases. The linear regression model was used for predicting the number of dengue cases. The results showed that the value of predictive model and the Twitter data have high correlation with R2 = 0.9578 (Gomide et al. 2011).
Our research demonstrates the use of data from another resource on the Internet: typical search query data that people entered in the Google search engine. The data were analyzed to predict the number of dengue cases in Thailand. Several machine learning techniques were applied to find the best type of predictive model. Additionally, the query search terms that related to both dengue search terms and climate search terms, including rainfall, temperature, and humidity terms, were collected to find whether these terms can be used to predict the number of dengue cases.
4.3.2 Methodology for dengue cases prediction
4.3.2.1 Framework
As shown in Fig. 4.4, the design of our study consists of five components, which are search query data, official data, predictive models, models validation, and results. The data from the first two components are used to build predictive models that forecast the number of dengue cases. The validation component measures the goodness or the performance of these models using root mean squared error (RMSE), Person correlation coefficient (r), and K-fold cross validation. Finally, the results shall identify the best type of predictive model.
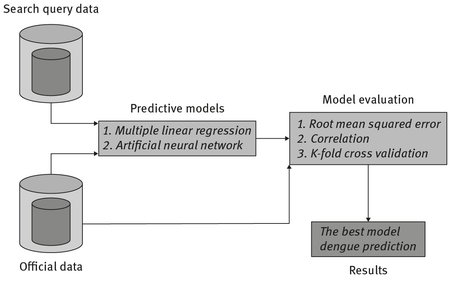
Fig. 4.4: Research framework.
4.3.2.2 Data sets
This study collected two types of data sources, search query data (or search terms) and official data.
(1) Search query data
The frequencies of different search queries were collected from the Google Trends web search engine, which is an online search tool that shows how often a particular search term has been queried over periods of time, different regions, and various languages (Rouse 2012). This study focused on people in Thailand who used the Google search engine to find dengue related information. Therefore, the collection of search terms have been selected from both languages, English and Thai. These terms are related to dengue, climate, and temperature, which have been shown to affect the vector dynamics and thus the severity of dengue epidemic. Search query data were collected from January 2008 to the end of August 2013. The collected data were categorized into four groups as shown in Tab. 4.1.
Tab. 4.1: Variables and search queries.
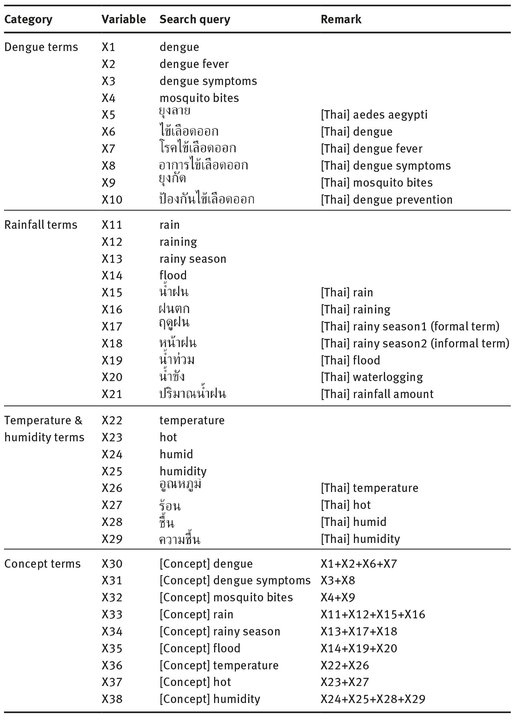
Note that some search terms have a very low frequency. For instance, the frequency of dengue in 2008 was zero, which would cause low accuracy of results. Hence, it is necessary to combine those search terms that have the same or similar meaning. These combined terms are referred to as concept terms. For instance, the [Concept] – dengue is the combination of dengue, dengue fever, [Thai] dengue, and [Thai] dengue fever.
(2) Official data
The official data, which count the reported dengue cases in Thailand from January 2008 to the end of August 2013 was collected from Department of Disease Control, Thailand. The information is hosted and freely available from the official website: http://www.thaivbd.org/dengue.php?id=234.
4.3.2.3 Predictive models
(1) Multiple linear regression
Multiple linear regression is the statistical method employed to model the relationship between a dependent variable (response variable) and two or more independent variables (explanatory variables) (Mendenball et al. 1993; Buntinas & Funk 2005; Sullivan & Verhoosel 2010). This technique attempts to measure the strength of the relationship among the variables. A simple equation of the multiple linear regression model is in the form
(1)
where y is the response variable, β0 denotes the intercept of the regression line, β1 to βk are coefficients or slopes, k is the number of independent variables, ε is the error term or noise, and x1 to xk are independent variables or predictors. In this study, each independent variable (search term) represents the volume of the search query and the dependent variable represents the official number of dengue cases.
(2) Artificial neural network
An artificial neural network or neural network is a machine learning model inspired by the biological nervous system, especially the human brain which consists of nerve cells called neurons. A neuron is connected to other neurons via axons, which transmit nerve impulses to other neurons. A neuron connects to axons via dendrites, which receive signals from other neurons (Zhang et al. 1998; Tan et al. 2005).
Figure 4.5 shows a multilayer perceptrons appoach (MLP), which consists of several layers of nodes equivalent in a small scale to the many neurons in a human brain. The first layer is an input layer, which receives external information. Each node in this layer represents an independent variable. The last layer is the output layer, which represents the dependent variable. Between the input and output layer there are one or more intermediate layers called hidden layers. Hidden layers contain the nodes that connect the input layer with the output layer by means of weighted links. The different weights in differnt links represent the strengths of the relationships among the neurons. For instance, a strong connection between any two neurons is determined by a high weight value of the link between the neurons (Kaastra & Boyd 1996; Zhang et al. 1998).
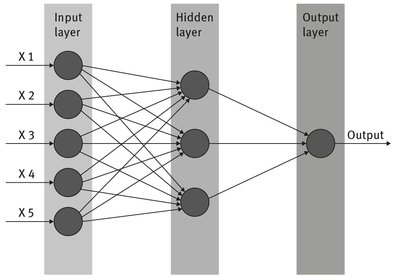
Fig. 4.5: A typical multilayer feed-forward artificial neural network (ANN).
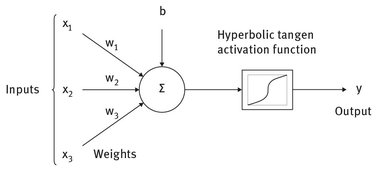
Fig. 4.6: Architecture of applied neural network.
With respect to the training process to learn the weights, the feed-forward and backpropagation algorithms are the most commonly used (Kaastra & Boyd 1996). The algorithms start with the feed forward phase. Input entry data is fed into the network and the weight values in each link are initialized randomly. The next phase compares the output with a desired value (corresponding target) and feedback error (backpropagation), then updates the new weights whenever necessary.
In the feed forward approach, each node in the hidden and the output layers has its weighted sum (or net sum), which is the summation of the products of the weight and the neuron in the previous layer. The equation of the weighted sum is defined as
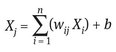
(2)
where Xj represents the weighted sum of the jth neuron in the hidden and output layers. n denotes those neurons forming the previous layer and Xi is the output of the ith neuron in the previous layer. wij is the weight between the jth and ith neuron, and b represents the sum function, which computes the effect of inputs and weights (Ali & Tohid 2012).
The next step of the feed forward method is to apply the activation function in order to reduce the weighted sum values into small numbers. It is the activation function that prevents the neural networks from consuming excessive training time due to large values in the outputs from the weighted sums (Kaastra & Boyd 1996; Akintola et al. 2011). Activation functions commonly used to do this are sigmoid (logistic), hyperbolic tangent (tanh), sine or cosine, and linear (identity) functions (Zhang et al. 1998; Tan et al. 2005).
In this study the hyperbolic tangent function is used by the neurons in the hidden layer. The hyperbolic tangent function is defined as
(3)
where sinh x is the hyperbolic sine of x, cosh x is the hyperbolic cosine of x, and e is Euler’s number (approximately 2.718281828).
In addition, the activation function for the output layer used in this study is linear function ( y = f(x)) because the expected value is the number of dengue cases (continues values).
4.3.2.4 Validation
(1) Root mean squared error (RMSE)
The root mean squared error is one of the most common measurement methods to evaluate the goodness of different models (Mendenball et al. 1993). This method measures the performance of candidate models by taking the standard deviation of the prediction errors (residuals). The lowest value of RMSE gives the best model because the lowest value indicates less residual variance. The RMSE can be computed as
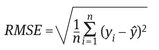
(4)
where yi is the actual value (official number of dengue cases), ŷ is the prediction value, and n is the size of data.
The RMSE is very sensitive with large errors that would result in a very high value (Mendenball et al. 1993). Normalized RMSE is used to transform the RMSE into a small value. The equation of normalized RMSE is defined as
(5)
where NRMSE is the normalized root mean squared error, RMSE is the root mean squared error, and Xmax and Xmin are the maximum and the minimum of the actual (observed) values, which come from the official data.
(2) Pearson correlation coefficient (r)
The Pearson coefficient measures the correlation between two variables. It determines how strong the relationship between two variables is. The following equation defines the Pearson coefficient:
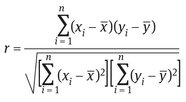
(6)
where x1, …, xn are the values of independent (predictor) variables, ![]() denotes the mean of x1, …, xn, y1, …, yn, which are the values of dependent variables, and
denotes the mean of x1, …, xn, y1, …, yn, which are the values of dependent variables, and ![]() represents the mean of y1, …, yn. The values of r are between –1 and 1, r = 1 indicates perfect positive correlation, r = –1 indicates perfect negative correlation, and r = 0 indicates the absence of correlation between the two random variables (x and y). In this study, x1, …, xn are predicted values (cases) and y1, …, yn represent reported cases.
represents the mean of y1, …, yn. The values of r are between –1 and 1, r = 1 indicates perfect positive correlation, r = –1 indicates perfect negative correlation, and r = 0 indicates the absence of correlation between the two random variables (x and y). In this study, x1, …, xn are predicted values (cases) and y1, …, yn represent reported cases.
(3) K-fold cross-validation
Cross-validation is used to evaluate and compare the learning algorithms by dividing the corpus into two data sets: training and testing. The training set is used to learn or to train, whereas the testing set is used to validate the model. In the k-fold cross-validation, the data corpus is partitioned into k equally sized subsets. During each execution, one subset is chosen for testing while the others are used for training. The process repeats k times in order to allow each data subset to be used as a testing set (Tan et al. 2005).
In this study, both official dengue cases and search query data were partitioned into six subsets, 2008–2013. Each subset consists of 12 months, except the data from 2013, which was available from January to the end of August. Although this data set did not cover a complete year, it is acceptable as it spans over most of the year.
4.3.3 Prediction analysis
In this study, IBM SPSS was used to analyze the corpus, which was partitioned into six data subsets. Each subset (data for a single year) was used for testing, and the rest of the subsets were used for training. Having four categories per year, the analysis produced 24 models.
4.3.3.1 Multiple linear regression
In order to build the models to predict the number of dengue cases, multiple linear regression was used for analysis. SPSS was executed multiple times based on the different subsets of the corpus and the categories. For analysis, the “backward” method was used in the process.
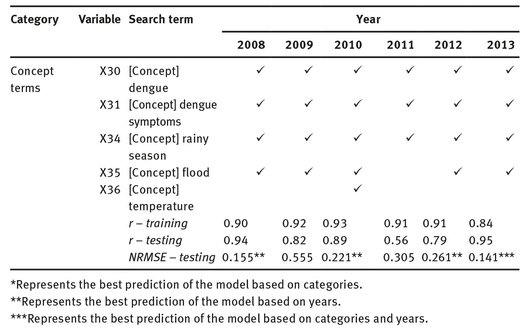
The “backward” method starts with all candidate variables (search terms) then removes the variable which improves the model.41 This process is repeated until no improvement can be made (all the remaining variables have a p-value less than or equal to 0.05). The results of the multiple linear regression analysis are summarized in Tab. 4.2.
Nineteen search terms shown in Tab. 4.2 are the terms used in the fitted models, which were built from multiple linear regression analysis. As can be seen from this table, there are six dengue search terms, seven rainfall terms, two temperature terms, and five concept terms that were used to predict the number of dengue cases.
For dengue search terms, there are two English terms and three Thai terms that were produced by the analysis. In 2008, only two terms ([Thai] dengue and [Thai] dengue prevention) were used in the fitted model, indicating that the number of people who used dengue related search terms in 2008 was not high. In 2009, three dengue terms were used in the fitted model; the correlation for the training set is very strong (r = 0.90), but there is a low value for testing (r = 0.34). This may be caused by a weak relationship between the data for testing and the number of reported dengue cases. In 2010 and 2012, the correlations for testing are lower than those for training. The large size of the dengue outbreak that occured in 2010 and 2012 may be a plausible explanation.
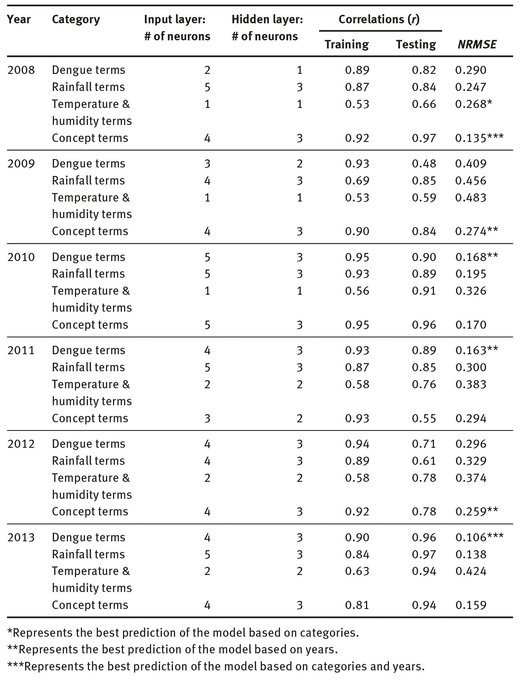
Tab. 4.2: Variables, or search terms, produced from multiple linear regression analysis, the correlations (r) between the predicted values and the reported dengue cases, and the normalized root mean squared error (NRMSE). The best prediction of each model are mostly concept terms models, indicating that the concept terms improve in the predictions.
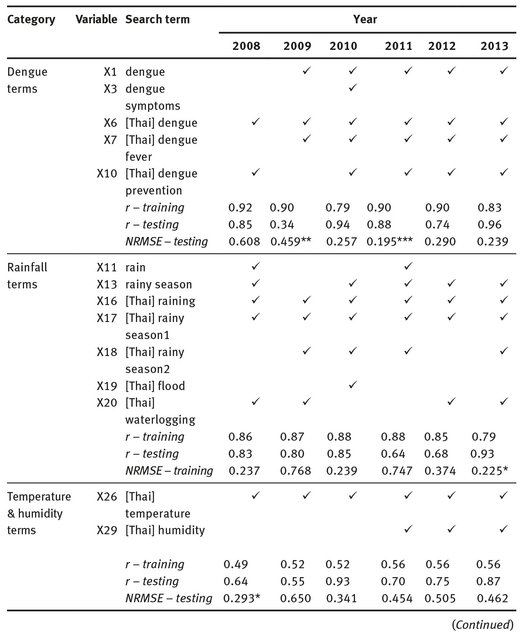
For the category of rainfall terms, there are seven search terms (out of eleven terms) that have been used in the fitted models: two English terms and five Thai terms. The correlations around 0.80 indicates that the predicted values and the official dengue cases have a strong relationship.
This suggests that the rainfall terms can be used to predict number of dengue cases. However, the moderate correlations in 2011 and 2012 (r = 0.64 and 0.68, respectively) are lower than those obtained for training. These may be due to an abundance of rainfall in 2011, which caused significant flooding which lasted until the beginning of 2012. Due to this anomaly, an overestimation is expected in the predictions in these 2 years.
With eight terms of temperature and humidity, there are only two terms ([Thai] temperature and [Thai] humidity) used in the fitted models. In fact, there is only one term ([Thai] temperature) used in the predictive models in 2008–2010. In addition, the correlations between 0.49 and 0.56 for training data sets indicate moderate relationships between the reported cases and these search terms.
The concept terms, the combination of search terms that have very close meanings, were created to improve the predictive models because of the low frequency of most search terms, which would cause lower correlations for testing when comparing to those correlations for training. As can be seen in Tab. 4.2, the correlations between the predicted values and the observed values are very strong and higher than those in other categories, indicating that the search terms used in this study can be used to predict the number of dengue cases. However, there is a medium correlation (r = 0.56) for testing in 2011. This might be due to the high frequency of the term [Concept] rainy season, due to the flood in 2011, and therefore, affects the fitted model (overestimation).
In 2013, the correlations are very strong, and the correlation values for testing are higher than the correlation values for training. In 2013 the government and the public health agencies have frequently informed the people about the number of dengue cases since the beginning of the year, leading to the high frequency of all search terms that correspond to the number of dengue cases.
The normalized root mean squared error (NRMSE) for each model was computed to find the best predictive model based on categories and years. The models for concept terms are generally the best predictors for dengue cases, indicating that the concept terms improve the forecasts.
Examples of the results from multiple linear regression for 2012 and 2013 are shown in Fig. 4.7. The predicted values, are plotted against the observed values based on four categories. The white backgrounds in these graphs represent the data for testing (predicted data).
4.3.3.2 Artificial neural network
For this analysis, IBM SPSS was used to build different models to predict the number of dengue cases. For each learning model, we used the same predictors (independent variables) as those used for multiple linear regression. As a result, SPSS produced different predictive models. In Tab. 4.3, the correlations between the reported dengue cases and the predicted data produced from artificial neural network analysis are shown.
As shown in Tab. 4.3, most of the correlations are higher than the correlations from multiple linear regression. For example, the correlations for training for all years and all categories, except temperature and humidity terms, range between 0.69 and 0.95, while the correlations for testing range from 0.48 to 0.97. Moreover, the correlations for the temperature and humidity terms range from 0.53 to 0.94. These indicate that the predicted values produced from ANN analysis have stronger relationship with the number of dengue cases than the predicted data produced by the multiple linear regression.
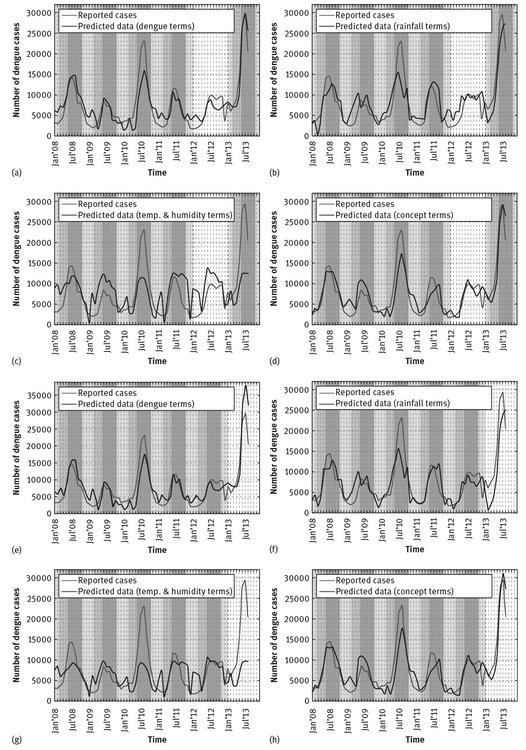
Fig. 4.7: Prediction of dengue cases for 2012 and 2013, white regions, using multiple linear regression mode. Winter (yellow), summer (orange), and rainy (blue) seasons are rendered in the background.
Tab. 4.3: Summary of the artificial neural network analysis. the lowest normalized root mean squared error (NRMSE) for each year and each category indicates the best prediction of the models.
Examples of the results from the artificial neural network analysis in 2012 and 2013 are shown in Fig. 4.8. The predicted data are plotted against the official dengue cases in four categories. The lowest NRMSE values of the models for dengue terms and the models for concept terms indicate the best predictions based on categories and years.
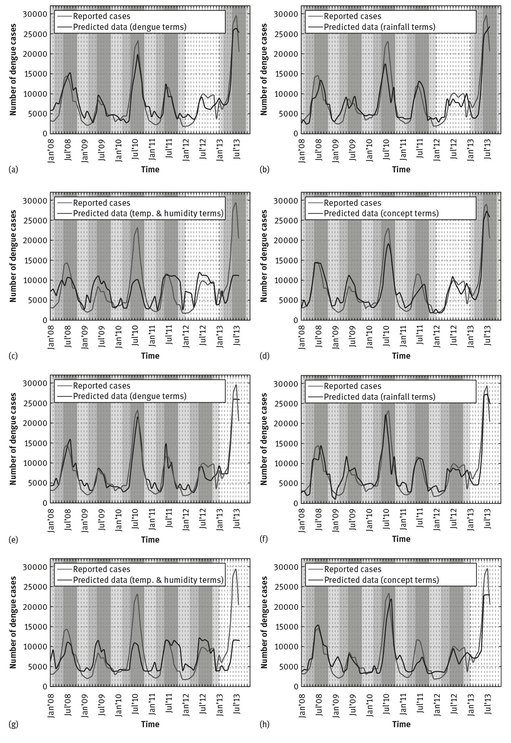
Fig. 4.8: Prediction of dengue cases for 2012 and 2013, white regions, using artificial neural network model. Winter (yellow), summer (orange), and rainy (blue) seasons are rendered in the background.
4.3.3.3 Comparison of predictive models
In order to compare the performance of the models created by multiple linear regression and artificial neural network, we assessed the quality of these models by computing the overall correlations (r) and overall NRMSE, which evaluates how close the predicted and the observed data are. The highest correlation value represents the strongest relationship between the predicted and observed data, and the lowest value of NRMSE indicates the performance of the best predictive model.
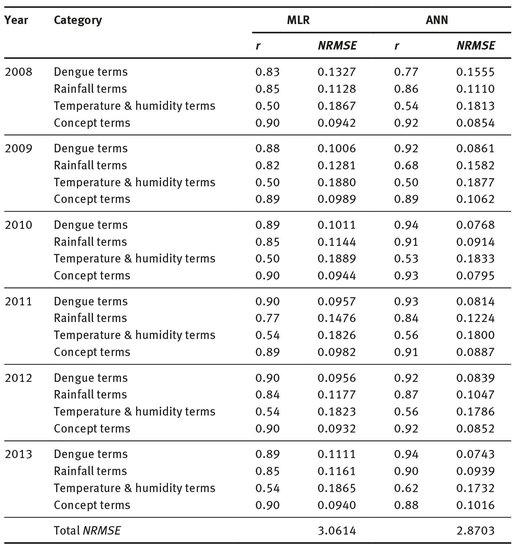
Table 4.4 shows the best model for multiple linear regression is the model for concept terms in 2012 with a highest r = 0.90 and a lowest total NRMSE = 0.0932. The best artificial neural network model is the model in 2013 for dengue terms with a maximum r = 0.94 and a minimum total NRMSE = 0.0743. On the other hand, the worst multiple linear regression model is the model of temperature and humidity terms in 2010 (lowest r = 0.50 and highest total NRMSE = 0.1889). In addition, the worst artificial neural network is the model of temperature and humidity terms in 2009 (lowest r = 0.50 and highest total NRMSE = 0.1877).
Overall, the correlations from artificial neural network (ANN) are mostly higher than those from multiple linear regression (MLR) models, and the total NRMSE from artificial neural network (2.8703) is lower than the total NRMSE from multiple linear regression. These indicate that the ANN models outperform the multiple linear regression models.
4.3.4 Discussion
The overall correlations of the predicted data and the observed data are mostly higher than 0.80, indicating that these trends are strongly related. It implies that the search terms from Google trends can be used to predict the number of dengue cases. Both the MLR and ANN demostrated to be good predicting models for the number of dengue cases.
The low frequency of the search terms is directly affecting the fitting and the performance of the models as can be seen in the low correlations of the testing as compared with those of the training. When combining the frequency of search terms that have the same meaning (concept terms), the correlations for testing are mostly higher than those for training. A high correlations in 2013 indicates a strong relationship between the predicted and observed data. This implies that the fitted models work very well and the data for testing are suitable for the prediction. This strong correlation may be due to the fact that Thai public health agencies have issued warnings and informed the population via the media about the ongoing dengue outbreak. In addition, the usage of the Thai Internet has been high during this period, consecuently leading to a high frequency of search terms in 2013.
Tab. 4.4: Comparison of predictive models.
The high correlations of rainfall terms indicate a strong relationship of the predicted and observed values. This suggests that rainfall related terms have a significant predictive power and can be utilized to forecast the severity of a dengue epidemic. Nevertheless, the correlations of temperature and humidity terms in all models range between 0.50 and 0.62 indicating that the predicted and the observed data have only a moderate relationship to each other, leading to a decreased accuracy in the prediction of dengue cases. The low values of NRMSE stem mostly from the models that used dengue and concept terms. These terms are highly correlated with the number of dengue cases, and they have therefore strong predictive power.
4.4 Conclusion
Our research has focused on a set of specific search terms that have been motivated by the effects of climate change and temperature variation on the mosquito life cycle and consecuently the epidemiology of dengue.
Occurrences of climate specific terms together with dengue specific terms in search queries have been obtained from Google trends. Different machine learning techniques have been utilized to derive predictive models that are capable of forecasting the severity of dengue epidemics. The results of our research indicates that Google trend data is in fact suitable for the construction of predictive models which can accurately estimate the indicence of dengue during an epidemic in Thailand.
Some of our research results have been posted on Facebook in an effort to share them with public health professionals in Thailand. In response, some comments have been posted, which express great interest in the model results as shown in Fig. 4.9. It appears that many public health practitioners are seeking support in online social media. We believe that the use of social network sites and the analysis of their contents can drastically improve the prediction of disease incidence in general and dengue cases in particular.
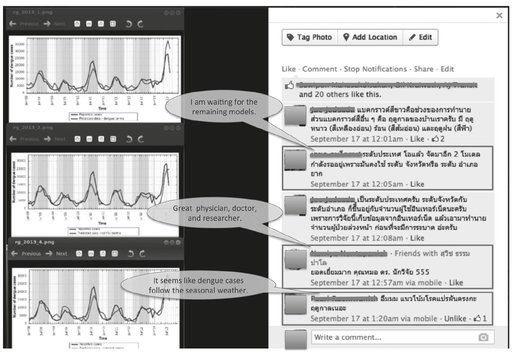
Fig. 4.9: Experiment results posted on Facebook unchained a reaction of positive comments from public health practitioners.
References
Achrekar, H., Gandhe, A., Lazarus, R., Yu, S. & Liu, B. (2011) ‘Predicting flu trends using Twitter data’, IEEE International Workshop on Cyber-Physical Networking Systems, 702–707.
Akintola, K. G., Alese, B. H. & Thomson, A. F. (2011) ‘Time series forecasting with neural network: a case study of stock prices of intercontinental bank Nigeria’. IJRRAS, 467–472.
Ali, N. & Tohid, A. (2012) ‘Prediction the effects of ZnO2 nanoparticles on splitting tensile strength and water absorption of high strength concrete’. Mater Res, 15:440–454. ISSN 1516–1439.
Altizer, S., Dobson, A., Hosseini, P., Hudson, P., Pascual, M. & Rohani, P. (2006) ‘Seasonality and the dynamics of infectious diseases’. Ecol Lett, 9(4):467–484.
Anderson, R. M. & May, R. M. (2002) Infectious Disease of Humans: Dynamics and Control. Oxford: Oxford Science Publication.
Bennet, A. & Joshi, N. (2008) ‘Distribution and seasonality of vertically transmitted dengue virus in Aedes mosquitoes in arid and semi-arid areas in Rajasthan, India’, J Vector Borne Dis, 56–59.
Beserra, E. B., de Castro Júnior, F. P., dos Santos, J. W., da S Santos, T. & Fernandes, C. R. M. (2006) ‘Biologia e Exigências Térmicas de Aedes Aegypti (L.) (Diptera:Culicidae) Provenientes de Quatro Regies Bioclimáticas da Paraíba’, Neotrop Entom, 350(6):853–860.
Bisset, K. R., Chen, J., Feng, X., Ma, Y. & Marathe, M. V. (2010) ‘Indemics: an interactive data intensive framework for high performance epidemic simulation’, ICS 2010, 5:2010.
Buehler, J. W., Sonricker, A., Paladini, M., Soper, P. & Mostashari, F. (2008) ‘Syndromic surveillance practice in the United States: findings from a survey of state, territorial, and selected local health departments’, Adv Dis Surv, 6(3):1–20.
Buntinas, M. & Funk, G. M. (2005) Statistics for the Sciences. London: Thomson Brooks/cole.
Carneiro, H. A. & Mylonakis, E. (2009) ‘Google trends: a web-based tool for real-time surveillance of disease outbreaks’, Clin Infect Dis, 49(10):1557–1564.
CDC. (2010) Dengue – Epidemiology. [Online]. Available: http://www.cdc.gov/dengue/epidemiology/index.html.
CDC. (2013) Division of vector-borne diseases. [Online]. Available: http://www.cdc.gov/ncezid/dvbd/.
Chakoumakos, R. (2012) Predicting Outbreak Severity Through Machine Learning on Disease Outbreak Reports, Palo Alto, CA: Stanford University Press.
Choi, H. & Varian, H. (2012) ‘Predicting the present with Google trends’, Econ Trend, 88:2–9. Jun.
Chu, H., Deng, D. & Park, J. H. (2011) ‘Live data mining concerning social networking forensics based on a Facebook session through aggregation of social media’, IEEE J Select Area Commun, 29(7):1368–1376.
Corley, C. D., Miller, A. R., Singh, K. P. & Cook, D. J. (2009) ‘Monitoring influenza trends through mining social media’, International Conference on Bioinformatics & Computational Biology, Las Vages, NA.
Cyijiki, I. P. & Michahelles, F. (2011) Intelligent heart disease prediction system using data mining techniques. IEEE 9th International Conference on Dependable, Autonomic and Secure Computing.
Derouich, M. & Boutayeb, A. (2006) ‘Dengue fever: mathematical modeling and computer simulation’, Appl Maths Commun, 177(2):528–544.
Fan, W. & Yeung, K. H. (2010) Virus propagation modeling in Facebook. IEEE International Conference on Advances in Social Networks Analysis and Mining.
Farnesi, L. C., Martins, A. J., Valle, D. & Rezende, G. L. (2009) ‘Embryonic development of Aedes Aegypti (Diptera:Culicidae): influence of different constant temperatures’, Mem Inst Oswaldo Cruz, 104(1):124–126.
Focks, D. A., Daniels, E., Haile, D. G. & Keesling, J. E. (1995) ‘A simulation model of the epidemiology of urban dengue fever: literature analysis, model development, preliminary validation, and samples of simulation results’, Am Soc Trop Med Hyg, 53(5):489–506.
Gloor, P. A., Krauss, J., Nann, S., Fischbach, K. & Schoder, D. (2009) Web Science 2.0: Identifying trends through semantic social network analysis. In Computational Science and Engineering, 2009. CSE’09, International Conference on, pp. 215–222.
Gomide, J., Veloso, A., Maria, W., et al., editors. (2011) Dengue surveillance based on a computational model of spatio-temporal locality of Twitter, June 14–17. Proceedings of the ACM WebSci’11. Koblenz, Germany, ACM.
Guha-Sapir, D. & Schimmer, B. (2005) ‘Dengue fever: new paradigms for a changing epidemiology’, BioMed Central, 2(1).
Health Map. (2012) Dengue map. [Online]. Available: http://www.healthmap.org/dengue/index.php.
healthmap.org. (2013) Health Map – Dengue. [Online]. Available: http://www.healthmap.org/dengue/.
Henning, K. J. (2008) Overview of sysdromic surveillance what is syndromic surveillance? [Online]. Available: www.cdc.gov/MMWR/preview/mmwrhtml/su5301a3.htm.
Jansen, B. J., Spink, A. & Saracevic, T. (2000) ‘Real life, real users, and real needs: a study and analysis of user queries on the web’, Inform Process Manag, 36(2):207–227. Mar.
Kaastra, I. & Boyd, M. (1996) ‘Designing a neural network for forecasting financial and economic time series’. Neurocomputing, 10:215–236.
Keeling, M. J. & Ross, J. V. (2008) ‘On methods for studying stochastic disease dynamics’, J R Soc Interface, 5(19):171.
Krause, R. M. (1997) Emerging Infections. Academic Press, 15 East 26th St., 15th Floor, New York, New York 10010, USA, first edition.
Krieck, M., Dreesman, J., Otrusina, L. & Denecke, K. editors. (2011) A new age of public health: identifying disease outbreaks by analyzing Tweets. Health WebScience Workshop, Proceedings of the ACM WebSci’11. Koblenz, Germany, ACM.
Lampos, V. & Cristianini, N. (2010) Tracking the flu pandemic by monitoring the Social Web. IEEE International Conference Workshop on Conitive Information Processing.
Madoff, L. C., Fisman, D. N. & Kass-Hout, T. (2011) ‘A new approach to monitoring dengue activity’, PLoS Negl Trop Dis, 5(5):e1215.
Medeiros, LCdC., Castilho, C., Braga, C., et al. (2011) ‘Modeling the dynamic transmission of dengue fever: investigating disease persistence’, PLoS Negl Trop Dis, 5(1):e942.
Mendenball, W., Reinmuth, J. & Beaver, R. (1993) Statistics for Management and Economics. Duxbury press.
Mikler, A. R., Bravo-Salgado, A. & Corley, C. D. (2009) ‘Global stochastic contact modeling of infectious diseases’, International Joint Conference on Bioinformatics, Systems Biology and Intelligent Computing, (5), doi: 10.1109/IJCBS.2009.84.
Nguyen, K. & Tran, D. A. (2011) An analysis of activities in Facebook. In. IEEE 8th consumer communications and networking conference-emerging and innovative consumer technologies.
Palaniappan, S. & Awang, R. (2008) ‘Intelligent heart disease prediction system using data mining techniques’, In Computer Systems and Applications. IEEE/ACS International Conference. March 31–April 4.
Potts, J. A., Gibbons, R. V., Rothman, A. L., et al. (2010) ‘Prediction of dengue disease severity among pediatric Thai patients using early clinical laboratory indicators’, PLoS Negl Trop Dis, 4(8):e769.
Racloz, V., Ramsey, R., Tong, S. & Hu, W. (2012) ‘Surveillance of dengue fever virus: a review of epidemiological models and early warning systems’, PLoS Negl Trop Dis, 6(5):1–9.
Rouse, M. (2012) Google trends. [Online]. Available: http://whatis.techtarget.com/definition/Google-Trends.
Shankman, S. (2012) The top travel trends of 2012 as defined by Google searches. [Online]. Available: http://skift.com/2012/12/12/travel-trends-in-2012-as-defined-by-google-searches/. Dec.
Sharp, T. M., Hunsperger, E., Santiago, G. A., Muñoz-Jordan, J. L., Santiago, L. M., Rivera, A., Rodríguez-Acosta, R. L., Feliciano, L. G., Margolis, H. S. & Tomashek, K. M. (2013) ‘Virus-Specific differences in rates of disease during the 2010 dengue epidemic in Puerto Rico’, PLoS Negl Trop Dis Apr.
Shuzhen, S., Ramirez, J. L., & Dimopoulos, G. (2012) ‘Dengue virus infection of the Aedes aegypti salivary gland and chemosensory apparatus induces genes that modulate infection and blood-feeding behavior’, PLoS Pathog, 8(3):e1002631, 03 2012. doi: 10.1371/journal.ppat.1002631.
Signorini, A., Segre, A. M. & Polgreen, P. M. (2011) ‘The use of Twitter to track levels of disease activity and public concern in the U.S. during the influenza A H1N1 pandemic’, PLoS One, 6(5):1–9.
Soni, J., Ansari, U. & Sharma, D. (2011) ‘Predictive data mining for medical diagnosis: an overview of heart disease prediction’, Int J Compt Appl, 17(8):43–48.
Srinivas, K., Rani, B. K. & Govrdhan, A. (2010) ‘Applications of data mining techniques in healthcare and prediction of heart attacks’, Int J Comput Sci Eng, 2(2):250–255.
Sugiyama, K., Hatano, K. & Yoshikawa, M. (2004) ‘Adaptive web search based on user profile constructed without any effort from users’, WWW’ 04 Proceedings of the 13th International Conference on World Wide Web.
Sullivan, M & Verhoosel, J. C. M. (2010) Statistics: Informed Decisions Using Data. Upper Saddle River, NJ: Prentice-Hall.
Tan, P., Steinbach, M. & Kumar, V. Introduction to data mining. Addison-Wesley, 2005.
The Dengue Vaccine Initiative. (2014) About DVI. [Online]. Available: http://www.denguevaccines.org/. Jan.
Watts, D. M., Burke, D. S., Harrison, B. A., Whitmire, R. E. & Nisalak, A. (1987) ‘Effect of temperature on the vector efficiency of Aedes aegypti for dengue 2 virus’. Am J Trop Med Hyg, 36(1):143–152.
WHO. (2010) Dengue in the Western Pacific Region. [Online]. Available: http://www.wpro.who.int/health/_topics/dengue/.
WHO. (2012) Dengue and severe dengue. [Online]. Available: http://www.who.int/mediacentre/factsheets/fs117/en/.
Xiao-Xia, G. U. O., Tong-Yan, Z., Yan-De, D., Shu-Nan, J. & Bao-Lin, L. U. (2004) ‘Transmission of dengue 2 virus by diapausing eggs of Aedes albopictus’, Acta Entom Sinica, 47(4):424–428, ISSN 04546296. URL http://www.insect.org.cn/EN/column/column105.shtml.1.
Zhang, G., Patuwo, B. E. & Hu, M. Y. (1998) ‘Forecasting with artificial neural network: the state of the art’, Int J Forcast, 14:35–62.