6 Twitter for health – building a social media search engine to better understand and curate laypersons’ personal experiences
Abstract: Healthcare professionals, trainees, and laypersons increasingly use social media over the Internet. As a result, the value of such platforms as a vital source of health information is widely acknowledged. These technologies bring a new dimension to health care by offering a communication medium for patients and professionals to interact, share, and survey information as well as support each other emotionally during an illness. Such active online discussions may also help in realizing the collective goal of improving healthcare outcomes and policies. However, in spite of the advantages of using social media as a vital communication medium for those seeking health information and for those studying social trends based on patient blog postings, this new medium of digital communication has its limitations too. Namely, the current inability to access and curate relevant information in the ever-increasing gamut of messages. In this chapter, we are seeking to understand and curate laypersons’ personal experiences on Twitter. To do so, we propose some solutions to improve search, summarization, and visualization capabilities for Twitter (or social media in general), in both real time and retrospectively. In essence, we provide a basic recipe for building a search engine for social media and then make it increasingly more intelligent through smarter processing and personalization of search queries, tweet messages, and search results. In addition, we address the summarization aspect by visualizing topical clusters in tweets and further classifying the retrieval results into topical categories that serve professionals in their work. Finally, we discuss information curation by automating the classification of the information sources as well as combining, comparing, and correlating tweets with other sources of health information. In discussing all these important features of social media search engines, we present systems, which we ourselves have developed that help to identify useful information in social media.
6.1 Introduction
Social media refers to interactions among people in which they create, share, exchange, or comment on information or ideas in the Internet or with other virtual communities and networks that predate the Web, such as bulletin board services (Ahlqvist et al. 2008). Examples of social media include Facebook, MySpace, PatientsLikeMe, Second Life, Twitter, Wikipedia, and YouTube.45
In 2013, Twitter is one of the most popular platforms for social media in the Internet. It was created and opened for users in March−June 2006. This platform enables users to create, share, exchange, and comment short messages (a.k.a. microblogs), called tweets. Each tweet has the maximum length of 140 characters and is connected with optional metadata for additional information, deeper context, and embedded media. On its seventh birthday in March 2013, Twitter had over 200 million active users creating over 400 million tweets per day (Twitter Blog 2013). To illustrate its rapidly increasing popularity, the numbers of active users and tweets per day were as follows: In the end of 2008, barely two million tweets were sent per day, and just a year and half later, in June 2010, the number of tweets per day was 65 million (Twitter Blog 2011). In June 2011, there were 200 million tweets daily, with 140 million active users, and, in March 2012, with approximately the same number of active users, volume had reached 340 million tweets per day (Twitter Blog 2011, 2012).
The value of social media as a source of health information has been widely acknowledged as useful to both healthcare professionals and laypersons alike. By following the definition of the Oxford dictionaries,46 we use laypersons in this chapter as a reference to those without professional or specialized knowledge in health care. Based on the review of 98 studies by Moorhead et al. (2013), social media brings a new dimension to health care by offering a medium for laypersons and healthcare professionals to communicate about health issues with the potential of improving healthcare outcomes and policies. This new kind of online communication is seen to have many consequences. By increasing interactions between laypersons and professionals, vital health information as well as other users’ subjective health experiences are made available to patients, their caretakers, and professionals who are monitoring and participating in these online chats. Much peer/social/emotional support is often derived from such communications. Moreover, the sheer volume of social media communications provides a means for facilitating a much improved public health surveillance. This new media is catching on among professionals. A review of 96 studies by Hamm et al. (2013) shows that the use of social media is already widespread among healthcare professionals and trainees, who see this networking medium as instrumental in helping to facilitate communication and in increasing one’s knowledge. Patients likewise increasingly use the Internet and social media to discover knowledge and trends related to a variety of health problems, as well as for healthcare access and proper treatment (Young & Bloor 2009). For example, PatientsLikeMe, founded in 2004, reports now on their website having more than 220,000 users and covers more than 2000 medical conditions in 2013.
However, using social media as a source of health information has its limitations too. The primary limitation consists of the current inability to select, organize, and present – that is, curate − information on social media in terms of its quality and reliability (Moorhead et al. 2013). For example, when Hurricane Sandy killed more than 280 people and caused a total of nearly 70 billion dollars in damages in the central and north America in October 2012, as little as 9% of the related tweets were assessed as useful and reliable (The Australian 2013). This finding is based on analyzing a dataset of 50 million tweets over a 28-day period before, during, and after the hurricane. The second limitation is actually a byproduct of the popularity of social media itself. That is, the popularity of social media can sometimes make it hard to satisfy information seekers’ needs for finding relevant and useful information because they must sift through a tremendous amount of messages found on the social media sites, blogs, bulletin boards, and other virtual communities and networks. This phenomenon of one’s inability to sift through a voluminous amount of social media messages is a problem in information access.47 In sum, these two limitations − difficulties in curating the existing information and difficulties in sifting through mounds of social media posts − emphasize the need for new methods and approaches that can be used in identifying accurate and useful information from the multitude of tweets.
In this chapter, we are seeking to understand and curate laypersons’ personal health experiences expressed as Twitter or other social media messages. We begin by detailing different sources of health information, positioning social media as one of those sources, illustrating the amount of information across such sources, and discussing the potential and limitations of social media as a source of health information. Then, we describe some solutions that have been proposed to improve Twitter search engines, either by an improved understanding of laypersons’ experiences or by adding new ways of monitoring information quality and reliability. We provide a basic recipe for building a search engine for social media and methods for making it increasingly intelligent. This includes intelligent techniques to enrich the search queries; analyze the relevance of a given tweet and query; classify tweets into topical categories; curate their content through automated source classification; and combine, compare, and correlate tweets with other sources of health information. We present systems we have developed that help look for useful information in social media. Finally, we discuss our research findings and conclusions.
6.2 Background
6.2.1 Social media as a source of health information
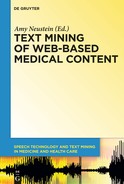
Today, social media forms a part of health information. Health information includes all health-related content in all data formats, document types, information systems, publication media, and languages from all specialties, organizations, regions, states, and countries across the dimensions of audience (e.g., clinician or layperson), accessibility (e.g., public or limited), and accreditation (e.g., official and approved, peer reviewed, or uncurated) (Fig. 6.1). This information also depends on the author, community, and time (Suominen et al. 2008). So, for example, we all have our individual writing style, which evolves over time upon interacting with people at our home, school, and work. This style includes, among other things, our own particular use of jargon, abbreviations, and acronyms. Because we all have our own writing style, it is not uncommon to find tweets that, although addressing the very same topic, show many variations in vocabulary, style, and hashtags. This varying language is sometimes unintentional (e.g., misspellings or grammatical errors). Sometimes, however, such variations are by choice, thereby expressing the creativity of the individual tweeter.
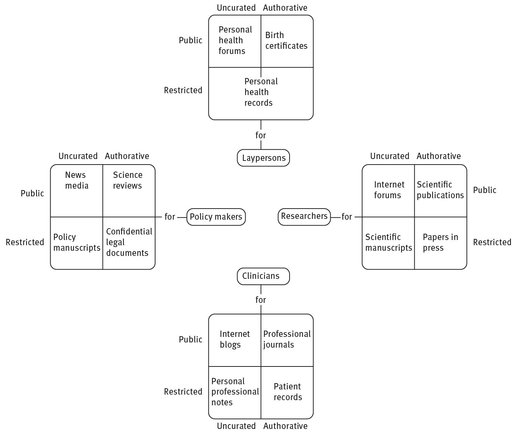
Fig. 6.1: Dimensions of health information.
Let us briefly illustrate the wide gamut of health information across these various dimensions indicated in Fig. 6.1. PubMed,48 which is a search engine accessing the MEDLINE database maintained by the United States National Library of Medicine, gives us an example of publicly available, peer reviewed scientific papers for researchers and practitioners. It is one of the most popular search engines in the Internet for biomedical literature, life science journals, and online books. Approximately 10 years ago in 2003, the MEDLINE database consisted of nearly 16 million entries (i.e., publications49). This number grew by almost 600,000 entries since 2002, that is, by more than 1600 entries per day. When we go forward 10 years to 2013, we see that the total number of PubMed entries has grown to over 23 million, and the respective growth rate has almost doubled to 3000 entries per day. However, if we do not limit ourselves to PubMed exclusively but look instead for all publications in health sciences appearing in the Internet, we see that, as far back as 2003, the daily growth rate of added entries exceeded 3300 papers (Coiera 2003). What this shows us is that the availability of health-related publications on the web has been growing exponentially over the years.
The Australian and US portals for clinical practice guidelines by (1) the Australian Government and National Health and Medical Research Council, and (2) the US Department of Health and Human Services, Agency for Healthcare Research Quality, respectively, are also curated and publicly available.50 Their over 4000 approved up-to-date documents are not only targeted to professionals but to laypersons as well.
In contrast, records produced in health care for professionals (and laypersons) are confidential and official. Within these records, the largest quantities of data consist of images; the second largest quantity of data found in medical records is the data gathered automatically from various monitoring devices (e.g., for heart rate, blood pressure, and breathing) as well as other care devices. The smallest quantity of data found in such records consists of typed data. Even this data size is obviously not small. In fact, during one single inpatient period in intensive care, the data typed as free-form text alone can translate up to 37,000 words or about 75 pages (Suominen & Salakoski 2010).
In comparison, the publicly available, uncurated information originating from Twitter for professionals and laypersons grows by 400 million tweets per day (Twitter Blog 2013). This corresponds to 20 million pages of new text every day. Reading them all would take over 60 years.
Health information written by laypersons to their peers on social media sites may be uncurated, yet it captures the valuable personal experiences of patients, patients’ next-of-kin, and their caretakers with regard to health issues and access to health care. People use the Internet and social media, especially Twitter, increasingly to search for knowledge and uncover trends related to health and health care (Young & Bloor 2009). Nearly half of Europeans consider the Internet as an important source of health information (Kummervold et al. 2008). More than 80% of Australians use the Internet, and over 40% of Australian searches on the Internet are related to health and medical information (Experian Hitwise 2008; The World Bank 2013). An online survey about the use of health related social networking sites found that 85% of the survey participants were seeking information about their medical condition on line (Colineau & Paris 2010). Approximately three out of every four US adults use the Internet, and 80% of them search the Internet for health information in particular (Fox & Jones 2009; Fox 2011).
6.2.2 Information search on social media
Social media supports information search through user-entered keywords. With the 200 million active users of Twitter creating over 400 million tweets per day, these active users send out 1.6 billion queries on Twitter per day (Twitter Blog 2011, 2013). To support these information seekers, social media platforms have specified and implemented, for example, hashtags on Twitter (e.g., #healthcare) and the<meta> field in an Internet page to insert a short description of the page, keywords, and other metadata. However, their availability is conditional to users entering the appropriate keywords.
Since 2011, Twitter has also supported information search by creating personalized search experiences based on using information about the information seeker (e.g., geographic location, preferred language, and social relationship between the seeker and author). This personalization is a timely topic, because the total personalized healthcare market in the US alone has been predicted to double from approximately 250 billion USD in 2009 to 500 billion USD in 2015 (Price Waterhouse Coopers 2010).
However, this current support for information search is not enough to leverage collective knowledge in social media. In other words, when considering social media, especially Twitter, for use in key decision making, we need to recognize three facts:
First, using Twitter content is comparable to “drinking from a firehose” (where an onslaught of information is coming at a person all at once, and they have to struggle to be able take it in all), or, alternatively, “searching for a needle in a haystack” (where a plethora of information is present but one has no clue where to find the kernel of information they seek). Twitter’s usage is growing exponentially over time (Sullivan 2010; Twitter Blog 2011, 2013). Here is how: In 2010, an average of 600 tweets were sent per second. By 2011, this had nearly quadrupled to over 2200 tweets per second. By 2013, the number of tweets per second had grown to 4600. When considering a particular search topic, this rate of tweets per second can vary substantially, and the reason for the wide range in the number of tweets on various subjects can be equally mystifying.
For example, the rate of tweets per second peaked at over 140,000 (i.e., about 7000 pages per second) in August 2013 in response to viewers’ discussions on a particular Japanese television show (Twitter Blog 2013). The explanation of this record rate of tweets was that viewers during the Nippon Television Network’s airing of Laputa: Castle in the Sky joined the animation film’s protagonists in casting a magic spell, known as “BALS.”51 Since viewers needed to participate in casting this spell in simultaneity with the film characters, so that they could assist the protagonists in closing down or destroying the city of Laputa, the number of tweets broke all records in Twitter history (Madoka 2013). In contrast, when looking at stories that are less theatrical or mystical, even though they may have an effect on large populations of community residents, the rate of tweets per second shows a vastly different picture.
When combining the number of tweets from the New Zealand earthquake and the Australian floods, the total number of tweets that were generated was 52,600 over 3 months (Bruns et al. 2012; Kreiner et al. 2013; Twitter Blog 2013). This number may sound small when compared with 140,000 tweets per second, but it still corresponds to over 2600 pages of text. As a further complexity, tweets are authored by the 200 million active users who are registered with Twitter, and the Twitter service handles 1.6 billion search queries per day (Twitter Blog 2011, 2013). Consequently, such linguistically short-spoken and lexically extensive data needs to be assessed, related and visualized with respect to all different search topics, information needs, and query variants. In the presence of these requirements, keyword and/or hashtag searches on Twitter are insufficient, and often prone to returning false information. Our key observation is that search tools must be very effective at extracting meaningful content from the vast amounts of raw data.
Second, until recently, standard searches on Twitter have been limited to tweets that are not older than approximately a week (Sullivan 2010). The reason for this is that scalability must be the key performance measure in the evaluation of search engines for Twitter. Because earlier engines did not scale out (thus not enabling them to process vast amounts of raw data), they limited their data to recent tweets. However, with health issues such as infectious diseases, limiting the processing of tweets to a narrow window of time does not allow for the building of a knowledge base about important health trends. Thus, we cannot stress strongly enough how important it is for engines to scale out to the large numbers of tweets. This has motivated us and other R & D teams, as well as Twitter itself, to enhance the state of the art in the scalability of search engines. Consequently, in 2010−2013, significant progress has been made, enabling the processing of tweets over increasingly longer periods of time. Since 2011, the search engine of Twitter can search from the entire tweet history using the “divide and conquer method” (Twitter Blog 2011). Instead of analyzing the entire tweet history at once, the set of all tweets is divided to subsets based on the message posting-time. Then the engine progresses through these batches retrospectively from the most recent to the oldest tweets, accumulating new hits to the end of the result list every time the analysis of yet another subset becomes available. This method takes time, however, and the information seeker must thus wait a bit if there are a large amount of relevant tweets. In addition, the results are ordered strictly by time rather than by the relevance of such tweets. This can make it especially hard to find information right away that is directly relevant to the information seeker’s search query, since the user must first go through all the search results that are brought up because of their chronology. From what we describe here, it is understandable that a good deal of more work is needed to address this important search issue.
Third, tweets’ information quality and reliability needs to be monitored, and this text analysis needs to be combined, compared, and correlated with other sources of health information. The content of relevant tweets (assuming that the many irrelevant tweets have been removed) may be erroneous or even malicious. Some analysis approaches have already been shown to combat effectively the so-called “fake” imagery in Twitter (e.g., during Hurricane Sandy false images of sharks swimming in suburban streets were created and tweeted), and general false statements such as those that occurred at the time of the Boston Marathon bombing (Gupta et al. 2013a, b). In addition, tweets provide extensive metadata that can inform automated analysis technologies (Lim et al. 2013). In conclusion, our key observation is that obtaining useful reliable health information from Twitter requires highly efficient search and processing mechanisms. While work has been done towards this goal, more research is required before Twitter can be used effectively to gather informative content.
6.3 Proposed solutions
Social media promises “collective knowledge” or “wisdom of crowds,” where many small observations may be aggregated into large, useful information. Search engines with increasing intelligence are needed to leverage this collective knowledge in social media. First, as mentioned in the prior section, tweets need to be assessed, related, curated, and visualized with respect to search topics, queries or emergent events (anomalies). Second, this text analysis needs to be combined, compared, and correlated with other sources of information.
The task of building an Internet search engine that retrieves documents whose content matches a search query is called information retrieval (Manning et al. 2008). Typically, the related solution techniques belong to the field of machine learning (Dua et al. 2014) that enables computers to learn to carry out specific tasks. Often this learning is the result of observing the connections between data and desired solutions. Also, sometimes techniques belonging to the field of natural language processing (NLP) (Nadkarni et al. 2011) are employed. NLP refers to automated techniques for understanding and generating a human language.
In the following three subsections, we describe some solutions that have been proposed to improve Twitter search engines, either by improved understanding of laypersons’ experiences or through contributions to information curation.
6.3.1 Tools for information retrieval on twitter
Twitter supports information search through user-entered keywords (i.e., hashtags) and personalization (i.e., use of geographic location, preferred language, social relationship between the seeker and author, and other information about the information seeker). However, this current support for information search is conditional to users entering the keywords and insufficient to leverage collective knowledge in social media. The question is, then: How can we build a basic search engine and then increase its intelligence?
6.3.1.1 Basic recipe for building a search engine
A basic recipe for building a search engine is to first create a repository of indexed documents to be searched for and, second, implement the search functionality. This can be accomplished in many ways, but next we provide a basic recipe.
The repository of indexed documents can be an existing collection of electronic documents, or it can be created by using an Internet crawler (a.k.a. spider, ant, scutter, or indexer) that is initialized with a given Internet page and used to follow every link on that page respectively, and then store the new documents that are found (Kobayashi & Takeda 2000). The Twitter Application Programmer’s Interface (API) provides a way to collect a repository of tweets.52 The collection can be initialized by user names; tweet identification numbers (id); hashtags or other search terms (a.k.a. query terms); geographic location; or time. The step of indexing the documents specifies an id for each document in the repository and stores the content that will be used by the search functionality. That is, the functionality can consider all document content, or it can be limited to, for example, the title, abstract, metadata, or the page’s uniform resource locator (URL) in the Internet.
The search functionality implements a way for the seekers to enter queries, eliminate duplicate documents, assess the relevance between a given query and document, return relevant documents, and rank the returned documents in the order of most-to-least relevant. For example, the Apache Lucene is a piece of open-source software that developers can use for this search task.53 To make the functionalities more intelligent, they can also assess the trade-off between the content width and depth in returned documents. This trade-off means that all returned documents should not describe the same content, but rather supplement each other by providing different kinds of content. For example, the query of obs may refer to obesity, obsessiveness, obstetrician, and Osteoblasts, just to name a few; and RR to radiation reaction, recovery room, relative response, respiratory rate, and risk ratio, among others. Or more detailed content can be provided for that matter as in “an obstetrician is a medical professional” versus “a physician who provides care for women and their children during prenatal, childbirth, and postnatal periods.” Moreover, increasing intelligence can be used in visualizing the search outcomes in more interpretative ways than by just providing a ranked list of documents.
In order to improve the search results with Twitter data, it may be beneficial to use Twitter-specific tools to process the documents before using the search functionality. Example tools include:
- TwitterNLP (Gimpel et al. 2011) for tokenization (i.e., identifying words in a stream of text and replacing the words with their base forms) and part-of-speech tagging (POS, i.e., tag every word in a stream of text with its grammatical category, such as noun, punctuation mark, or abbreviation);
- Twitter stopwords (i.e., a list of common words not to be used in indexing and search); and
- Twitter-sentiment-analysis for performing sentiment analysis (a.k.a. opinion mining, which identifies and extracts subjective information in documents such as when a tweet is describing a subjective vs. objective statement, or is expressing a positive, neutral, or negative opinion).54
6.3.1.2 Solutions
Su et al. (2011b) applied machine learning and NLP to searching information in Twitter in order to support consumers of health information in finding relevant concepts and in discovering new knowledge and trends. The search engine, called TweetDetector, is made more intelligent by adapting query expansion (QE) (i.e., adding search terms to a query by including synonymous concepts) and by ranking (i.e., returning the output list in the relevance order, as explained in the previous subsection) for the purpose of information retrieval.
First, the search engine performs normalization of tweets and the query that elicits the tweet responses. This aims to improve lexical coherence, expedite the search, and save memory on a computer. The normalization begins by removing stop words using the SMART system,55 supplemented with www and other repeatedlyused terms in social media. The normalization continues with LingPipe56 in order to extract the tweet message for query expansion. Finally, words in the tweet and query are lemmatized using the Porter Stemmer.57
Second, the search engine performs query expansion on the normalized tweets and queries. This is accomplished by a series of steps: (1) asking an information seeker to enter an original search query; (2) retrieving tweets that include at least one original search term; (3) identifying from the retrieved tweets nine additional terms to be included in the query; and (4) repeating the search with this expanded query. Let us now clarify the last two steps.
At the third step, the engine defines the additional terms by using so called TFxIDF and Rocchio’s QE with pseudo feedback models, which are among the default choices in information retrieval (Manning et al. 2008). The TFxIDF model calculates a term weight vt for each unique term t in the set of retrieved tweets, and the model of Rocchio’s QE with pseudo feedback re-scales these weights. TF refers to the frequency of term t in the set of retrieved tweets and IDF to inverse document frequency, defined as the total number of retrieved tweets divided by the number of tweets containing the term t. In the TFxIDF model, these two numbers are scaled logarithmically and multiplied. These TFxIDF weights vt are then re-scaled as defined by the model of Rocchio’s QE with pseudo feedback:
where r refers to the number of relevant tweets and is set to 20; td records whether the term t is mentioned at least once in the tweet d; D is the total number of tweets; and the default values of 1.00 and 0.75 are used for the parameters α and β, respectively. Using this re-scaling does not require feedback from the information seeker – with pseudo feedback, the tweets that are ranked in the top 20 by the original search are assumed to be relevant.
At the fourth step, the search engine returns the expanded query with the original query and the terms associated with the nine largest weights. The implementation of all these steps is based on the aforementioned Lucene search engine.
This simple engine performs significantly better than an even simpler engine that is otherwise the same but ignores the query expansion step. Intuitively, tweets containing more search terms (or expanded terms) are ranked higher. The retrieval performance of this simple approach, that is, the quality of the search results, varies from satisfactory to excellent, depending on the search terms. This performance evaluation was based on the set of a million tweets; namely, queries of diet, weight, and weight loss, and two information seekers. The comparison uses the Precision at N (P@N) measure (Manning et al. 2008), defined as the proportion of the relevant tweets that are retrieved out of the top N retrieved tweets. This measure takes values between zero (i.e., the worst performance) and one (i.e., the best performance). For N, the evaluation uses the values of 10, 20, 30, … , 100.
Su et al. (2011a) extended the engine by considering other approaches for tweet processing (Fig. 6.2). The extension aimed to improve the quality of the search results by increasing the intelligence of the engine. The development includes synonymy analysis, link expansion, and active learning.
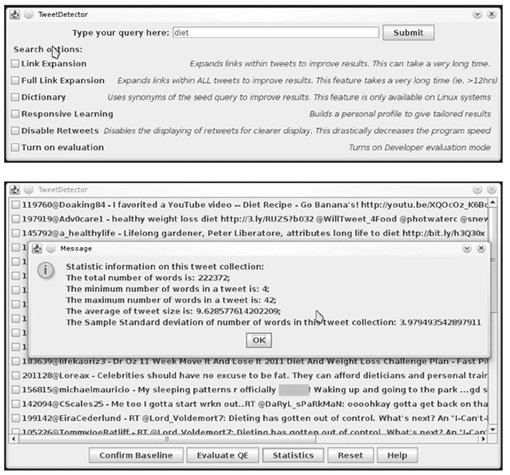
Fig. 6.2: Screen captures from using the extended TweetDetector engine for the query of diet.
The synonymy analysis component extends the aforementioned QE approach by appending the search query with more content. It is performed before applying other components. The component uses the Infomap NLP Software to identify terms used in tweets that could be synonymous to the search terms.58 Synonymous terms are those that have a synonymy score larger than a given threshold value (i.e., 0.7 in this case); the score values are between zero (i.e., very dissimilar terms) and one (i.e., very similar terms). If synonymous terms are found, the query is enriched by appending it with these synonyms.
The link expansion component enriches the tweet messages by appending them with more content. First, it uses the URL class of java.net to identify all URLs mentioned in tweets.59 Second, it follows the URLs and analyzes both the < meta > field of the Internet page and the rest of the page. The parts considered in the analysis of the < meta > field include the keywords, description (i.e., an overview of the page content), and content language (e.g., en for pages in English). As discussed above, the availability of these parts is conditional to the page creators entering the content. The paragraph analysis uses the CyberNeko HTML Parser to parse the page in HyperText Markup Language (HTML) and access its information as a tree in Extensible Markup Language (XML).60 This enables efficient segmentation of the page into paragraphs. Based on applying rules61 to the paragraph text, the analysis determines whether a given paragraph contains key content. If the content language field indicates that the page is in English, the tweet message is enriched by appending text found under keywords, description, and key content.
The active learning component attempts to better personalize the search results by exploiting tweets that a given information seeker has previously marked as relevant. First, the component removes duplicate tweets (e.g., forwarded messages) and very similar tweets (e.g., messages that have been forwarded after a slight modification of the content). To define this similarity, the component analyzes the re-scaled weights wt for two tweets, and, if their difference is small, the tweet with the smaller value is removed. If the values are equal, the second tweet is removed. Second, the information seeker is shown the resulting list of the top 20 retrieved tweets. Third, the seeker evaluates the relevance of these tweets to the query by marking the relevant tweets. Fourth, the term weights vt are adjusted accordingly, and the rest of the search process is repeated. This results in revised search results (i.e., tweet listing).
The retrieval performance of the extended system has been compared against the original TweetDetector engine using the set of 300,000 tweets; queries of diet, weight, and weight loss; and four information seekers. The comparison uses the P@100 measure. In general, the extension seems to contribute to the performance (Fig. 6.3), but it takes time and requires feedback from the information seeker.
Fig. 6.3: Retrieval performance for the queries of diet, weight, and weight loss. The statistics to generate the graph originate from Su et al. (2011a).
6.3.1.3 Health concerns, availability of clean water and food, and other information for crisis management knowledge from twitter
Social media is a major source of crisis information in 2013. For example, in Australia, over 80% of people use the Internet, three out of every four people can access the Internet on a smartphone or other mobile device, and this accessibility has more than doubled from 2010 to 2013 (CampaignBrief 2013; The World Bank 2013). The potential of social media to help with crisis management has been already highlighted – see, e.g., Griffen et al. (2012). But is this a reliable source, and how can we curate this information?
6.4 Background
The role of Twitter changed from a personal network for messaging in real time to a global crisis informatics solution in January 2009. Crisis informatics is defined as the interconnectedness of people, organizations, information, and information and communication technology during a crisis situation (Hagar 2006). On January 16, 2009 at 7:33 AM, a tweet broke the news about a plane crash in New York 15 minutes before the media (The Telegraph 2009). Ever since, Twitter has gained increasing importance during natural disasters, epidemics, and civil unrest. Let us consider the following three examples over the past 6 years:
First, in California in October 2008, when wildfires destroyed 500,000 acres of land and 1500 homes, three out of every four people sought information on the Internet, and over a third of people created or shared information on Twitter or similar Internet solutions (Sutton et al. 2008).
Second, in Australia and New Zealand in January−March 2011, during the Queensland floods and the Christchurch earthquake, there was, likewise, a fair amount of tweeting (Bruns et al. 2012; Kreiner et al. 2013). The flooded area in Australian Queensland was 1,000,000 km2, which is more than the combined area of states of Texas and New Mexico in the US or of the European countries of France and Germany. The New Zealand earthquake killed 185 people and costs of re-construction were estimated as USD 17−25 billion. Over 9400 people created over 52,600 unique tweets related to the earthquake, with nearly 860,000 words (approximately 75,800 unique words) in total, and the floods drew approximately 1100 tweets every hour.
Third, the AH1N1 (a.k.a. swine flu), the Japanese crisis, and the Libyan civil war took a major toll on human life. In the aftermath of the 2011 AH1N1 flu outbreaks in South and Central America as well as in the Caribbean and Mexico, the World Health Organization’s Pan American regional office issued a pandemic preparedness alert because of the vast number of people affected by the influenza outbreak.62 The “Japanese crisis” refers to a catastrophic chain of events back in March of 2011, when an earthquake of a magnitude of 9.0, considered the fifth most powerful earthquake in the world, killed nearly 16,000 people in the surrounding Tokyo region, triggering a tsunami, which claimed another 3500 lives. A nuclear disaster ensued when the flooding from the tsunami paralyzed the backup generators that were supposed to prevent the fuel rods from overheating. This caused a nuclear incident that was considered among the 10 worst nuclear accidents in history, similar to Chernobyl in 1986 and Three Mile Island in 1979 (Cohen 2011).63 The Libyan civil war, in turn, killed at least 30,000 people, injuring another 50,000 in their six-month long civil war (Laub 2011). Twitter no doubt became the pulse of these events, with the AH1N1 flu being the lead topic on Twitter, followed by the Japanese crisis and the civil war in Libya (Twitter Blog 2011).
6.5 Some solutions
Tweets hold the potential to be useful in crisis management, including the management of health related crisis (e.g., the AH1N1 crisis mentioned above). But to fulfill that potential they need intelligent search and summarization systems to assure their accessibility and reliability. Both NICTA (National ICT Australia) and CSIRO (Commonwealth Scientific and Industrial Research Organization) have developed such systems. We describe below the two NICTA systems in some detail, while we present only a summary of ESA, a system developed by CSIRO, and refer the reader to more detailed descriptions in Yin et al. (2012); Cameron et al. (2012); Power et al. (2013); and Karimi et al. (2013).
Crisis managers, media and other people interested in summarizing Twitter in real time can use NICTA EventWatch to monitor the message topics.64 The summary aggregates messages into meaningful clusters as they emerge over time. That is, this system is designed for monitoring Twitter in real time. Details of the clustering method used in EventWatch can be found in Can (1993), and more recent methods that could be useful are described in Mehrotra et al. (2013). Also the live demonstration of EventWatch is available in the Internet (Figs. 6.4 and 6.5).65 The demonstration uses the query of #auspol lang:en corresponding to tweets containing the hashtag #auspol, for Australian political discussion, in English.
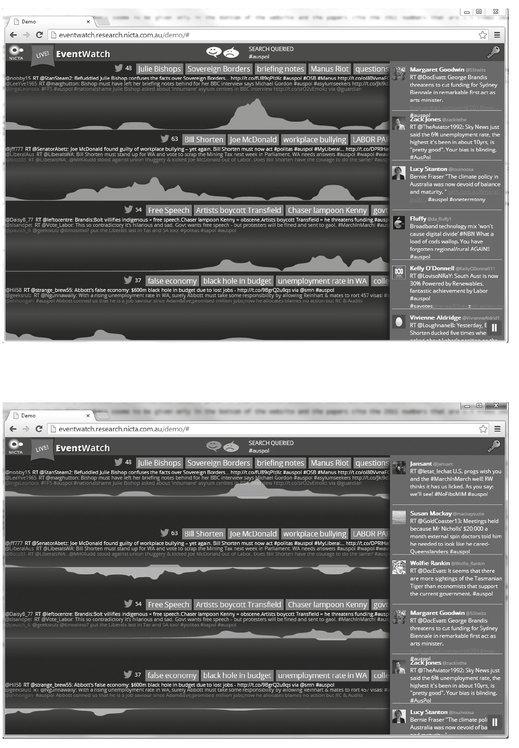
Fig. 6.4: EventWatch area graphs without (i.e., top) and with (i.e., bottom) the sentiment analyzer.
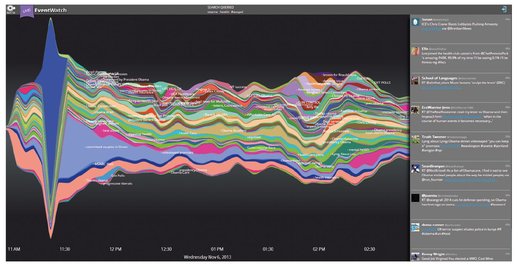
Fig. 6.5: Stream graph illustrating the topic distribution in time on EventWatch.
Let us illustrate a use case of EventWatch as follows: Consider an information seeker with domain knowledge who requires immediate information on emerging topics of interest. For example, during a crisis, an information seeker could have the following information need/query: “what are the key requests for resources”; or during a technology conference, the topic of interest might be: “what are the emerging questions or focus points?” In both cases, the seeker needs to quickly sift through social media streams (e.g., Twitter) and develop a summary of activity (i.e., what are the key topics) along with an action plan (i.e., how to respond) and then to support other activity − typically by providing situational advice. The technology is expected to operate in real-time, providing a visual summary of topics as an alert to the already busy seeker. EventWatch is not an automated decision support tool, but rather a technology assistant that allows the seeker to focus on key areas of interest: although machines cannot replace people in understanding the text, they can reduce the stream to manageable topic areas for further investigation.
EventWatch operates on a query-based analysis of Twitter: the seeker defines a query (e.g., a hashtag, keyword, boolean query, or a combination of these) which is then passed to Twitter. This user-defined query selects the tweets from the Twitter stream, which provides a near-real-time stream of matching tweets. The use of queries is due to the limitations of the current public Twitter API, which only returns 150 tweets per hour (around 1%) from the complete Twitter stream. A query-based system improves the chances that the tweets found will be useable, and it is recommended by Twitter to avoid applications being “rate limited” (blocked).
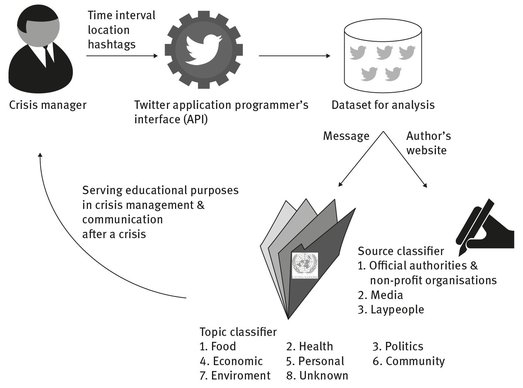
Fig. 6.6: Workflow for using the NICTA automated classifier for crisis managers.
The text of the tweets in the stream is then analyzed to extract keyphrases. Keyphrases are formed from two or more unigrams (i.e., an n-gram is a text sequence of n words, and thereby, a unigram is a one-word sequence such as opening or keynote) that frequently co-occur in a text corpus (e.g., opening keynote, live demo, or stunning animations). These keyphrases are generally more useful than single words because they are more specific. The keyphrases define topics that may be of interest to the information seeker. Given topics can grow or shrink depending upon the scale of activity in the Twitter stream.
Within the topics, named entities of people, places, and organizations can be extracted, and sentiment (i.e., if a tweet is positive or negative) can be found. The topics themselves are linked to the live Twitter stream, to allow the seekers to draw their own conclusions about the quality of the analysis. The technology allows the seeker to view emerging topics within a specific area of interest. If the seeker clicks on a given topic, they can perform a forensic analysis of the tweets related to the topic.
The NICTA automated classifier for crisis managers analyzes tweets retrospectively in order to classify them with respect to topics and information sources (Kreiner et al. 2013; Fig. 6.6). Results serve educational purposes in crisis management and communication after a crisis. For example, the distribution of messages across the topics (sources) can demonstrate the nature (reliability and maturity) of the crisis. When applied periodically over time, analyses could reveal early indicators for specific developments, trends, and effects of crisis communication during a crisis.
The topic classifier uses seven threat categories by the United Nations (i.e., Food, Health, Politics, Economic, Personal, Community, and Environment), supplemented with the categories for Other potentially relevant information to crisis management and Irrelevant. The categories for information relevant to crisis management are defined as follows: If the tweet is relevant to food quality or supplies (e.g., availability of clean water and food), assign it to the category of Food. Otherwise, consider the other categories in the order of Health, Politics, Community, Personal, Economic, Environment, and Other. If none of these categories is relevant, assign the tweet to Irrelevant.
First, the topic classifier uses the aforementioned Twitter POS Tagger for lemmatization and part of speech tagging. Second, it replaces more specific terms with more general terms (e.g., food, natural phenomena, and possession) and expands shorthand using the WordNet on NLTK,66 supplemented with references to images, numbers, money, geographic locations, Twitter users, hashtags, Internet addresses, and shorthand. Third, it extracts physiological features using the Regressive Imagery Dictionary on NodeBox.67 Fourth, it applies the optimal subset of 72 binary features to tweet classification using Naïve Bayes on Orange.68 The classification performance is good in the major categories of Economic and Community, but more modest in the minor categories, where not enough data were available for a proper initialization. The evaluation is based on the set of over 100,000 tweets, of which 1000 are evaluated by two information seekers. The measures of the number of true positives (i.e., tweets for which both the seeker and classifier assign the same category c), false positives (i.e., tweets for which the seeker does not assign the category c but the classifier does), true negatives (i.e., tweets for which both the seeker and classifier do not assign the category c), and false negatives (i.e., tweets for which the seeker assigns the category c but the classifier does not) for each category c are applied.
The source classifier detects whether the information source is: (1) an official authority (e.g., emergency agencies, ministries, police, fire services, military sources, the Red Cross or the Green Cross,69 or any other non-profit organization); (2) the media (e.g., online magazines and television/radio stations); or (3) a layperson. It is rule based; that is, the analysis focuses on presence or absence of 123 class-specific top terms. The classification performance is excellent in all categories. The evaluation is based on the set of over 100,000 tweets, of which 600 are evaluated by one information seeker. Again, the measures of the number of true positives, false positives, true negatives, and false negatives for each category c are applied.
In contrast to these NICTA technologies, the CSIRO ESA System (Cameron et al. 2012; Yin et al. 2012; Karimi et al. 2013; Power et al. 2013) is not query-based. It constantly monitors the Twitter stream and performs a real-time analysis (1) to look for an anomaly, which could reflect a specific event, a crisis or an emergency that needs attention, or (2) to identify that a specific event, such as a fire, has happened and requires a response. An anomaly is defined as a variance in the type of messages or the information being posted. When an event occurs and many people post about it, the words associated with the event will be mentioned more frequently than they normally would. For example, an epidemic might result in many people posting about the disease. ESA uses a burst detection algorithm that analyzes incoming data in real-time. It can then produce a variety of visualizations of the discovered bursts (see Figs. 6.7−6.9) to enable someone to be immediately alerted to it. ESA clusters messages according to their topics so as to provide the person monitoring social media with a useful overview. ESA is also able to identify, in real-time, tweets that indicate specific crisis events, such as fires, through both a set of heuristics and a classifier (Karimi et al. 2013; Power et al. 2013). When encountering tweets that mentions such an event, ESA further processes them to determine if they correspond to an actual crisis event or not, thus helping someone with the problem of finding “a needle in a haystack,” and generating an alert (e.g., an email message with the pertinent information) to the persons monitoring for crisis events. Finally, ESA includes an ability to analyze the tweets retrospectively, for example, to understand trends. ESA is currently being used by a number of organizations, including crisis management agencies.
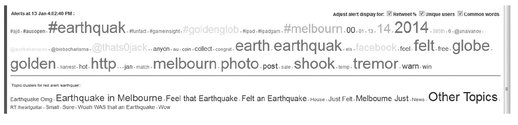
Fig. 6.7: Burst visualization in ESA for a small earthquake in Melbourne in early 2014. The color and size of the word indicates the size of the burst. (Screenshot provided by Bella Robinson and Mark Cameron.)
Fig. 6.8: ESA: Heatmap showing the locations of tweets contributing to a red “christchurch” alert soon after an earthquake was felt there on 18 Nov 2013. (Screenshot provided by Bella Robinson and Mark Cameron.)
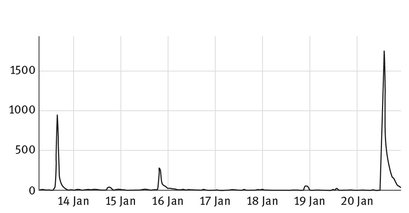
Fig. 6.9: ESA: Hourly volume of “earthquake” tweets early 2014, displayed on a timeline. The first spike corresponds to the earthquake in Melbourne as shown in Fig. 6.7, and the big spike on the right corresponds to an earthquake in Wellington. (Screenshot provided by Bella Robinson and Mark Cameron.)
6.6 Tools for combining, comparing, and correlating tweets with other sources of health information
As highlighted above, in order to curate tweets’ information quality and reliability, their contents need to be combined, compared, and correlated with other sources of health information. But what kinds of methods and tools can we use to accomplish this? Next, we present a summary of Vizie, a CSIRO system that achieves this and refers the reader to more detailed descriptions (Paris & Wan 2011, 2014).
The Vizie social media monitoring tool assists people to be able to monitor information-sharing on all social media platforms (i.e., not restricted to Twitter). This can be for a variety of domains, including health related information, and not necessarily limited to crisis management. In short, health information on social media is not restricted to Twitter or crisis management either. Health information can be shared on other social networking platforms, such as Facebook or MySpace, or specific online communities (e.g., PatientsLikeMe) and forums (e.g., eHealth Forum and Consumers Health Forum of Australia),70 among others. Social media can be monitored for a number of health related issues, such as understanding how people talk about their physical or mental health, the medications they are taking, the treatments they are undergoing, or their diet. Social media can also be used to gauge people’s reactions to the dissemination of official health related reports. The ability to look across various social media channels provides a more holistic perspective of the conversations that are happening on social media. It also enables the tool to compare the information gathered from tweets with other sources of information, thus addressing the information curation issue.
Vizie thus differs from TweetDetector, EventWatch and ESA in two ways: it collects data from all social media platforms, and it is not limited to crisis management. Like TweetDetector, it is query-based – that is, the information seeker needs to provide Vizie with one or more queries, and Vizie will search all incoming social media data for posts related to those queries. To monitor a wide variety of social media platforms, the Vizie system uses a single federated search interface that allows information seekers to understand why information is collected and where (e.g., which social media platform) the content came from. This source identification can be seen as serving information curation purposes in the same way as the aforementioned source classifier. It could be combined with a more general mechanism to classify sources into categories which would include, for example, healthcare organizations, media, and laypersons. Figure 6.10 shows a conceptual representation of the system.
Having collected data, Vizie employs NLP techniques to provide a unified analysis of the aggregated data. It uses keyword and keyphrase detection, with mechanisms based on Kupiec et al. (1995), clustering algorithms, based on keywords or Latent Dirichlet Allocation (LDA) (Blei et al. 2003), discussion summarization (Wan & McKeown 2004), and extractive summarization (Radev et al. 2003). These analysis are coupled with interactive visualizations and interfaces (see Figs. 6.11 and 6.12). Together, they support data exploration and help media monitors find commonly discussed issues across different types of social media. They also enable the cross validation of the information extracted on various channels, helping with information curation.
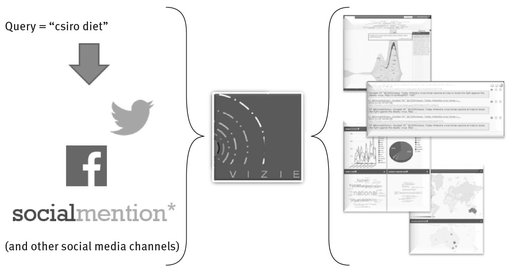
Fig. 6.10: Vizie: collecting and analyzing social media.
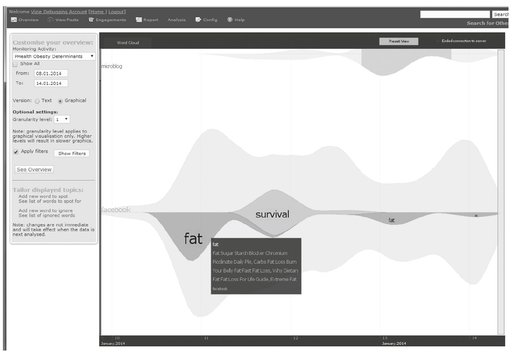
Fig. 6.11: VIZIE: a visual overview of social media about diet (zoomed on the Facebook data)
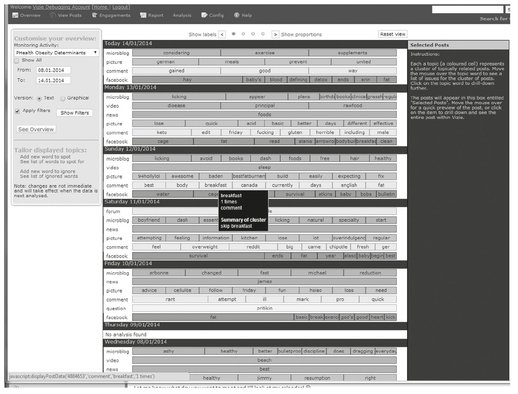
Fig. 6.12: VIZIE: a textual overview of social media about diet for a week.
In addition, the Vizie prototype supports the seeker in deciding whether the content of a post is such that an engagement is required. It does this by assisting with relevance judgments, providing the context that triggers online discussions. This is illustrated in Fig. 6.13, where summary information from the linked document (accessible through the URL) is presented to the user as context for the tweet. Finally, Vizie also includes facilities for search (within the collected data), record keeping (archiving) and reporting.
Like ESA, the tool is being used by a number of organizations. Figure 6.14 shows the number of loggins in Vizie over the past 18 months (Wan & Paris 2014). The top blue line indicates the aggregate logins counts, while all the other lines are the counts for the individual organizations. One of the Vizie customers is an organization with a mandate and commitment to speaking to the broader Australian community on issues of mental health and suicide prevention. The organization produces a report and is interested in finding out how people react to it, or, more generally, how mental health issues are discussed in various communities. They have used the Vizie tool to obtain unique insights into what topics are being discussed and are of interest to a diverse range of groups.
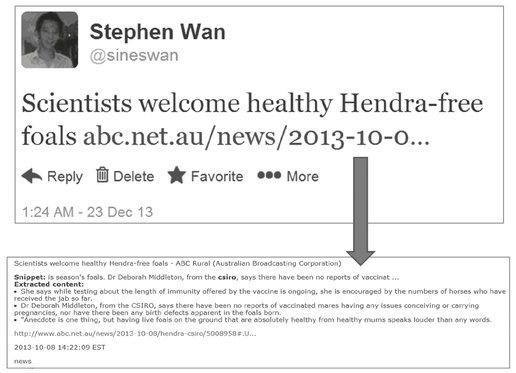
Fig. 6.13: A summary of the news article, linked from the shortened URL, is presented to the information seeker as context to the Twitter discussion – (reprinted from Wan & Paris 2014).
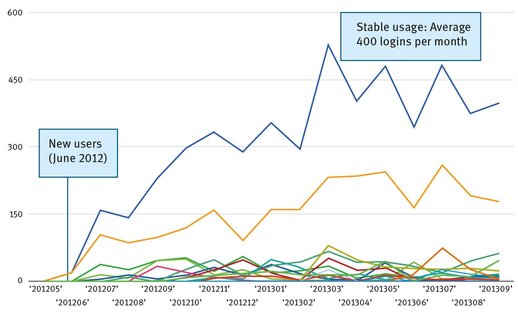
Fig. 6.14: Vizie: number of logins over 18 months (Wan & Paris 2014).
6.7 Discussion
In this chapter, we have illustrated social media as a source of health information and positioned it with other sources. The use of Facebook, PatientsLikeMe, Second Life, Twitter, Wikipedia, YouTube, and other social media over the Internet is widespread among healthcare professionals and laypersons. For example, in 2013, PatientsLikeMe covers 2000 health/medical conditions for its 220,000 users to study, Twitter publishes 400 million messages per day for its 200 million active users, and these tweeters also enter 1.6 billion search queries per day. More generally, if considering the entire Internet, two-thirds of the US adults go on line for health information, almost half of the Australian searches relate to health, and nearly half of the Europeans consider the Web as an important source of health information. In addition to this aspect of offering a vital source of information for learning health knowledge, social media can enable people to interact and support each other emotionally during an illness. Other benefits include helping the society to realize the collective goal of improving healthcare outcomes and policies.
However, these new technologies have limitations too which we have addressed in this chapter by presenting the total of five systems that we have developed (three developed by NICTA, two by CSIRO) to help obtain useful information from social media. The main limitation of social media is its current inability to access and curate relevant information in the ever-increasing gamut of messages. Our systems improve search, summarization, visualization, and curation capabilities, both in real time and retrospectively, with the first four systems concentrating on tweets and the last one monitoring a wide variety of social media platforms. In essence, we have provided a basic recipe for building a search engine for social media and then made it increasingly more intelligent through smarter processing and personalization of the queries, tweets, and search results. We have also addressed the summarization aspect by visualizing topical clusters in messages and further classifying the retrieved tweets into topical categories that serve professionals in their work. Our solutions for information curation are to analyze the information sources and compare tweets against other sources of information.
6.8 Related solutions
We now mention some other solutions to the problem of mining social media for information.
6.8.1 Maps applications for disease monitoring
Mapping disease outbreaks across the world is a common use case in social media applications. For example, Google Flu Trends and Google Dengue Trends track seasonal outbreaks in the world, generating maps of disease activity on a five-point scale (from intense to minimal) by analyzing queries of the Google Search engine in the Internet (Ginsberg et al. 2008).71 The analysis uses keyphrase matching to filter the relevant queries and the geographic location of the information seeker to map them.
HealthMap by the Boston Children’s Hospital, Boston, MA, USA, generates maps of disease outbreaks and warnings as well as surveys emerging threats to public health in real time based on the EuroSurveillance, ProMEDMail, World Health Organization, and eight other publicly available sources in the Internet.72 It monitors a broad range of infectious diseases and, similarly to the Google solutions, the results are public on the Internet. The HealthMap page is also supplemented by the mobile application of Outbreaks Near Me.73
Sickweather, in turn, considers messages and user profiles from Twitter and Facebook in order to track and visualize the prevalence of different illnesses, symptoms, and medical in a given area.74 The connection with the user profiles enables finding sick friends and supporting them, for example, by sending a “get well soon” message.
6.8.2 Maps applications in crisis situations
Maps applications of this kind are also used in crisis situations. For example, in Kenya after the post-election fallout in 2008, 45,000 people used the Ushahidi maps for incidents of violence and peace efforts.75 People reported the incidents on the Internet or using their mobile phones.
The application was used again in January 2010 for an Haitian earthquake (Heinzelman & Waters 2010). This time, people could send information to the system as text messages, which volunteers supplemented with tweets and other social media messages from the Internet. The resulting public maps visualized medical emergencies; trapped people; and needs for shelter, water, food, and other necessities in real time. The United Nations and other authorities used them to conduct direct-assistance tasks such as resource allocation.
These maps applications can be extended to address more advanced modeling of topics. The extensions have been shown to result in a capability to distinguish distinct crisis situations of similar nature in nearby locations (Sumatran earthquake vs. Samoan tsunami), analyze the influenza AH1N1 evolution, as well as, more generally, explore prominent topics (Kireyev et al. 2009; Signorini et al. 2011). Predictive capabilities cover the detection of earthquakes, among other emerging events (Cataldi et al. 2010; Sakaki et al. 2010).
6.8.3 Extraction systems to monitor relationships between drugs and adverse events
Another example use of social media in health care is monitoring adverse drug events (ADEs), referring to injury or harm associated with the use of a given medicine. In terms of their prevalence, ADEs account for approximately 5% of Australian and US hospital admissions, and, among those admissions that result in an inpatient period in the USA, serious ADEs have been reported to occur in nearly 2% of the cases (Bates et al. 1995, 1997; Lazarou et al. 1998; DUSC 2000; Moore et al. 2007). Regardless of all efforts to decrease these percentages and the fact that from one- to two-thirds of all ADEs could be avoided by more careful prescribing and monitoring (Bates et al. 2003), the rates are unfortunately increasing four times faster than the total number of drug prescriptions to outpatients (Moore et al. 2007). If considering the severity of ADEs, in turn, they are within the five most common causes of death in Australian and US hospitals (DUSC 2000; Giacomini et al. 2007).
Next, we summarize two systems that extract relationships between drugs and adverse events from information posted on social media. Both systems are developed to study ADEs as reported by the patients themselves.
The first extraction system uses the comment text, disease name, drug name, and user id related to 3600 user comments for four drugs from the Daily Strength page on the Internet (Leaman et al. 2010).76 The processing studies the 3787 concepts of the Coding Symbols for a Thesaurus of Adverse Reaction Terms (COSTART), developed by the US Food and Drug Administration for post-marketing surveillance of ADEs; 888 drugs linked with 1450 ADE terms from the Side Effect Resource (SIDER); and associations between 10,192 drugs and 3279 ADEs originating from the Canada Vigilance Adverse Reaction Database or Canada MedEffect2 resource for information drugs and health products.77 It begins by coding colloquial phrases and grouping similar or synonymous meanings together manually. This is continued by automated merging of all concepts that contain a term in common into a single unified concept (SUC), dividing comments into sentences, tokenizing the sentences, associating the tokens with their POS tags using Hepple on the Generic Architecture for Text Engineering (GATE), removing the stopwords, and stemming the remaining tokens using the Snowball implementation of the Porter Stemmer.78 Then, the processing scores the similarity between the comments and SUCs. The scoring covers each window of five tokens in the comment and each token in the SUC text. Finally, the scores are used to determine whether a specific concept is present in a given comment as follows: (1) the scores corresponding to this comment and the individual tokens in the SUC text are summed up; (2) the result is divided by the number of these scores; and (3) if this normalized score is greater than a configurable threshold, the respective concept is considered to be present in the comment. The concept extraction performance on two drugs is good: 78.3% of the retrieved comments are relevant to a given drug (i.e., precision of 0.783) and 69.9% of the comments that are relevant to a given drug are retrieved (i.e., recall of 0.699).
The second extraction system aims to identify ADEs from patient-provided drug reviews on health-related pages on the Internet with a focus on cholesterol-lowering drugs (Liu et al. 2011). It extracts side effect expressions followed by the construction of a side effect ontology using the total of 8515 messages that included drug reviews or use experiences from three drug discussion forums in the Internet: askpatient.com, medications.com, and WebDB.com.79 The phrases of the dataset were manually classified into a hierarchical ontology. As a result, the 2314 side effect phrases were categorized into 307 synonym groups, which were furthered grouped into 30 classes. Then, the system was used to extract 7500 shorter text snippets that included the side effect expressions from these phrases. After this, it removed from the snippet collection the 377 stopwords and expressions that did not occur more than five times in the dataset as well as ignored the word order (e.g., the snippets word1 word2 and word2 word1 are equivalent). Finally, the statistical analysis of the remaining 2314 unique snippets gave evidence for a significant correlation between the three drugs and a wide range of disorders and conditions, including amyotrophic lateral sclerosis, arthritis, diabetes, heart failure, memory loss, neuropathy, Parkinson’s disease, and rhabdomyolysis.
6.8.4 An early warning systems to discover unrecognized adverse drug events
As opposed to extracting recorded ADEs from social media to derive statistics on incidence rates, the generation of early warnings has also been studied. The goal is to discover unrecognized ADEs faster and faster in order to warn healthcare professionals and drug consumers. Next, we describe four systems of this kind.
The extraction systems developed by Benton et al. (2011) and Brian et al. (2012) focus on drugs used to treat cancer. The former system uses the Porter Stemmer; Cerner Multum’s Drug Lexicon; Consumer Health Vocabulary; hand-compiled vocabularies for dietary supplements, pharmaceuticals, and ADEs; frequency counts; and co-occurrence analyses.80 Over 20% of the identified ADEs for four most common breast-cancer drugs from 1.1 million anonymized messages posted to eleven breast cancer message boards were new discoveries, that is, not documented on the drug labels. The latter system combines state-of-the-art classification techniques with synonym, negation, semantics analyses; word frequencies; and numbers of hashtags, reply tags, URLs, pronouns, and drug-name mentions. Its evaluation on two billion tweets sent May 2009 to October 2010 gives evidence of its good ability to identify ADEs correctly; over 70% of the detected ADEs were correct.
The demonstration software by Wu and Stanhope (2012) applies to a substantially wider range of medicine (not just cancer drugs). Its goal is also to generate early warnings. The analysis begins by identifying the strength of relatedness between two side effects with each drug. This uses mutual information to measure the amount of information one side effect carries about another (Manning & Schütze 1999). It takes values between zero and one − the larger the values, the stronger the relatedness of the side effects. For example, the mutual information of zero means that the first side effect reveals no information about the other and vice versa. In contrast, the mutual information of one equals to the first side effect carrying all information needed to determine if the other effect also occurs. The analysis is finished by using the values of mutual information in a hierarchical clustering process (Manning & Schütze 1999). This results in a tree structure, where the leaves are single side effects and each node of the tree represents the group that contains all the side effects of its descendants. Similarly to family trees, where immediate descendants correspond to a person’s offsprings and more distant relatives branch farther away, the tree of side effects visualizes the groups and relations between the effects. As examples of closely related side effects, the authors mention Cerebral infarct (i.e., a stoke resulting from issues in blood circulation to the brain) and Status epileptics (i.e., a life-threatening condition, where the brain is in a state of continuous or repetitious seizures), as well as Allergic reaction and Tongue pain. When using the aforementioned SIDER resource and Google discussions together with the medical Web pages of MedlinePlus, Drugs.com, and DailyMed, the system generated the average of 66 side effects per drug for 15,848 unique drugs.81
Another warning system applicable to a wide range of medicine is introduced by Chee et al. (2011). Its goal is to generate a watch list of drugs for further monitoring of their safety by authorities such as the US Food and Drug Administration. The authors assembled a hybrid of Naïve Bayes and other state-of-the-art classification techniques to rank the drugs using specialized lexicons and word frequencies to define the features. The ranking applies a scoring measure defined as:
where c refers to the number of classifier types in the hybrid; f+ to the number of false positives, that is, cases in the evaluation dataset where the hybrid suggests incorrectly that a drug should be added to the watch list; and n to the size of this dataset. Multiplication by c penalizes the computational cost involved in including too many classifier types in the hybrid. The square brings the ability to differentiate the ratios of one false positive for a dataset of size two (i.e., 0.5 reflecting that classification errors are not very severe, because only a small dataset was used in evaluation) from 100 false positives for a dataset of size 200 (i.e., 50, which indicates that the errors are a hundred times more severe because, when as many as 200 cases are considered, half of the predictions are false positives). The system was evaluated on a set of 12 million messages from 7290 public Health & Wellness Yahoo! Groups, including references to four drugs withdrawn from the market.82 The evaluation tested the hypothesis of the hybrid being able to detect the withdrawn drugs even if they are intentionally labeled with the incorrect class (i.e., not to be added to the watch list); evidence for this hypothesis would be reflected in large scores, or equivalently, the hybrid generating many false positives. Indeed, the scores for three out of the four withdrawn drugs were 10.89, 10.89, and 10.24, corresponding to the ranks 4−6 in watch list. However, the fourth withdrawn drug had a low rank of 107 (score 0.04).
6.9 Methods for information curation
In the systems we presented, we have addressed the current inability of social media (in particular tweets) to curate information through a variety of means. This includes the automation of the classification of the information sources; identification of topics (including common topics) in the posts; detection of specific events; as well as combination, comparison, and correlation of tweets with other sources of information. To illustrate how crucial these capabilities are to filter out from search results all but topically relevant and reliable messages, let us to return to the case of the Hurricane Sandy. Even if a given search engine was able to find the relevant tweets from the overflow of 340 million tweets a day,83 false rumors and otherwise incorrect information in 91% of them is clearly a concern.
Others have attempted the automated analysis of the proportion of questions in tweet message chains (Mendoza et al. 2010). The data used in their study is a subset of the over 4.5 million messages on social media that are relevant to the Chilean earthquake in February 2010, killing 723 people and damaging 370,000 homes. More precisely, the study analyzed tweets related to seven confirmed truths and seven false rumors with from 42 to 700 unique messages per case. It reports the results of a content analysis (Stemler 2001), which identified the truth-affirming, truth-denying, and question-posing tweets. As many as 96% of the tweets related to confirmed truths got judged as truth-affirming, less than 4% as questions, and as little as 4% as truth-denying. In contrast, of the tweets related to false rumors, as many as 38% were seen as truth-denying, more than 17% as questions, and only 45% as truth-affirming. That is, false rumors were questioned much more than confirmed truths. This gives evidence for the large proportion of questions in tweet message chains indicating unreliable information.
6.10 Future work
It is clear that social media has become an important channel of communication for everyone, the public, organizations and governments. Social media − the information it contains and the interactions that it enables − can be mined to benefit health care in a variety of ways, for both laypersons and professionals. We have described some systems that exploit social media to identify and monitor health related crisis, to discover adverse side effects of drugs, or to monitor specific topics.
This is only the beginning, as we are most likely to see new applications in the future. The CSIRO work in this area, in addition to what we describe above, has several other research foci. For example, we are looking at attitudes towards depression and suicide in social media, by trying to identify how people react to social media posts that express distress. We are also exploring how people talk about diet-related issues, to see if we can obtain from social media some valuable insights that are similar to those that can be obtained through surveys and interviews. We are also looking at how people might interact and influence each other in healthy living-related online communities. We are seeking to understand how people discuss various topics on social media (Paris et al. 2012) and to learn more about the impact of such communications on medicine, health care, and patients themselves.
In all this work, we have to address the issues mentioned earlier in the chapter, in particular the quantity (and speed) of the information, the noise it contains, and the potential relationships that exist (both within one channel, and across many media channels). In addition, the language employed on social media can be challenging for NLP techniques. Indeed, the language found on social media is usually informal, and often it contains unconventional (and at times colorful) vocabulary, syntax, and punctuations − sometimes through misspellings and sometimes by choice, expressing the creativity of the writer.
Our overall aim is to develop a set of tools to help laypersons, professionals, and public health organizations find accurate and reliable information from social media for a variety of purposes and applications as well as to evaluate them in real tasks. The tools include text classifiers, topic detectors, document summarizers, visualization mechanisms, and social network analyzers.
Acknowledgments
NICTA is funded by the Australian Government through the Department of Communications and the Australian Research Council through the ICT Centre of Excellence Program. NICTA is also funded and supported by the Australian Capital Territory, the New South Wales, Queensland and Victorian Governments, the Australian National University (ANU), the University of New South Wales, the University of Melbourne, the University of Queensland, the University of Sydney, Griffith University, Queensland University of Technology, Monash University and other university partners.
We are thankful for our co-supervised students’ contribution at NICTA. We express our gratitude to our 3rd year engineering student Xing Yu (Frank) Su from ANU for his contribution to developing and evaluating the TweetDetector search engine during his summer scholarship at NICTA in 2010–2011. We thank Frank for continuing this work as his honors project during his 4th year in 2011 together with his team of 3rd year engineering students Kalinga Hulugalle, Peter Walton, and Riley Kidd and mentor David Needham in ANU. We acknowledge the contribution by PhD students Aapo Immonen from the University of Eastern Finland and Karl Kreiner from the AIT Austrian Institute of Technology GmbH to developing and evaluating the NICTA automated classifier for crisis managers during their visits at NICTA in 2011 and 2013.
We acknowledge the contribution of the NICTA team of researchers and engineers behind EventWatch. In particular, we thank Scott Sanner and Wray Buntine from NICTA and ANU for leading this scientific research and development.
For the CSIRO work, we acknowledge the contributions of the CSIRO staff, researchers, and engineers, responsible for the ESA and Vizie prototypes. For ESA, we acknowledge (in alphabetical order) Mark Cameron, Jessie Yin, Andrew Lampert, Sarvnaz Karimi, Robert Power, and Bella Robinson. For the Vizie prototype, we would like to acknowledge in particular James McHugh, Brian Jin, Payam Aghaei Pour and Hassan Asghar for their software engineering work on the prototype, under the guidance of the lead researcher, Stephen Wan. Finally, for both systems, we would like to thank John Colton and all our users for helping us shape the tools and their organizations for contributing to the funding of the research and development towards the tools.
References
Ahlqvist, T., Bäck, A., Halonen, M. & Heinonen, S. (2008) ‘Social media road maps. Exploring the futures triggered by social media’, VTT Tiedotteita − Res Notes, 2454:78.
Allan, J., Aslam, J., Belkin, N., Buckley, C., Callan, J., Croft, B., Dumais, S., Fuhr, N., Harman, D., Harper, D. J., Hiemstra, D., Hofmann, T., Hovy, E., Kraaij, W., Lafferty, J., Lavrenko, V., Lewis, D., Liddy, L., Manmatha, R., McCallum, A., Ponte, J., Prager, J., Radev, D., Resnik, P., Robertson, S., Rosenfeld, R., Roukos, S., Sanderson, M., Schwartz, R., Singhal, A., Smeaton, A., Turtle, H., Voorhees, E., Weischedel, R., Xu, J. & Zhai, C. (2003) ‘Challenges in information retrieval and language modeling: report of a workshop held at the Center for Intelligent Information Retrieval, University of Massachusetts Amherst, September 2002’, SIGIR Forum, 37(1):31−47.
Bates, D. W., Evans, R. S., Murff, H., Stetson, P. D., Pizziferri, L. & Hripsak, G. (2003) ‘Detecting adverse events using information technology’, JAMA, 10(2):115−128.
Bates, D. W., Cullen, D. J., Laird, N., Petersen, L. A., Small, S. D., Servi, D., Laffel, G., Sweitzer, B. J., Shea, B. F., Hallisey, R., Vander Vliet, M., Nemeskal, R., Leape, L. L., Bates, D., Hojnowski-Diaz, P., Petrycki, S., Cotungo, M., Patterson, H., Hickey, M., Kleefield, S., Cooper, J., Kinneally, E., Demonaco, H. J., Dempsey Clapp, M., Gallivan, T., Ives, J., Porter, K., Thompson, B. T., Hackman, J. R. & Edmondson, A. (1995) ‘ADE prevention study group. Incidence of adverse drug events and potential adverse drug events: implications for prevention’, JAMA, 274(1):29−34.
Bates, D. W., Spell, N., Cullen, D. J., Burdick, E., Laird, N., Petersen, L. A., Small, S. D., Switzer, B. J. & Leape, L. L. (1997) ‘The costs of adverse drug events in hospitalized patients. Adverse drug events prevention study group’, JAMA, 277(4):307−311.
Benton, A., Ungar, L., Hill, S., Hennessy, S., Mao, J., Chung, A., Leonard, C. E. & Holmes, J. H. (2011) ‘Identifying potential adverse effects using the Web: a new approach to medical hypothesis generation’, J Biomed Inform, 44(6):989−1006.
Bian, H., Topaloglu, U. & Yu, F. (2012) ‘Towards large-scale Twitter mining for drug-related adverse events’. In Yang, C. C, Chen, H., Wactlar, H., Combi, C. & Tang, X. (program chairs). Proceedings of the 2012 International Workshop on Smart Health and Wellbeing (SHB ’12). New York, NY, USA: ACM.
Blei, D. M., Ng, A. Y. & Jordan, M. I. (2003) ‘Latent Dirichlet allocation’, J Mach Learn Res, 3:993–1022.
Bruns, A., Burgess, J., Crawford, K. & Shaw, F. (2012) #qldfloods and @QPSMedia: Crisis Communication on Twitter in the 2011 South East Queensland Floods. Brisbane, QLD, Australia: ARC Centre of Excellence for Creative Industries and Innovation.
Cameron, M., Power, R., Robinson, B. & Yin, J. (2012) Emergency Situation Awareness from Twitter for Crisis Management. In Mille, A., Gandon, F., Misselis, J., Rabinvich, M. & Staab, S. (general and program chairs). Proceedings of the 21st International Conference Companion on World Wide Web (WWW ’12 Companion). New York, NY: ACM.
CampaignBrief. (2013) Magna Grobal Research Reveals Australian Mobile Internet Access Has Risen by 208% in Three Years. [Online] 8 April Available from: http://www.campaignbrief.com/2013/04/magna-global-research-reveals.html. [Accessed: 15 Dec 2013].
Can, F. (1993) ‘Incremental clustering for dynamic information processing’, ACM Trans Inform Process Systems, 1(2):143−164.
Cataldi, M., Di Caro, L. & Schifanella, C. (2010) ‘Emerging topic detection on Twitter based on temporal and social terms evaluation’. In Proceedings of the Tenth International Workshop on Multimedia Data Mining (MDMKDD ’10). New York, NY: ACM.
Chee, B. W., Berlin, R. & Schatz, B. (2011) ‘Predicting adverse drug events from personal health messages’, AMIA Annu Symp Proc, 2011:217−226.
Cohen, J. (2011) History’s Worst Nuclear Disasters, History in the Headlines. [Online]. 18 March Available from: http://www.history.com/news/historys-worst-nuclear-disasters. Accessed: 15 Dec 2013].
Coiera, E. (2003) Guide to Health Informatics. 2nd edition. London, UK: Arnold Publication.
Colineau, N. & Paris, C. (2010) ‘Talking about your health to strangers: understanding the use of online social networks by patients’, New Rev Hypermed Multimed, 16(1−2):141−160.
Dua, S., Acharya, U. R. & Dua, P., (eds.) (2014) Machine Learning in Healthcare Informatics. Springer Intelligent Systems Reference Library. 56. Heidelberg, Germany: Springer.
Dusc, The Drug Utilisation Sub-Committee. (2000) Australian Statistics on Medicines. Canberra, ACT, Australia: Department of Health and Aging, Australia.
Experian Hitwise. (2008) Google Receives 87.81 Percent of Australian Searches in June 2008. [Online]. Available from: http://www.hitwise.com/au/press-centre/press-releases/2008/ap-google-searches-for-june/. [Accessed: 15 Dec 2013].
Fox, S. (2011) Health Topics: 80% of Internet Users Look for Health Information Online. Technical report, Pew Research Center. [Online] 1 February. Available from: http://www.pewinternet.org/Reports/2011/HealthTopics.aspx. [Accessed: 15 Dec 2013].
Fox, S. & Jones, S. (2009) The Social Life of Health Information. Pew Internet & American Life Project. [Online] 11 June. Available from: http://www.pewinternet.org/Reports/2009/8-The-Social-Life-of-Health-Information.aspx. [Accessed: 15 Dec 2013].
Giacomini, K. M., Krauss, R. M., Roden, D. M., Eichelbaum, M., Hayden, M.R. & Nakamura, Y. (2007) ‘When good drugs go bad’, Nature, 446(7139):975−977.
Gimpel, K., Schneider, N., O’Connor, B., Das, D., Mills, D., Eisenstein, J., Heilman, M., Yogatama, D., Flanigan, J. & Smith, N. A. (2011) Part-of-speech tagging for Twitter: annotation, features, and experiments. In Lin, D. (general chair). Proceedings of the 49th Annual Meeting of the Association for Computational Linguistics: Human Language Technologies: Short Papers − Volume 2 (HLT ’11). Stroudsburg, PA: ACL.
Ginsberg, J., Mohebbi, M. H., Patel, R. S., Brammer, L., Smolinski, M. S. & Brilliant, L. (2008) ‘Detecting influenza epidemics using search engine query data’, Nature, 457:1012−1014.
Griffen, G., Jones, R. & Paris, C. (2012) Strategic implications of social media for emergency management. In Clark, M. & Griffen, G. (eds.). Next Generation Disaster and Security Management. Canberra, ACT, Australia: The Australian Security Research Council.
Gupta, A., Lamba, H. & Kumaraguru, P. (2013a) $1.00 per RT #BostonMarathon #PrayForBoston: analyzing fake content on Twitter. In Proceedings of the eCrime Researchers Summit (eCRS) 2013. San Francisco, CA, USA, September 2013.
Gupta, A., Lamba, H. & Kumaraguru, P. (2013b) Faking Sandy: characterizing and identifying fake images on Twitter during Hurricane Sandy. In Schwabe, D., Almeida, V., Glaser, H., Baeza-Yates, R. & Kaist, S. M. (general and program chairs). Proceedings of the 22nd International Conference on World Wide Web Companion (WWW ’13 Companion). New York, NY: ACM.
Hagar, C. (2006) Using research to aid the design of a crisis information management course. In Proceedings of ALISE SIG Multicultural, Ethnic & Humanistic Concerns (MEH).
Hamm, M. P., Chrisholm, A., Shulhan, J., Milne, A., Scott, S. D., Klassen, T. P. & Hartling, L. (2013) ‘Social media use by health care professionals and trainees: a scoping review’, Acad Med, 88(9):1376−1383.
Heinzelman, J. & Waters, C. (2010) Crowdsourcing Crisis Information in Disaster-affected Haiti. United States Institute of Peace Special Report. Washington DC: United States Institute of Peace.
Karimi, S, Yin, J. & Paris, C (2013) Classifying microblogs for disasters. In Culpepper, S., Zuccon, G. & Sitbon, L. (eds.). Proceedings of the 18th Australasian Document Computing Symposium (ADCS ’13). New York, NY: ACM.
Kireyev, K., Palen, L. & Anderson, K. M. (2009) Applications of topics models to analysis of disaster-related Twitter data. In NIPS 2009 Workshop on Applications for Topic Models: Text and Beyond. Amherst, MA, December 2009.
Kobayashi, M. & Takeda, K. (2000) ‘Information retrieval on the Web’, ACM Comput Surv, 32(2):144−173.
Kreiner, K., Immonen, A. & Suominen, H. (2013) Crisis management knowledge from social media. In Culpepper, S., Zuccon, G. & Sitbon, L. (eds.). Proceedings of the 18th Australasian Document Computing Symposium (ADCS ’13). New York, NY: ACM.
Kummervold, P., Chronaki, C., Lausen, B., Prokosch, H., Rasmussen, J., Santana, S., Staniszewski, A. & Wangberg, S. (2008) ‘eHealth trends in Europe 2005−2007: a population-based survey’, J Med Internet Res, 10(4):e42.
Kupiec, J., Pedersen, J. & Chen, F. (1995) A trainable document summarizer. In Fox, E. A., Imgwersen, P. & Fidel, R. (eds.). Proceedings of the 18th Annual International ACM SIGIR Conference on Research and Development in Information Retrieval (SIGIR ’95). New York, NY: ACM.
Laub, K. (2009) Libyan estimate: at least 30,000 died in the war. The Guardian [Online] 8 September. Available from: http://www.theguardian.com/world/feedarticle/9835879. [Accessed: 15 Dec 2013]
Lazarou, J., Pomeranz, B. H. & Corey, P. N. (1998) ‘Incidence of adverse drug reactions in hospitalized patients: a meta-analysis of prospective studies’, JAMA, 279(15):1200−1205.
Leaman, R., Wojtulewicz, L., Sullivan, R., Sakariah, A., Yang, J. & Gonzalez, G. (2010) ‘Towards Internet-age pharmacovigilance: extracting adverse drug reactions from user posts to health-related social networks’. In Proceedings of the 2010 Workshop on Biomedical Natural Language Processing (BioNLP ’10). Stroudsburg, PA: ACL.
Lim, K. W., Chen, C. & Buntine, W. 2013 ‘Twitter-network topic model: a full Bayesian treatment for social network and text modeling’. In Proceedings of NIPS 2013 Topic Model Workshop. Lake Tahoe, NV, USA, December.
Liu, J., Li, A. & Seneff, S. (2011) ‘Automatic drug side effect discovery from online patient-submitted reviews: focus on statin drugs’. In Proceedings of the First International Conference on Advances in Information Mining and Management (IMMM ’11). Barcelona, Spain, October 2011.
Madoka (2013) Japan Breaks Record for Tweets per Second again with ‘BALS’. japanCRUSH. [online] 5 August. Available from: http://www.japancrush.com/2013/stories/japan-breaks-record-for-tweets-per-second-again-with-bals.html. [Accessed: 15 Dec 2013].
Manning, C. D. & Schütze, H. (1999) Foundations of Statistical Natural Language Processing. London, England: The MIT Press.
Manning, C. D., Raghavan, P. & Schütze, H. (2008) Introduction to Information Retrieval. Cambridge: Cambridge University Press.
Mehrotra, R., Sanner, S., Buntine, W. & Xie, L. (2013) Improving LDA topic models for microblogs via Tweet pooling and automatic labeling. In Jones, G. J. F., Seridan, P., Kelly, D., de Rijke, M. & Sakai, T. (general and program chairs). Proceedings of the 36th International ACM SIGIR Conference on Research and Development in Information Retrieval (SIGIR ’13). New York, NY: ACM.
Mendoza, M., Poblete, B. & Castillo, C. (2010) Twitter under crisis: can we trust what we RT? In Melville, P., Leskovec, J. & Provost, F. (conference chairs). Proceedings of the 1st Workshop on Social Media Analytics (SOMA ’10). Washington, DC: ACM.
Moore, T. J., Cohen, M. R. & Furberg, C. D. (2007) ‘Serious adverse drug events reported to the Food and Drug Administration, 1998−2005’, Arch Intern Med, 167(16):1752−1759.
Moorhead, S. A., Hazlett, D. E., Harrison, L., Carroll, J.K., Irwin, A. & Hoving, C. (2013) ‘A new dimension of health care: systematic review of the uses, benefits, and limitations of social media for health communication’, J Med Internet Res, 15(4):e85.
Nadkarni, P. M., Ohno-Machado, L. & Chapman, W. W. (2011) ‘Natural language processing: an introduction’, J Am Med Inform Assoc, 18(5):544−551.
Paris, C., Thomas, P. & Wan, S. (2012) ‘Differences in language and style between two social media communities’. In Proceedings of the Sixth International AAAI Conference on Weblogs and Social Media (ICWSM ’12). Dublin, Ireland: AAAI Press.
Paris, C. & Wan, S. (2011) Listening to the community: social media monitoring tasks for improving government services. In Tan, D., Begole, B. & Kellogg, W. A. (general and program chairs). Proceedings of the HI ’11 Extended Abstracts on Human Factors in Computing Systems (CHI EA ’11). New York, NY: ACM.
Power, R., Robinson, B. & Radcliffe, D. (2013) Finding fires with Twitter. In Karimi S & Verspoor K. Proceedings of the 2013 Australasian Language Technology Association Workshop (ALTA ’13), Brisbane, QLD, Australia, December 2013.
Price Waterhouse Coopers (2010) Health Leaders Media Breakthroughs: The Impact of Personalized Medicine Today. [Online] April. Available from: http://www.healthlea-dersmedia.com/breakthroughs/250079/The-Impact-of-Personalized-Medicine-Today. [Accessed: 15 Dec 2013]
Radev, D., Otterbacher, J. & H Qi, D. T. (2003) ‘MEAD ReDUCs: Michigan at DUC 2003’. In. Proceedings of the Document Understanding Conference 2003: Workshop on Text Summarization. Edmonton, Canada, May 2003.
Sakaki, T., Okazaki, M. & Matsuo, Y. (2010) Earthquake shakes Twitter users: real-time event detection by social sensors. In Rappa, M., Jones, P., Freire, J. & Chakrabarti, J. (general and program chairs). Proceedings of the 19th International Conference Companion on World Wide Web (WWW ’10 Companion). New York, NY: ACM.
Signorini, A., Segre, A. M. & Polgreen, P. M. (2011) ‘Public concern in the U. S. during the influenza AH1N1 pandemic’, PLoS ONE, 6(5):e19467.
Stemler, S. (2001) ‘An overview of content analysis’, Pract Assess Res Eval, 7(17):1–9.
Su, X. Y., Kidd, R., Hulugalle, K., Walton, P., Suominen, H., Hanlen, L. & Needham, D. (2011a) Tweet Detector Project, Final Presentation. The Australian National University, College of Engineering and Computer Science, Canberra, ACT, Australia, 19 October.
Su, F., Suominen, H. & Hanlen, L. (2011b) ‘Machine intelligence for health information: capturing concepts & trends in social media via query expansion’, Stud Health Technol Inform, 168:150−157.
Sullivan, D. (2010) Where have all the old Tweets gone? Search Engine Land. [Online] 14 January. Available from: http://searchengineland.com/where-have-all-the-old-tweets-gone-33579. [Accessed: 15 Dec 2013].
Suominen, H., Pahikkala, T. & Salakoski, T. (2008) Critical points in assessing learning performance via cross-validation. In Honkela, T., Pöllä, M., Paukkeri, M.-S. & Simula, O. (eds.). Proceedings of the 2nd International and Interdisciplinary Conference on Adaptive Knowledge Representation and Reasoning (AKRR ’08). Porvoo, Finland, 17–19 September 2008.
Suominen, H. & Salakoski, T. (2010) ‘Supporting communication and decision making in Finnish intensive care with language technology’, J Healthcare Eng, 1:595−614.
Sutton, J., Palen, L. & Shklovski, I. (2008) Backchannels on the front lines: emergent use of social media in the 2007 Southern California wildfires. In Fiedrich, F. & Van de Walle, B. (eds.). Proceedings of Proceedings of the 5th International Information Systems for Crisis Response and Management Conference (ISCRAM ’08). Workshop, Washington DC, USA, May 2008.
The Australian (2013) Twitter ‘Can’t Be Trusted in a Crisis’. [Online] 2 December. Available from: http://www.theaustralian.com.au/media/twitter-cant-be-trusted-in-a-crisis/story-e6frg996-1226772527245#. [Accessed: 15 Dec 2013].
The Telegraph (2009) New York Plane Crash: Twitter Breaks the News, again. [Online] 16 January. Available from: http://www.telegraph.co.uk/technology/twitter/4269765/New-York-plane-crash-Twitter-breaks-the-news-again.html. [Accessed: 15 Dec 2013].
Twitter Blog (2011) #numbers, 200 Million Tweets per Day, and The Engineering behind Twitter’s New Search Experience. [Online]. 14 March, 30 June, 31 March. Available from: https://blog.twitter.com/2011/numbers, https://blog.twitter.com/2011/200-million-tweets-day, and https://blog.twitter.com/2011/engineering-behind-twitter%E2%80%99s-new-search-experience. [Accessed: 15 Dec 2013].
Twitter Blog (2012) Twitter Turns Six. [Online]. 21 March Available from: https://blog.twitter.com/2012/twitter-turns-six. [Accessed: 15 Dec 2013].
Twitter Blog (2013) Celebrating #Twitter7 and New Tweets per Second Record, and How! [Online]. 21 March, 16 August. Available from: https://blog.twitter.com/2013/celebrating-twitter7and https://blog.twitter.com/2013/new-tweets-per-second-record-and-how. [Accessed: 15 Dec 2013].
The World Bank (2013) Internet Users (per 100 People). [Online]. Available from: http://data.worldbank.org/indicator/IT.NET.USER.P2. [Accessed: 15 Dec 2013].
Wan, S. & McKeown, K. (2004) ‘Generating overview summaries of ongoing email thread discussions’. In Proceedings of the 20th International Conference on Computational Linguistics (COLING ’04). Stroudsburg, PA: ACL.
Wan S. & Paris, C. (2014) ‘Improving government services with social media feedback’. In Proceedings of the 2014 International Conference on Intelligent User Interfaces (IUI ’2014). Haifa, Isreal, Feb 24–27, 2014.
Wu H. & Stanhope, S. J. (2012) An early warning system for unrecognized drug side effects discovery. In Mille, A., Gandon, F., Misselis, J., Rabinvich, M. & Staab, S. (general and program chairs). Proceedings of the 21st International Conference Companion on World Wide Web (WWW ’12 Companion). New York, NY: ACM.
Yin, J., Lampert, A., Cameron, M., Robinson, B. & Power, R. (2012) ‘Using social media to enhance emergency situation awareness’, IEEE Intell Syst, 27(6):52−59.
Young, A. & Bloor, J. (2009) Medical Twitter. BMJ Careers [Online] 10 June. Available from: http://careers.bmj.com/careers/advice/view-article.html?id#equal#20000214. [Accessed: 15 Dec 2013].