15
Foreign Direct Investment in India in the Post-1991 Period
Sharat Kumar and A. Srija
15.1 Introduction
Consumption (comprising private consumption, public consumption and exports) has been observed to be the main driver of growth in India in the recent years. A question may, therefore, be asked: what is the need for investment? Well, consumption contributes to the growth as long as there are unutilized capacities. Once the full capacity has been reached, a further increase in the production or supply is possible only when fresh investments are made and additional capacity is created. Typically, the rule of full capacity and utilization may not apply so strictly to agriculture, where good or bad weather conditions may hold the key to a higher or a lower output and growth. The other sectors of manufacturing, construction and services may also get affected from the consequent increase or fall in the demand for their products, emanating from conditions prevailing in the agriculture sector.
Investment, nonetheless, augments the capacity of agriculture and allied sectors as well for the higher output, and reduces their dependence on nature. Investment is, similarly, necessary for increasing the production in the other sectors of manufacturing, construction and trade and services. The target of doubling the (average) per capita income over the next 10 years, on the assumed population growth rate of 1.6 per cent per annum, can be achieved if the real GDP growth equals 8.7 per cent over the two five-year plan periods. This calls for stepping up, significantly, the rate of investment in the economy.
The growth rate, in turn, depends not only on the ratio of investment to GDP, but also on the Incremental Capital Output Ratio (ICOR). The ICOR for the eighth and the ninth plans in the Indian economy was observed to be equal to four. The saving— investment requirement for an 8 per cent, real GDP growth annually, (<8.7 per cent mentioned above) works out to 32 per cent of the GDP, that is,
Since Gr = s/k × 100,
or s = Gr × k × 100,
or s = 0.08 × 4 × 100 = 32 per cent,
where Gr = growth rate,
s = average propensity to save/rate of investment,
k = ICOR.
The investment is made possible through the savings out of the income of the previous year or years. The domestic savings in the economy during the ninth plan was in the range of 24–26 per cent of the GDP. This leaves a gap of 6 per cent. On the presumption that the savings rate in the economy would reach 29.2–29.8 per cent of the GDP during the Tenth Five Year Plan, this still leaves a gap of 2.8–2.2 per cent for the required 32 per cent investment. This can be admirably bridged through foreign savings and foreign investment.
15.1.1 Foreign Savings and Investment
The foreign savings comprise of NRI deposits, external assistance (multilateral and bilateral), External Commercial Borrowings (ECB) and foreign investment flows, which form a part of the capital account on the Balance of Payments (BoP). The foreign investment flows are of two types, namely, portfolio investment and direct investment. The NonResident Indian (NRI) deposits as a source of foreign savings are subject to volatility on account of the interest rate changes and changes in the rate of foreign exchange. External assistance to India from both the multilateral and bilateral sources has been declining over the years. The ECB imposes a definite servicing burden, including both the interest and the principal, irrespective of the profitability of the investment. These form a part of the debt profile of the country, and the international financial institutions closely monitor their payment and repayments. The Foreign Portfolio Investment (FPI), on the other hand, involves regular outflows on account of the dividend payments, which depend on the profitability of the investment with no fixed principle of repayment schedule. However, they are volatile, and tend to be procyclical in the sense that they come when the BoP position is seen to be strong, and go out when the BoP position is expected to weaken.
15.1.1.1 ECB and FPI A comparison between the ECB and the FPI shows that ECB involves the loan denominated in the foreign currency, so that the borrower takes the risk. In the case of FPI, the investor takes the risk since the investment in the securities is in the local currency (Rupees). Moreover, while the FPI may come by way of acquisition of shares and stocks, both in the secondary and primary markets, the ECB is generally linked to new and Greenfield investment, and can be directed to particular sectors through regulation.
15.1.1.2 FDI and FPI The Foreign Direct Investment (FDI) is thus preferred over other forms of foreign savings and investment, since it is neither volatile, as FPI, nor is it debt creating as ECB. Yet another argument in favour of the FDI is that it not only makes up for the deficiencies in the availability of savings in the domestic economy, but also makes up for the weakness in the domestic entrepreneurial capacity. The other advantages attributed to the FDI emanate from the introduction of modern technologies in the host economy and creating a market access for export.
The transnational companies (TNCs and MNEs) are the driving force behind foreign direct investment. They have large internal (inter-firm) markets, access to which is available to only to affiliates. They also control large markets in unrelated parties, having established brand names and distribution channels spread over several national locations. (Planning Commission Report of the Steering Committee Group on FDI, 2002)
15.1.2 Crowding-In and Crowding-Out Impacts of FDI
Generally speaking, while the investments in the export sector encourage downstream production, investments in the infrastructure encourage upstream production. Crowding-in is said to take place when the investment stimulates new investment in downstream or upstream production. The FDI, when made in the export or infrastructure sectors, may thus have a crowding-in impact, leading to an increase in both the upstream and downstream production.
However, situations could be contemplated when FDI may lead to crowding-out impacts. This may happen if FDI comes in sectors in which the the domestic firms were themselves keen on investing, but give up on account of foreign investment. The crowding-out may also occur if the foreign firms raised funds in the host country for their expansion programmes by out-competing the domestic firms in the financial market. Similarly, if FDI comes through Mergers and Acquisitions (M&A), that is, through acquiring the shares in an existing (domestic) company or through mergers with a domestic company, this might lead to a diversion of demand for inputs from the domestic suppliers to foreign suppliers and sister companies abroad. This may thus lead to a crowding-out impact in the host economy. In a more indirect way, FDI leads to a crowding-out impact through the appreciation of exchange rates. The large capital inflows (including FDI) lead to greater reserves of foreign exchanges, appreciating in the process the exchange rate of the domestic currency vis-à-vis the other currencies. This makes the host country’s export less competitive and leads to a consequent fall in the exports with the attendant adverse impact on the downstream production.
In view of the double-edged nature of the FDI, namely, the crowding-out and the crowding-in effects on the domestic industries, the host economy may impose some kind of performance requirements binding on FDI vis-à-vis—(1) local content, (2) export commitment, (3) technology transfer, (4) dividend balancing and (5) foreign exchange neutrality. These regulations are put in place to enhance the quality of the FDI against the simple increase in the quantity of FDI inflow. The imposition of performance criteria, however, comes in the way of the relative openness of the trade regime and makes FDI less attractive for MNEs, while deciding the location for their operations. In other words, a trade-off is involved between the performance and openness.
15.1.3 Foreign Investment and BoP in India
Although the decisions for foreign investment are made at the corporate and firm levels, and the gains and losses are those of the investors, a situation can be contemplated whereby private viability may co-exist with the running down of the country’s foreign exchange reserves. This may be so, since the private sector firm may evaluate its performance in terms of the domestic currency and domestic prices, and not on the basis of the currency in which the liabilities have been incurred. Moreover, since the Rupee is a non-convertible currency on the capital account, the government has to follow a prudent policy vis-à-vis the Current Account Deficit (CAD) on the BoP.
With regard to the policy on CAD, the following observations are, therefore, worth mentioning:
Prior to the economic reforms, when foreign investment was virtually non-existent, the sustainable CAD for India was estimated to be about 1.4 per cent of the GDP With the liberalization of external trade and investment, this figure has risen quite sharply, since foreign investment does not carry the same level of systemic risk as external debt. Nevertheless, there are two factors to be taken into account. First, foreign investments tend to require a higher rate of return than the interest rate on debt over the longer run. Therefore, it would not be prudent to raise the CAD target too much unless there is sufficient confidence in being able to maintain relatively high growth rates of exports over an extended period. Second, a distinction has to be drawn between FDI and FPI in terms of their effects on the economy. (Planning Commission, Tenth Five Year Plan, 2002)
15.2 Foreign Investment in India in the Reform Period
The changing composition of the external capital inflows to India in the post-1991 period may be seen from Table 15.1. The RBI has categorized the external inflows as debt-creating and non-debt creating. In the initial phase of the reform period, there was a decline in the debt creating inflows and an increase in the non-debt creating inflows. The share of non-debt creating inflows increased from a low of 1.5 per cent in 1990–91 to 117.5 per cent in 1995–96, and by the end of the 1990s was at 67.8 per cent of the total external capital inflows. However, in the new millennium, the share of the non-debt creating inflows shows a mixed trend.
The debt-creating inflows, which formed 83.3 per cent of the total external inflows during 1990–91, steadily declined during the 1990s and by 2002–03 the inflows turned negative. However, by 2004–05, the share of debt-creating inflows bounced back to 35.2 per cent and by 2006–07, the share of the debt-creating and the non-debt creating inflows was almost at par.
Assessing the performance of the individual components of the inflows, it appears that even after 16 years of reform there has been no accelerated increase in the FDI inflows. The FDI results in asset creation and employment generation within the economy. The performance of portfolio investment, which is just hot money whose inflows are guided by the exchange rate of the economy, also shows a mixed trend.
As a result of the opening up of the economy, India’s dependence on the external aid shows a significant decline. The share of external assistance in the total inflows declined from 31.3 per cent in 1990–91 to 4 per cent in 2006–07. The ECB faced a lull period between 2001–02 and 2003–04. With more and more Indian corporates accessing the equity abroad, the share of the ECBs in the total external inflows increased to 36.5 per cent in 2006–07. Another major capital inflow component during the pre-reform period was the NRI deposits. In the post-reform period, the NRI inflows show a declining trend. It could be because the NRIs must be opting to invest in the Indian equity floated abroad.
India follows the internationally accepted definition of the FDI. According to the IMF, FDI is the category of international investment that reflects the objective of obtaining a lasting interest by a resident entity in one economy and an enterprise resident in another economy. The FDI therefore, includes equity capital, acquisition of shares, reinvested earnings (retained earnings of FDI companies) and other direct capital (inter-corporate debt transactions between related entities).
TABLE 15.1 Consumption of External Inflows

PR: Partially revised.
P: Provisional.
*: Data on FDI have been revised since 2000–01 with expanded coverage to approach the international best practices. The FDI data for previous years would not be comparable with these figures.
#: Refers to medium- and long-term borrowings.
@: Including NR (NR) Rupee deposits.
^: Includes leads and lags in the exports (difference between the custom and the banking channel data),
banking capital (assets and liabilities of banks excluding NRI deposits), loans to non-residents, Indian investment abroad and India’s subscription to international institutions and quota payments to IMF.
+ : Stable flows are defined to represent all the capital flows excluding the portfolio flows and the shortterm trade credits.
Source: RBI Annual Report (Various Issues).
The FDI is permitted through four routes, namely—(1) the FIPB route requiring the approval of the government of India, the Department of Industrial Policy and Promotion, (2) the RBI automatic route, (3) the NRI investment and (4) the cross-border M&A (see Annexures 1 and 2).
In the initial years of reform, much of the FDI inflow was coming in with the government approval (Table 15.2). But with 100 per cent FDI being permitted in most of the sectors, the FDI inflows through the RBI automatic route started increasing, especially since 2004–05. The NRI investment had almost waned by 2001–02. Two other significant sources of the FDI inflows are equity capital investment in the unincorporated bodies and reinvested earnings, both of which are supposed to be free of bureaucratic hassle. Another important source of FDI is the acquisition of shares in the Indian corporates by the foreign entities. From Table 15.2, it may be seen that the FPI has supplemented FDI in the years when there has been a shortfall in FDI inflows. Among the FPI, the Global Depository Receipts and the American Depository Receipts have seen a significant increase in 2005–06 and 2006–07. The Foreign Institutional Investment, as expected, has maintained a fluctuating trend.
15.3 FDI: Sources and Direction
15.3.1 Sources and Origin of Foreign Direct Investment
From August 1991, when India first permitted the FDI, to August 2007, $61 billion1 of FDI has flowed into the country from more than 100 countries. But, significant investment inflows have been from the 10 most important economies (Table 15.3). Mauritius has always been on the top. This is because Mauritius is really a conduit for the investors from various countries, including the United States, because of the double taxation treaty that India has signed with Mauritius—granting an exemption from the Indian taxes to the Mauritius-based companies.
15.3.2 Direction of Foreign Direct Investment
Sector-wise 10 main industries have received the maximum FDI inflows (Table 15.4). But, the share of these sectors in the total FDI inflow, has switched positions during the last 16 years. Initially, it was the basic infrastructure industries that were on the top, receiving the maximum FDI inflow. But by 2007, the emphasis is slowly shifting to the services, and the light manufacturing sectors.
15.4 India’s Share in Global FDI Inflows
The global FDI inflows increased by 171 per cent, between 1997 and 2006 (Table 15.5). Much of these inflows have taken place in the developed world, where the FDI inflows increased by 218 per cent during this period, as compared to only 96 per cent increase in the developing economy. Among the developing economies, the major inflow is into China, though China’s share in global FDI inflows shows a decline in 2005 and 2006. In China, the FDI inflows increased by 57 per cent, between 1997 and 2006. In India, a big increase in the FDI inflow was noticed in 2006. For the first time, India managed a 1 per cent share in the global FDI inflows in 2006.
TABLE 15.2 Foreign Investment Inflows into India (in US Million Dollars)
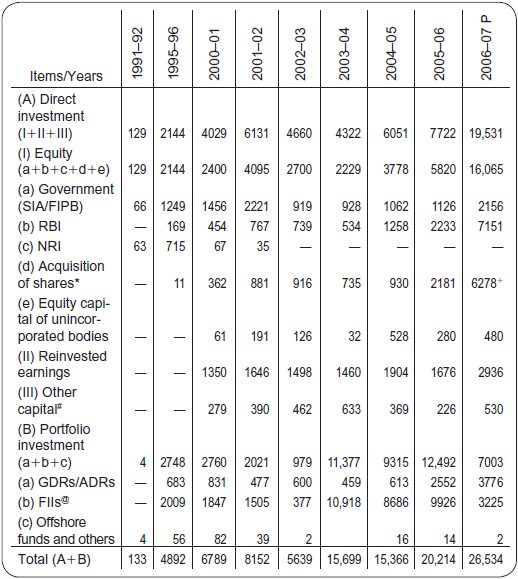
P: Provisional.
—: Nil/Negligible.
*: Relates to acquisition of shares of Indian companies by non-residents under Section 6 of the FEMA, 1999.
+: Include swap of shares of US$ 3.1 billion.
#: Data pertain to inter-company debt transactions of FDI entities.
@: Data represents a net inflow of funds by FIIs.
Note: 1. Data on the reinvested earnings for 2005–06 and 2006–07 are estimates.
2. Data on the foreign investment presented in this table represent inflows into the country, and may not tally with the data presented in the other tables. They may also differ from the data relating to net investment in the stock exchanges by the FIIs.
Source: RBI Annual Report (various issues).
TABLE 15.3 Year-wise FDI Inflow and Percentage Share of Top Ten Investing Countries (in Million Rupees)
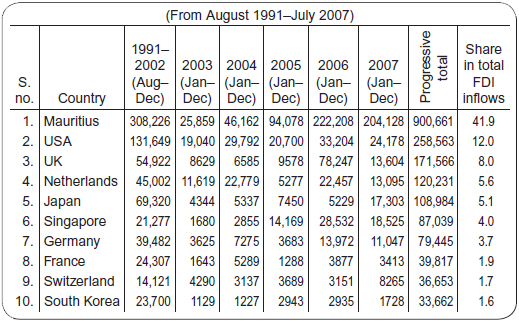
Note: The country specific amount includes the inflows received through SIA/FIPB route, the acquisitions of the existing shares, and RBI’s automatic route only.
Inflows through ADRs/GDRs/FCCBs, against the FDI approvals have not been included.
Source: SIA Publication, Department of Industrial Policy and Promotion, Government of India.
TABLE 15.4 Sectors Attracting Highest FDI Equity Inflows (Rupees in Crore)

Source: Department of Industrial Policy and Promotion, Government of India.
TABLE 15.5 FDI Inflows by Host Regions and Economies (in Billion Dollars)
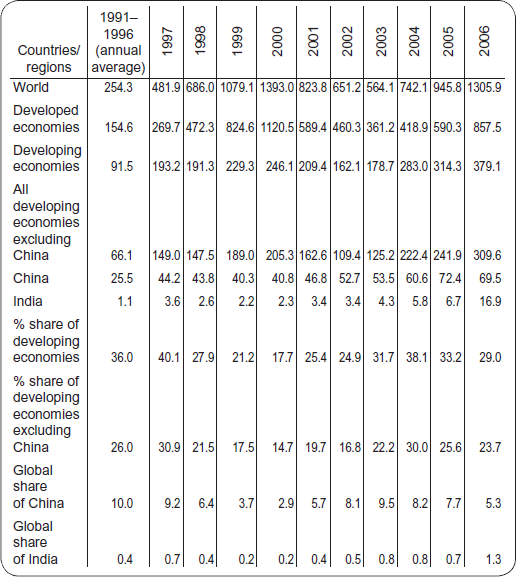
Source: World Investment Report Series, UNCTAD.
15.5 Conclusion
According to the IMD World Competitiveness Yearbook 2007, India, China, Russia, the Slovak Republic, Estonia, Sweden, Austria, Australia, Switzerland, Denmark and Hong Kong have displayed a strong improvement in their competitiveness performance in the recent years. India’s competitiveness ranking is reported to have increased from 50 in 2003 to 27 in 2007. The World Economic Forum’s Business Competitive Index (which measures the quality of business environment) puts India ahead of China, at 31 in 2005–06 but in the Global Competitiveness Index, India is lagging behind China at 48 in 2007–08.
Amongst the emerging and the developing economies, the case of China is indeed spectacular. One fallout of greater FDI inflows to China has been that of a greater accumulation of the dollar reserves. China is, moreover, said to have pursued an export-led growth, and enjoys trade surplus with the rest of the world, especially the United States. On the basis of the market forces, the Yuan should appreciate vis-à-vis the other countries. Its exchange rate is, however, pegged to the dollar, and is not allowed to rise for the fear of the possible backlash on the exports.
It is equally important to realize that the countries from where FDI mostly originates, namely, the United States, the UK, Germany and Japan, are also the countries that are the highest recipients of the FDI inflows. An examination of the US policy towards FDI shows that apart from having a more open policy (although restrictions hold good for the sensitive sectors), it accords importance to aspects such as—(1) law and order and rule of law, (2) good infrastructure and (3) lower tax regime—in that order.
According to the World Investment Report, 2004, as high as 60 per cent of the world FDI stock (around $4 trillion) is going into the service sector. Services, in general, are not tradable goods. The principal way to bring services to the foreign markets, therefore, is through FDI. A more liberal policy towards services, namely, banking, insurance and trading, can hopefully lure more FDI into the country. It has also been argued that FDI may be looked up to, not only for bringing in additional resources, but also for the entrepreneurial function they perform. Significantly, of the 421 TNCs and MNEs operating in India, a large number belongs to the Fortune 500 companies. Perhaps, the wisest course for augmenting the FDI inflows into India is to woo the MNEs to expand their operation in India.
Annexure 15.1
Institutional Set-Up of Government Approval for Foreign Investment
A foreign company or investor willing to set up business in India can do so:
- By setting up an Indian company under the Companies Act 1956, either as a joint venture or as a wholly-owned subsidiary. A foreign investor can set up a wholly-owned Indian subsidiary, only in sectors that are opened to 100 per cent FDI.
- As a foreign company in the form of a project office, liaison office, representative office or branch office.
A liaison office acts as a channel of communication between the principal place of business or the head office and the entities in India. A liaison office cannot undertake commercial activity directly or indirectly, and cannot, therefore, earn income in India. Its role is limited to collecting information about the possible market opportunities, and providing information about the company and its products to the prospective Indian customers. It can promote the export and import to and from India, and also facilitate the technical and financial collaboration between the parent company and the companies in India.
The project or site offices are set up by the foreign companies, planning to execute specific projects in India. They are temporary in nature. Such offices cannot undertake or carry on activities other than the activities relating and incidental to the execution of the project.
The foreign companies engaged in the manufacturing and trading activities abroad are allowed to set up branch offices in India for the following purposes: (1) Export and import of goods, (2) rendering professional or consultancy services, (3) carrying out research work, in which the parent company is engaged, (4) promoting technical or financial collaborations between the Indian companies and the parent or overseas group company, (5) representing the parent company in India and acting as buying and selling agents in India, (6) rendering services in information technology and development of the software in India, (7) rendering technical support to the products, supplied by the parent and group companies and (8) foreign airline and shipping company.
A branch office is not allowed to carry out manufacturing activities on its own, but is permitted to sub-contract these to an Indian manufacturer. The branch offices established with the approval of the RBI may remit profit of the branch outside India, net of applicable Indian taxes and subject to the RBI guidelines. The permission for setting up foreign companies is granted by the RBI.
The FDI may be channelled into India through two routes, namely:
- Automatic Approval by RBI: The FDI in new ventures, where 100 per cent foreign equity is allowed to fall under the automatic route except the following.
- All proposals requiring industrial licensing.
- Proposals in which the foreign collaborator has an existing tie-up.
- All proposals relating to the acquisition of shares in an existing Indian company by a foreign and NRI investor.
- All proposals falling outside the notified sectoral policy and caps or under the sectors in which FDI is not permitted.
For bringing in FDI under the automatic route in the existing companies with an expansion programme, the additional requirements are that of:
- The increase in equity must result from the expansion of the equity base of the existing company, without the acquisition of the existing shares by the NRI and the foreign investors.
- The money to be remitted should be in foreign currency.
- The proposed expansion programme should be in sectors under the automatic route.
No prior approval from the RBI is required. However, the investors are required to notify the concerned regional offices of the RBI of the receipt of inward remittances within 30 days of such a receipt, and will have to file the required documents with the regional office of the RBI concerned, within 30 days after the issue of shares to the foreign investors.
- FIPB Route: All the other proposals that are not covered under the automatic route require the government approval through the Foreign Investment Promotion Board (FIPB). The secretary, Department of Economic Affairs, chairs the FIPB and the secretary, Commerce, DIPP and External Affairs (Economic Relations) are its members. The board may be able to co-opt other secretaries to the government of India and the top officials of the financial institutions, banks and professional experts of the industry and commerce, as and when necessary. The board meets every week, and the proposals submitted to the FIPB are cleared in a time frame of six to eight weeks.
- Investment Policy for Non-resident Indians: To make the investment options attractive for the NRIs, a number ofsteps are being taken by the government. Some ofthe investment schemes presently available to the NRIs include—the facility to invest up to 100 per cent equity with full benefits of repatriation of the capital invested and the income accruing thereon, in high priority industries mentioned in Annexure 3 to the Industrial Policy of 1991; 100 per cent in export-oriented units, sick units under revival, housing and real estate development; the NRIs, the PIOs, and the OCBs are also permitted portfolio investments through the secondary markets. In terms of the relaxations announced in 1998–99, investment limits for an individual NRI have been revised upwards from 1 to 5 per cent, and aggregate portfolio investment limits by all the NRIs have been increased from 5 to 10 per cent of the issued and paid-up capital of the company (aggregate investment limits separate from and exclusive of FII portfolio investment limits).
- Portfolio Investments from Foreign Institutional Investor: The scheme for attracting portfolios from the Foreign Institutional Investors (FIIs) has been operational since September 1992. Under this scheme, the FIIs, including institutions such as the pension funds, the mutual funds, investment trusts, the asset management companies, the nominee companies and the incorporated and institutional portfolio managers, or their power of attorney holders, are allowed to invest in all the securities traded on the primary and secondary markets. Such portfolio investments by the FIIs are subject to the following investment ceilings, namely: (1) Individual FII/sub-account: 10 per cent of the issued and paid-up capital in a company, and (2) aggregate by all the FIIs: 24 per cent of the issued and paid-up capital in a company. The aggregate ceiling for FII portfolio investments, through the secondary market could be raised beyond the normal level of 24 per cent of the sectoral cap and statutory ceiling as applicable, subject to the compliance with the special procedure prescribed.
Annexure 15.2
FDI Policy of India
The FDI policy is reviewed on a continuous basis, and changes in the sectoral policy and sectoral equity caps are notified by the Government of India periodically. The FDI up to 100 per cent is allowed in all the sectors and activities under the automatic route, except for the following where prior approval of the government is required.
- Manufacture of cigars and cigarettes from tobacco and manufactured tobacco substitutes.
- Manufacture of electronic aerospace and defence equipments of all types.
- Manufacture of items exclusively reserved for the small-scale sector, with more than 24 per cent FDI.
- Proposals in which the foreign collaborator has the existing financial and technical collaboration in India in the same field.
- All the proposals falling outside the notified sectoral policy and caps.
Apart from these, in certain sectors, the FDI of up to 100 per cent is allowed, subject to the sectoral regulations as may be seen in Annexure 3.
ANNEXURE 15.3 Sector Specific FDI Equity Limits

References
Ahluwalia, M. S. (1995). The challenges of managing a more open economy. Babu Memorial Lecture, 1995 (mimeo). New Delhi.
A. T. Kearney, Inc. (2001). FDI confidence audit: India. Virginia, USA: Global Business Council, Alexandria.
Bhoi, B. K. (2000). Merger & acquisition: An Indian experience. Occasional Papers, Reserve Bank of India, 21(1).
Chopra, C. (2003). Foreign investment in India: The emerging scenario. New Delhi: Deep & Deep Publications Pvt. Ltd.
Confederation of Indian Industry (CII). (2002). From crumbs to riches: Reorienting foreign direct investment in India. New Delhi.
Federation of India Chambers of Commerce and Industry (FICCI). (2001). The experience of foreign direct investment in India. New Delhi.
Government of India. (2002). Investment in India 2002. New Delhi: Department of Industrial Policy and Promotion, Ministry of Commerce and Industry.
Government of India. (2002). Indian special economic zones: Investor’s guide, 2002. New Delhi: Department of Industry Policy and Promotion, Ministry of Commerce and Industry.
Government of India. (2001). Approach paper to the Tenth Five Year Plan (2002–07). New Delhi: Planning Commission.
Government of India (2002). Report of the steering group on foreign direct investment, 2002. New Delhi: Planning Commission.
Government of India (2002). Tenth Five Year Plan (2002–07). New Delhi: Planning Commission.
Kumar, N. (2002). Globalization and the quality of foreign direct investment. New Delhi: Oxford University Press.
McKinsey and Company. (2001). Achieving quantum’s leap in India’s FDI. New York: McKinsey Global Institute.
National Council of Applied Economic Research (NCAER). (1998). Foreign direct investment in India. March 1998, New Delhi: NCAER.
Patnaik, P. (1994). Investment and growth in a liberalized economy. Lecture at LBSNAA, June 1994 (mimeo) Mussoorie.
Reserve Bank of India (RBI) (2002). Report of the Committee on Compilation on Foreign Direct Investment in India. RBI Bulletin, August 2003. Mumbai.
UNCTAD. (1997). World Investment Report-1997: Transnational Corporations, Market Structure and Composition Policy. New York: United Nations.
UNCTAD. (1998). World Investment Report 1998: Trends and Determinants. New York: United Nations.
UNCTAD. (1999). World Investment Report 1999: Foreign Direct Investment and the Challenge of Development. New York: United Nations.
UNCTAD. (2000). World Investment Report, 2000. New York: United Nations.
UNCTAD. (2001). World Investment Report, 2001. New York: United Nations.
UNCTAD. (2002). World Investment Report, 2002. New York: United Nations.
UNCTAD. (2003). World Investment Report, 2003. New York: United Nations.
UNCTAD. (2004). World Investment Report, 2004. New York: United Nations.