14
Trends and Patterns of Merchandise Exports and Imports of India in the Post-Liberalization Era
Manu J. Vettickan and R. Anil Varma
14.1 Introduction
The process of trade liberalization and the market-oriented economic reform that started in the early 1980s intensified in the 1990s. During the past 15 years, the Indian economy has become substantially more integrated to the world economy. The focus of these reforms has been on liberalization, openness, transparency and globalization with a basic thrust on the outward orientation and on the export promotion. The philosophy behind the economic reforms was that the role of the government in making decisions on resource allocation should be minimized. It was prophesied that this would not only lead to the growth and diversification but also to the upgrading of the production structure, facilitated by the imported technology and improved skills enhanced by trade. It is asserted that trade liberalization would help in the diversification of the structure of the exports and output in favour of the manufactured goods. Has it happened? If it did, has it been accompanied with the growth of manufacturing value added and the structural change in exports and output? To what extent have the objectives of reform been achieved? This chapter seeks to explain all these probes in the light of the external sector performance over the last 15 years. The introduction part is followed by an evaluation of the main aspects of India’s Foreign Trade Policy (FTP) since the reforms. The following section analyses the trends and patterns of the exports and imports and the direction of trade in some detail. The final session summarizes the important observations made from the analysis.
The Indian trade policy can be widely divided in to three periods—an initial period of export pessimism or a period of ‘indiscriminate’ import substitution policy (1956–65), a later period of gradual transformation from the protectionist policies to the liberal policies with some incentives to exports, with a transformation from the indiscriminate import substitution to ‘efficient’ import substitution (1965–1990), and a more recent period of liberalization in the economic policy, especially after the economic reforms, which replaced the erstwhile inward-looking strategy with an outward-oriented development strategy (1991—till date).
14.2 Policy Changes in the 1990s
The impact of excessive controls and regulations on the overall performance of the economy and the grounds on which the idea of the economic reforms in India is supported are well documented in a number of studies. (Bhagavathi and Desai, 1970; Bhagavathi and Sreenivasan, 1975; Jha, 1980; Dhar, 1990; Ahluwalia, Montek, S., 1994). The inward-looking policies resulted in limited Indian participation in the world markets. It resulted in a high level of protection to domestic industries with an anti-agricultural bias, and paid little attention to an export-led growth. The collapse of the world’s leading centrally planned economy of the USSR undermined India’s faith in the inward-looking policies followed till 1990. The political developments and the Gulf crisis during 1990–91 in the context of the fragile BoP situation culminated in a payment crisis of unprecedented dimension in the first quarter of 1991–92. The forex reserves declined to a level, barely enough to finance the import requirements of merely three weeks. A high rate of inflation much above 10 per cent raised serious concerns on the macro economic stability of the Indian economy. The gross fiscal deficit had grown to about 10 per cent of GDP. The current account deficit increased to the tune of 3.2 per cent of the GDP in 1990. The debt GDP ratio which increased through the 1980s reached almost 60 per cent by the 1990s. The large scale withdrawal of the NRI deposits in the expectation of an imminent devaluation made the economy highly vulnerable to external shocks. An analysis by Willem Buiter and Urjit Patel (1992) showed that unless corrective steps were taken, India faced fiscal insolvency. All these factors helped the reform policies to be politically acceptable. The fear of being left behind China, which presented a sustained growth record since its 1978 economic reforms, also made the new economic policy domestically saleable.
The new government, which assumed office on June 1991, promptly took corrective steps to restore international confidence and announced a comprehensive adjustment package involving excahange rate adjustment, fiscal correction and structural reforms. The Rupee was devalued by 22.8 per cent. Various budgets and the Export-Import (EXIM) policy announcements since the 1990s carried forward the trade policy reforms. These policy measures liberalized India’s trade regime by eliminating the Quantitative Restrictions (QRs) on intermediate or capital goods imports and lowering tariffs. The Rupee was made fully convertible against the current account in 1993. The multilateral commitments of the country to the World Trade Organization along with the unilateral policy initiatives facilitated a greater integration of the domestic economy with the world economy. Numerous incentives to encourage the FDI have been undertaken. The five-year EXIM policy for 1992–97 was announced in March 1992 with a view to stimulate exports and facilitate imports of the essential inputs as well as the capital goods (Srinivasan, 2001). The SEZs were designed to overcome the limitations of the Export Promotion Zones (EPZs) and to attract foreign investments to India. In August 2004, the government announced a new FTP for the period 2004–09. The main objective of the FTP is to double India’s percentage share of global merchandise trade by 2009, and to act as an effective instrument of economic growth by giving a thrust to the employment generation, especially in the semi-urban and rural areas. Today foreign trade is looked upon as the engine to further economic acceleration.
Figure 14.1: India’s Share in the World Merchandise Trade

Source: IMF, Direction of Trade Statistics.
14.3 India and Global Trade
India’s exports and imports were US$ 18.14 billion and US$ 24.07 billion, respectively, in 1990–91. The exports reached US$ 177.5 billion in 2008 to become the 27th leading merchandise exporter, and the imports reached US$ 293.4 billion to become the 16th leading merchandise importer of the world. India’s share in the world merchandise exports, after rising from 0.5 per cent in 1990 to 0.8 per cent in 2003, reached 1.1 per cent in 2005 (International Trade Statistics, 2007: 12) (Figure 14.1). This increase was due to the rise in India’s exports growing at more than double the rate of growth of world exports since 2005. India’s significant export growth in the first decade of the 21st century was on account of a host of favourable external developments and domestic policy initiatives. The trade in services has been growing faster than the merchandise trade. The share of services in the total external trade increased from 21.5 per cent in 1990 to 27.4 per cent in 2006. As per the latest trade data published by the WTO, India’s total service exports stood at US$ 102.6 billion to become the 9 th leading service exporter with a share of 2.7 per cent of the world service exports. India ranks 13 among the leading service importers with a share of 2.4 per cent of the world service imports. The total service imports amount to US$ 83.6 billion. (International Trade Statistics, 2007: 14).
14.4 Export-Import and Trade Balance as Percentage of GDP
The index of openness of the Indian economy, measured as the ratio of foreign trade to the GDP increased from 13.4 per cent in 1990–91 to 39.7 by 2008–09, though fluctuations may be observed in between (Table 14.1). Both exports and imports as a percentage of the GDP have increased during the post-reform period. In the crisis year, 1991–92, exports as a percentage of the GDP was 6.7 and that of imports was 7.7—leading to a trade deficit of 1 per cent. The share of exports in the GDP reached 8.9 per cent in 1995–96 from its level of 5.8 per cent in 1990–91. In 2009–10, the exports as a percentage of the GDP stood at 13.4 and that of imports at 21.2 leading to a trade deficit of 7.8 per cent. India’s import-to-GDP ratio, which rose sharply from 7.7 per cent in 1991–92 to 12.3 per cent in 1996–97, has in fact marginally declined to 11.5 per cent in 1998–99. Since then it has reached a record 24.7 per cent in 2008–09 and later subsiding to 21.2 per cent in 2009–10 due to ecomomic slowdown. The high growth in imports in value terms was primarily due to the high oil prices. The overall growth of trade has also created a potential economic problem—a growing trade deficit. Until 2004, India’s merchandise trade balance—exports minus imports—generally ran a deficit of less than US$ 9000 million. However, since then, India’s merchandise trade deficit has grown from US$ 14,306.64 million in 2004–05 to US$ 118,400.8 million in 2008–09. While this is a cause for concern, it may reflect a lag between the growth of export and import of the capital, intermediate and basic goods.
TABLE 14.1 Export, Import, Total Trade and Trade Balance of GDP at Current Market Prices (in per cent)

Source: Directorate General of Commercial Intelligence and Statistics.
14.5 Growth Rate of Export and Import
India’s exports grew substantially during the 1990s, whether seen in terms of absolute values or relative to the GDP (Table 14.2). Since the introduction of new economic policies, India’s exports have risen from the US$ 18,142.84 million in 1991–92 to US$ 18,5295.2 million in 2008–09 before subsiding to the US$ 17,6574 million in 2009–10. The export growth, however, has been quite uneven. While during 1993–96 it recorded impressive gains, the annual growth rate fell sharply in 1996–97 and even turned negative in 1998–99. Once again, the exports staged substantial recovery and recorded an average growth of 29.1 per cent between 2002–03 and 2008–09. But the exports turned negative in 2009–10 (Figure 14.2). While the volume growth dominated the export performance until 2002–03, there is an increasing contribution of higher unit values in recent years as reflected in the net terms of trade. This change coincided with a rising share of the high value gems and jewellery items, the gradual shift to garments from fibres and fabrics and the sharp rise in prices of the non-fuel primary items like ores and minerals, iron and steel and non-ferrous metals (Table 14.2) Though the high growth in the global output and demand especially in the major trading collaborates of India helped, it was the pick up in the domestic economic activity, especially the consistent near double-digit growth in manufacturing, which constituted the main driver of the recent export surge. India’s impressive export growth has exceeded world export growth in most of the years since 1995; but, since 2003, it has lagged behind in the export growth of developing countries taken together, mainly because of China’s explosive export growth.
The merchandise imports grew from the US$ 24,072.53 million in 1990–91 to US$ 30,3696 million in 2008–09, before declining to US$ 27,8681 million in 2009–10. While India’s total import bill in dollar terms rose consistently through the 1990s starting from its 1991–92 level, the rate of growth has definitely decelerated since 1996–97. It again picked up from 2002–03. There is of course one good reason to expect a deceleration in the import growth after 1995–96, and this is the deceleration in production and investment in the industrial sector. Again, the industrial growth accelerated since 2003–04 and the imports followed suit. The imports declined by 8.2 per cent in 2009–10 in response to the global slowdown. Thus, the output movements in the industrial sector, dependent on imports for the capital equipment, intermediates and components, substantially explain the movements in India’s import bill as well (Chandrasekhar, C. P., and Ghosh, J., 2001).
Figure 14.2: Growth Rate of Exports and Imports

Source: Directorate General of Commercial Intelligence and Statistics.
TABLE 14.2 Index Numbers and Terms of Foreign Trade

Note:
- The gross terms of the trade imply volume index of imports expressed as a percentage of volume index of exports.
- The net terms of trade imply unit value index of exports expressed as a percentage of unit value index of imports.
- The income terms of trade imply the product of net terms of trade and volume index of exports expressed as a percentage.
Source: Directorate General of Commercial Intelligence and Statistics.
In the post-reform period, the imports grew at a faster rate than the exports. During the period of 1980–89, the average annual growth rate of exports was 31.21 per cent and imports 18.15 per cent. However, during the period of 1990–99 both the exports and imports grew at an average annual rate of 39 per cent. However, in the first decade of the present millennium, the exports grew at an average rate of 17.6 per cent and the imports at 19.9 per cent. The total trade grew at the average annual rate of 22.7 per cent in the 1980s. It recorded a higher growth rate of 39.48 per cent in the 1990s. However, the growth rate has fallen to 19.9 per cent in the first decade of the present millennium. While the growth of the total trade in the 1980s was export-led and in the 1990s both the exports and imports contributed equally, however in the current decade the growth is mainly import-led. The liberalization of the import tariffs, the rise in crude oil prices and the growth-induced imports may explain the recent spurt in imports.
The gross terms of trade, which measure the volume index of imports as a ratio of the volume index of exports, show fluctuating trends during the period under consideration (Table 14.2). In real terms, the flow of imports was stronger than the flow of exports after the mid-1990s. This comes through from figures on gross terms of trade (GoT). The GoT declined to 111 in 2002–03, mainly due to a spurt in the imports. However, a favourable GoT (164) in 2005–06 indicates that more imports are received on a given volume of the exports. The net terms of trade, which measure the unit value index of exports as a proportion of the unit value index of imports, deteriorated since 1999–2000 as the unit value index of imports rose mainly due to a sharp rise in the price of crude petroleum and of gold and other metals. However this trend has been reversed in 2005–06 as a unit value increase in the exports more than compensated for the unit value increase in the imports.With a rise in both the export volume and the unit value, the income terms of trade which measure the export’s purchasing power to the import have been improving consistently during the 1990s (except 1996–97) and improved further in 2005–06. Though the quantum index of the imports significantly increased, a declining unit value index of the imports coupled with an increase in both the unit value and the quantum index of exports resulted in high income terms of trade in 2005–06 (Table 14.2).
The capacity of the exports to finance imports represented by the export-import ratio has declined. The export-import ratio was 75.36 in 1990–91. It reached its peak level of 95.42 in 1993–94 and since then has fallen to 74.13 in 1999–2000, almost equal to the level prevalent in 1990–91. Since then it has further dropped to 69.1 in 2005–06 and again to 61 in 2009–10 (Figure 14.3).
14.6 Composition of Exports
The structural change in the composition of exports is lagging behind the structural change in the composition of the GDP. Much of India’s economic growth has been the result of the expansion of its service sector. The share of manufacturing in the GDP has remained disappointingly flat. At 16.3 per cent of GDP, the share of manufacturing in 2006–07 was still below the 16.7 per cent level of 1990–01. In contrast, the share of services in the GDP has risen steadily during this period from 44 per cent to 55 per cent. However, the share of services in the total external trade increased from 21.5 per cent in 1990 to 27.4 per cent in 2006. Among the commodity groups, the primary products contributed to 23.83 per cent of India’s exports in 1990–91. Since then its share has fallen to 17.72 per cent in 1999–2000 and further to 13.9 per cent in 2008–09. However, the share of the manufactured goods, which was 71.63 in 1990–91, has reached 80.7 per cent in 1999–2000 but thereafter it has fallen to 70.39 in 2005–06 and further to 67.2 in 2008–09. However, the share of petroleum products increased from 2.88 per cent in 1990–91 to 17.4 per cent in 2007–08 before dropping down to 14.7 per cent in 2008–09 (Figure 14.4).
Figure 14.3: Export-Import Ratio and Trade Balance
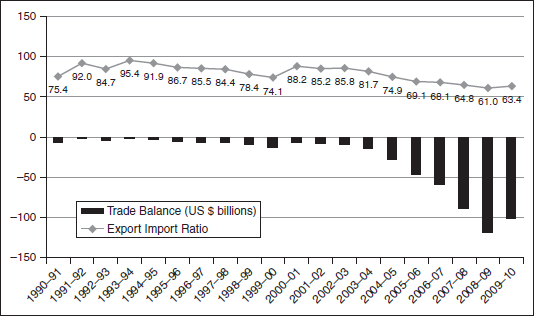
Source: Directorate General of Commercial Intelligence and Statistics.
Figure 14.4: Major Commodity Groups of Exports
Source: Directorate General of Commercial Intelligence and Statistics.
TABLE 14.3 Composition of India’s Exports Share (in per cent)
| 1990–91 | 2008–09 P | |
|---|---|---|
| Agriculture and allied products | 18.49 |
9.6 |
| Chemicals and related products | 9.52 |
12.4 |
| Engineering goods | 12.40 |
25.9 |
| Gems and jewellery | 16.12 |
15.2 |
| Handicrafts (excluding handmade carpets) | 1.23 |
0.2 |
| Leather and manufactures | 7.99 |
1.9 |
| Ores and minerals | 5.34 |
4.3 |
| Petroleum products | 2.88 |
14.7 |
| Textile | 23.93 |
11.0 |
| Others | 2.10 |
4.8 |
Source: Directorate General of Commercial Intelligence and Statistics.
14.6.1 Export Commodity Basket
India’s export basket has diversified in the past five years with engineering goods, petroleum products and chemical products increasing their share in the export basket, while the traditional exports like textiles, gems and jewellery, and leather and leather products losing their shares. In 1990–91 the major items of the exports were textile (23.93 per cent), agriculture and allied products (18.49), gems and jewellery (16.12), engineering goods (12.40) and chemicals and related products (9.52). The engineering goods (25.9 per cent), petroleum products (14.7), textile (11.0), chemicals and related products (12.4), gems and jewellery (15.2) and agriculture and allied products (9.91) were the major items of export in 2008–09 (Table 14.3). The share of traditional labour-intensive exports declined steeply in the case of leather and leather manufactures, and to a smaller extent in the case of handicrafts. Since many of these products were reserved for production by the small-scale industries, which are less equipped to face international competition or could not leverage economies of scale, given the reservation policy, the decline in the share of these products in incremental exports is not surprising. Despite the new opportunities that opened up with the phasing out of the textile quotas, the textile exports in the total exports showed a disappointing declining trend. In textiles, with the quota regime giving way to free market at the global level, at the beginning of 2005, there is a lot of expectation from the Indian textile industry. India’s performance has not been satisfactory. There exists considerable scope for further diversification of India’s export basket in terms of its composition.
14.7 Import Commodity Basket
Among the commodity groups of import, petroleum—crude and products—constitute a major item of imports in 1990–91 as well as in 2008–09 though its share in India’s total imports has increased from 25.04 per cent in 1990–91 to 31.3 per cent in 2008–09. The share of capital goods has also increased from 24.24 per cent in 1990–91 to 27.9 per cent in 2007–08. The share of the export-related items has fallen from 15.29 per cent in 1990–91 to 10.2 per cent in 2008–09. The export of the bulk consumption goods (consisting of agricultural commodities such as cereals, pulses, edible oil and sugar that were imported to meet the domestic supply shortfalls and other bulk items, mostly the non-competing raw-materials and intermediates such as fertilizer) which constituted 2.31 per cent of the Indian imports in 1990–91 peaked at 5.95 per cent in 1998–99 but had subsequently fallen to 2.78 per cent in 2004–05 and further to 1.7 per cent in 2008–09 (Figure 14.5).
Figure: 14.5: Major Commodity Groups of Imports

Source: Directorate General of Commercial Intelligence and Statistics.
In 1990–91, the major imports include petroleum, crude and products (25.04), other commodities (23.82), the machinery except electrical and electronic (8.72), pearls, precious and semi-precious stones (8.65), project goods (5.92), organic and inorganic chemicals (5.30) and iron and steel (4.89). In 2008–09 the imports consisted of petroleum, crude and products (31.3), electronic goods (8.4), transport equipment (4.5), gold and silver (6.41) and machinery except electrical and electronic (7.2). The oil continues as the top import item, and over three-quarters of its imports are crude oil. Jewellery (gold and pearls, precious and semi-precious stones) remains India’s second biggest import, consisting of nearly equal amounts of gold and diamonds to be used by India’s jewellery manufacturing industry. The next two top import categories—machinery and electrical machinery—incorporate both the consumer goods (televisions, telephones and computers) and the intermediate goods (hard disc drives and integrated circuits) (Table 14.4).
TABLE 14.4 Composition of India’s Imports Share (in per cent)
| 1990–91 | 2008–09 P | |
|---|---|---|
| Petroleum, crude materials and products | 25.04 |
31.32 |
| Electronic goods | 0.00 |
8.32 |
| Transport equipment | 3.87 |
4.47 |
| Gold and silver | 0.00 |
6.41 |
| Machinery except electrical and electronic | 8.72 |
7.18 |
| Metalliferrous ores, metal scrap, etc. | 3.54 |
2.71 |
| Organic and inorganic chemicals | 5.30 |
4.17 |
| Pearls, precious and semi-precious stones | 8.65 |
4.95 |
| Iron and steel | 4.89 |
3.21 |
| Coal, coke and briquittes, etc. | 1.83 |
3.43 |
| Fertilizers | 4.09 |
4.66 |
| Non-ferrous metals | 2.55 |
1.80 |
| Textile yarn, fabrics, made-ups, etc. | 1.02 |
0.87 |
| Edible oil | 0.75 |
1.18 |
| Project goods | 5.92 |
1.07 |
| Others | 23.82 |
14.19 |
Source: Directorate General of Commercial Intelligence and Statistics.
P: Provisional.
14.8 Direction of Trade
Among India’s individual trade partners (exports 1 imports), the United States was the largest trade partner accounting for 13.26 per cent of India’s total trade in 1990–91. In 2008–09 the UAE, with a share of 9.9 per cent, was India’s largest individual trade partner followed by China (8.6) and the United States (8.1). The emergence of Dubai as a world trading hub for re-exports, coupled with high oil prices, as India not only imports crude oil from Dubai but also exports refined POL products, the UAE has emerged as the largest trading partner of India. Russia and Japan which were the 2nd and 3rd largest trade partners in 1990–91 were not among the top ten trade partners of India in 2006–07. China has emerged as the second largest trade partner accounting for 8.6 per cent of India’s trade in 2008–09. With the collapse of the Soviet empire, the barter trade arrangements with that region collapsed as well. This led, in the post-reform era, to a declining share of Eastern Europe in both imports and exports (Table 14.5).
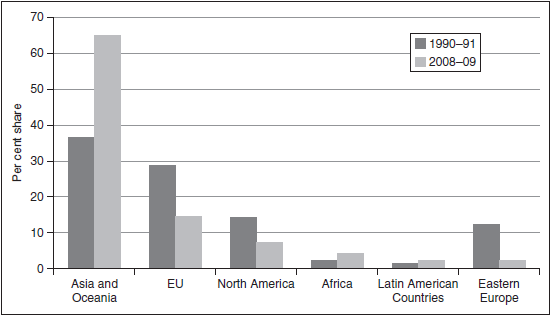
Region wise, Asia and Oceania accounted for more than 60 per cent of India’s total trade in 2008–09. Its share in India’s total trade has increased from 36.7 per cent in 1990–91 to 64.4 per cent in 2008–09. The relative share of European Union (EU), North America and Eastern Europe has decreased from the levels that prevailed in 1990–91. However, the relative share of African and Latin American countries has increased. Of late, Africa has emerged as major source of petroleum products as India imported almost 20 per cent of its petroleum products from Africa in 2008–09 (Figure 14.6).
TABLE 14.5 India’s Top Trade Partners

Source: Directorate General of Commercial Intelligence and Statistics.
Figure 14.6: Regional Distribution of India’s Trade
14.8.1 Direction of Exports
In the 1990s, more than half of India’s exports were directed towards the OECD markets, with 28 per cent directed to the EU markets, around 15 per cent to the United States and around 16 per cent went to Russia. However, over time, there has been some diversification in the terms of direction of India’s exports. In terms of the export destination, the UAE emerged as the principal destination accounting for 13.2 per cent of India’s total exports in 2008–09, followed by the United States (11.4 per cent), China (5.0 per cent), Singapore (4.6 per cent) and Hong Kong. (3.6 per cent) The share of EU has declined to 21.3 per cent in 2008–09, while the share of North America has declined to 12.1 per cent. There has been a considerable increase in the share of the Asian developing countries in India’s export basket. Asia and Oceania have emerged as major export destinations. From a level of around 30.45 per cent in 1990–91, the share of Asia and Oceania accounts for half of India’s total exports in 2008–09. The share of Africa has also increased over time (Figure 14.7).
Figure 14.7: Regional Distribution of India’s Exports

14.8.2 Direction of Imports
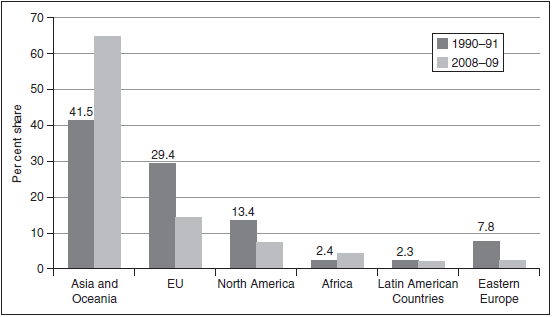
In 1990–91, the United States was the major source of imports (12.14) followed by Germany (8.04), Japan (7.51), Saudi Arabia (6.71) and UK (6.70). In 2006–07, China (10.7) has emerged as India’s major source of imports followed by the UAE (7.8). Saudi Arabia (6.8), USA (6.1) and Iran (4.1) As a region for India’s imports, Asia and Oceania continued to be the major and rapidly growing source accounting for 65 per cent of the total imports. The imports from EU were 29 per cent in 1990–91 and that from North America were 13.44 per cent. In 2008–09, their respective shares were 14.3 and 7.1 (Figure 14.8). In North America, the United States was the major source of imports; Germany, Switzerland and the UK were the major import sources in EU. The imports from Africa have increased mainly due to a dramatic growth in imports from Nigeria (mainly crude oil).
14.9 Global Slowdown and India’s Trade
The Indian exports and imports fell in line with the global trade flows, firmly dismissing the decoupling myth for the Indian economy. Though India escaped the direct adverse impact of the recession of 2008–09, she did suffer the ‘second round’ effects when the financial meltdown morphed into a worldwide economic downturn. Thousands of jobs were lost due to a contraction in the output of the exportable sectors and indirectly due to a decline in the output of the sectors, which provided inputs to the exportable sectors.
Figure 14.8: Regional Distribution of India’s Imports
In terms of year on the year growth rates, the export decline started from October 2008; the imports started declining a little later, from December 2008. Before the crisis, India’s exports and imports had been growing robustly. The slowdown in India’s trade flows, however, started even prior to the post-Lehman crisis. The exports had begun to decelerate from June 2008 and import from September 2008 (Figure 14.9). This was the consequence of the tight monetary policy driven by inflationary concerns. These initial decelerations were pushed to the subsequent collapse by the global economic crisis.
Indias exports registered a negative growth for 13 months since October 2008 till October 2009 and the imports registered a negative growth for 12 months since December 2008 till November 2009. One of the core reasons for the sharp fall in India’s exports is the high income demand elasticity for exports which makes exports highly sensitive to the GDP movements. India’s exports have been found to be more sensitive to income than to the price changes. It is estimated that a 1 per cent decline in the GDP growth of the world will lead to 1.88 per cent decline in India’s growth of exports to the world (UNCTAD, 2009). The increased elasticity of the world trade is due to the emergence of cross-border production and supply networks. Other factors through which the exporters were hit hard were the sharp reduction in the prices of the major traded commodities. Thus, the decline in trade was a combined effect of both the volume and the price decline.
The decline in the exports was mainly due to the decline in the exports of the engineering goods, petroleum products, gems and jewellery and iron and steel. In terms of markets the decline was mainly contributed by the decline of exports to EU, UAE, the United States and Singapore. In case of imports the decline was on account of the decline in the imports of petroleum, petroleum products, capital goods, export-related items like pearls, precious and semi-precious stones, fertilizers and transport equipments; in terms of the market UAE, EU, Saudi Arabia, China and the United States.
Figure 14.9: Growth Rate of Exports and Imports

The Indian policy response to the plummeting of its exports has been principally to provide fiscal incentives in the form of reduced import duties on the imports needed for exports and raising the rates of duty drawback available to the exporters. In addition, the exporters have been given a 2 per cent interest rate subsidy on the refinancing of trade finance as well as for their working capital requirements. This may have helped in the slight recovery that is now being seen in the year-on-year data.
India’s recovery on the export front started happening from November 2009 which further picked up in the month of March 2010. The momentum is likely to be maintained, though the shadow of the fresh financial crisis in Europe looms large over the future and export performance depends on how the European crisis unfolds. The EU generally accounts for about a quarter of India’s exports. The Indian government has set a target of $200 billion worth merchandise exports for 2010–11 and wants to double the exports by 2014. The export target of $200 billion for 2010–11 set by the government could be at stake if Euro Zone sovereign crisis is not prevented from spreading to a larger part of the EU. The export products which are likely to be adversely affected include in areas of engineering, readymade garments, yarn, chemicals, oil seeds, electrical goods and leather. The imports would grow especially most of the capital goods, components and power equipment as India’s economic expansion will continue to go on and it will remain a centre for larger economic activities. This will spur up the demand and sustain the growth momentum.
14.10 Conclusion
The post-reform period witnessed significant changes in the trend, pattern and structure of India’s external trade. The assertion that trade liberalization would help in the diversification of the structure of exports and output in favour of the manufactured goods has not materialised. The change in the pattern of specialization in the exports is, more or less, in conformity with a change in the pattern of production. The share of manufacturing has marginally fallen in the GDP and significantly fallen in the share of exports. The growth of services was more pronounced in the GDP growth and is reflected in the increasing share of services in the exports. While the volume growth dominated the export performance until 2002–03, there is an increasing contribution of higher unit values in the 2000s as reflected in the net terms of trade. The share of primary products has fallen in exports and that of petroleum products showed an increase. This increase in the share of petroleum products reflects the increasing refining capacity of the country. Another notable aspect of India’s recent export growth is the relatively poor performance of its past leading sector textiles. The fall in the share of textiles reflects the fact that India is not being able to get full benefits from the removal of the MFA. Another feature of India’s trade in the last two decades was the overwhelming importance of Asia and Oceania.
In the post-reform period imports grew at a fast rate than the exports. The demand for imports is bound to increase due to the envisaged growth of the economy—raw materials, capital goods, components and energy. The opening up of the import of a variety of consumer goods is also likely to add to the import basket. India has also been periodically required to depend on the external sources for mass consumption items like edible oils. Since the increase in imports noted above could have been due to a relaxation of the import regime, and thus has been on the expected lines, and also because the commitments under the WTO make the import policies virtually irreversible, the trade gap could only be dealt with by increasing India’s exports. Thus, to sustain a higher rate of growth while keeping the current account deficits under control and to make the Indian industry competitive, it is imperative to increase the country’s exports at a fast pace. Though India has been able to withstand the global slowdown with minimum damages, it will have to try and achieve a robust growth in its exports by expanding its share in the major markets. The high dependence on a few markets and a few exportable products make her vulnerable to any future slowdowns.
References
Ahluwalia, M. S. (1993). India’s Economic Reforms, Seminar on India’s Economic Reforms, Merton College, Oxford.
Ahluwalia, M. S. (1994). “India’s Economic Reforms.” In R. Cassen and V. Joshi (Eds.). The Future of Economic Reforms. New Delhi: Oxford University Press.
Bhagavathy, J. (2001). The design of India’s development. In I. S. Ahluvalia and I.M.D. Little (Eds.), India’s economic reforms and development: Essays for Manmohan Singh. New Delhi: Oxford University Press.
Bhagwati, J., and Padma, D. (1970). India: Planning for Industrialization. London: Oxford University Press.
Bhagwati, J., and Srinivasan, T. N. (1975). Foreign Trade Regimes and Economic Development, India. New York: National Bureau of Economic Research.
Bhaumik, S. K. et al. (2003). Survey of FDI in India, DRC Working Papers, Foreign Direct Investment in Emerging Markets, Centre for New and Emerging Markets, London Business School.
Bishwanath, G., and Banga, R. (2006). Impact of trade liberalization on foreign direct investment in Indian industries. Hyderabad: CESS.
Buiter, W., and Patel, U. (1992). Debt, finances and inflation: An application to the public finances of India. Journal of Public Economics, 47: 171–205 (as reported by Srinivasan, 2003).
Chandra, R. (Ed.) (2006). Trade in services and India: Prospects and strategies. New Delhi: Wiley.
Chandrasekhar, C. P., and Ghosh, J. (2001). Has India contained an import surge? Business Line, Tuesday, May 29.
Dhar, P. N. (1990). Constraints on growth: Reflections on the Indian experience. New Delhi: Oxford University Press.
Director General of Commercial Intelligence and Statistics (India), http://www.dgciskol.nic.in/Dgcis.htm
Economic Survey. (1990–91 to 2006–2007). http://indiabudget.nic.in/
International Trade Statistics. (2007). http://www.wto.org/english/res_e/statis_e/statis_e.htm.
Jha, L. K. (1980). Economic Strategy for the 80s (India). New Delhi: Allied Publishers.
Ministry of Commerce and Industry. (2007). Foreign Trade Policy 2004–2009, Department of Commerce, Government of India, Website: http://dgft.gov.in.
Nagaraj, R. (2007). Foreign direct investment. In U. Kapila (Ed.), India in 1990s trends and issues. New Delhi: Accadamic Foundation.
Reddy, Y. V. (2006). Dynamics of balance of payments in India. Diamond Jubilee Lecture, Osmania University, Hyderabad.
Reserve Bank of India. (2009) Handbook of Statistics on Indian Economy. http://www.rbi.org.in/scripts/AnnualPublications.aspx?head=Handbookpercent20ofpercent20Statisticspercent20onpercent20Indianpercent20Economy
Singh, K. (2005). Foreign direct investment in India: A critical analysis of FDI from 1991–2005. Centre for Civil Society, New Delhi.
Srinivasan, T. N. (2001). Integrating India with the world economy: Progress, problems and prospects. http://www.econ.yale.edu/~srinivas/
Srinivasan, T. N. (2003), Indian economic reforms: A stocktaking. http://www.econ.yale.edu/~srinivas/
UNCTAD. (2009). Impact of global slowdown on India’s exports and employment. New Delhi: UNCTAD-India.