21
Agriculture Trade
K. P. Mani
21.1 Introduction
The Government of India, in July 1991, announced a series of reforms related to industry, trade, agriculture, exchange rate, fiscal and financial policies, to achieve macro-economic stability and to arrest the deterioration in the balance of payments position and also to assimilate with global strategies as a consequence of globalization. The reforms in trade policy had been announced by the exchange rate adjustment on May 1991, with a major thrust on export competitiveness followed by a supplementary policy on August 1991. The objectives of the reforms in trade policy were to provide a self-corrective mechanism to rectify the imbalances between exports and imports, which had resulted in the deterioration of the balance of payments position during the latter half of the 1980s. The features of the major trade reform policy are as follows:
- Exchange rate adjustment—to enhance competitiveness of the Indian exports and to reduce imports intensity of the industrial production.
- Introduction of an ‘EXIM scrip’—exporters entitled to an import replenishment license called EXIM scrip, equal to 30 per cent of the Free on Board (FOB) value of exports.
- EXIM scrip can be freely traded in the market.
- Access to imports linked to exports, via EXIM scrip.
- Income tax exemption for export profits extended to trading exports and service exports.
- Hundred per cent export-oriented units made more attractive by facilitating access to the domestic market.
- Major exporters to be permitted to operate bank accounts to facilitate trade transactions.
TABLE 21.1 India’s Foreign Trade (Rupees in Crore)

Source: Hand Book of Statistics on the Indian Economy, Reserve Bank of India (Various Years).
- Lowering of the maximum rate of import duties to 120 per cent and a further reduction of 40 per cent by 1995.
- Currently prevalent quantitative restrictions on imports to be substituted by the import duties.
- Import licensing primarily confined to the capital goods.
In the later years, amendments and modifications were made to these base level policy prescriptions. Table 21.1 presents the export—import performance of India since 1990–91.
The total exports of India, which stood at Rs 32,557.2 crores in 1990–91, increased to Rs 766,935 crores by the end of 2008–09, recording an increase of 23.55 times compared to 1990–91, the major share being non-oil exports. Non-oil exports constituted 97 per cent in 1990–91 which came to 92 per cent in 2007–08. In the case of imports, in 1990–91, we imported goods worth Rs 43,192 crores in 1990–91, the shares of oil imports and nonoil imports being 24.80 and 75.20 per cent, respectively. The imports made a consistent increase and reached Rs 1,305,503 crores in 2008–09, the shares of oil imports and non oil imports, respectively, being 31.67 and 68.33 per cent. Thus, it is reassured that the oil imports bill constitutes the single most important item affecting our imports. The increase and fluctuations in the price of crude oil in the international market significantly influence our balance of payments. It is also to be observed that while our exports increased by 23.55 times compared to 1990–91, our imports increased at a higher rate, 30.22 times during the same period. As a consequence of theses changes, our trade balance continues to be unfavourable. In 1990–91, the trade balance was Rs —10,635.2 crores which reached Rs —38,568.0 in 2008–09. Thus, in the era of globalization and reforms, our exports are not sufficient enough to offshoot our import bills, resulting in unfavourable terms of trade (Figure 21.1). There are various reasons attributing to this situation.
Figure 21.1: India’s Foreign Trade in Rupee Crores (2000–08)

21.2 Terms of Trade in Agriculture
Foreign trade helps the developing economies through the strategies of export-oriented growth as well as growth-oriented exports.
Apart from its important role as a source of income and employment, agriculture remains as a significant earner and saver of foreign exchange in most semi-industrialized countries, particularly the large ones. The developing economies like India normally start with the export of agricultural commodities, and the earnings could be utilized for importing capital goods and industrial materials and technology for initiating growth in the economy. To the extent that the imports required for development are in excess of the export earnings, the economy has to depend upon external assistance for financing the growth. The growth later on has to lead to surplus from exports, so that the country can meet its obligations resulting from the external assistance. Whenever this has not happened, the situation is likely to lead to a national as well as international crisis arising out of debt trap on one hand and the credit trap on the other. Such situations have already affected some developing countries, mostly in Latin America at present. Recently even India faced a serious balance of payment crisis. The potential of the agriculture sector has played an important role in averting such dangers in the past and is expected to help the situation in future, on the share of the farm sector in the total foreign trade of India. The performance of the foreign trade with respect to the agriculture commodities from 1950–51 to 1980–81 is given in Table 21.2.
TABLE 21.2 Trade Balance of India from Agriculture Sector Between 1950–51 to 1980–81

Source: Compiled from Economic Survey Government of India (Various Years).
There are few perceptible trends which indicate the mutual roles played by the farm sector in the development of the economy and vice versa, through the medium of foreign trade. Both the exports and the imports related to the farm sectors have continuously gone up during the period from 1950 to 1980. Though there were heavy fluctuations between years, the share of the farm sector in the total exports as well as imports fell during the period. It is significant to note that while the percentage share of the farm sector in the total exports from India had fallen from 70 per cent in 1950–51 to just 40 per cent in 1980–81, the percentage share of farm imports fell much more sharply from 40 per cent to mere 4 per cent during the same period. More importantly, the sectoral balance of trade for the farm sector has always shown a positive balance as against a negative balance experienced by the overall foreign trade of the country for the period under reference. Thus the farm sector has been financing the general development of India through the exports. The rate of the surplus generated went up from period to period. Another important trend that is emerging from the data is the characteristics of the imports related to the farm sector. The percentage share of the cereals and cereals preparation had gone down and that of the fertilizer went up. This is an indication of the changing character of the farm sector itself.
As mentioned above, from 1991 onwards there were notable changes in the policies as a consequence of reforms in all the sectors and agriculture sector was also not free from those implications. Further, the present strategy of the globalized agriculture is ‘export-led growth’. To achieve this objective the agriculture policies and strategies are retuned. At the same time, imposition of strict quality standards like sanitary and phytosanitary conditions, entry of rivals, etc. make our competitive strength weak. Table 21.3 presents the export details of our principal agricultural commodities from 1990–91 to 2008–09 in US dollars, and Table 21.4 represents the export details in rupees.
The major export items of India are tea, coffee, rice, wheat, cotton, tobacco, cashew, spices, oil meals, fruits, (raw and processed), sugar, marine products and meat. In 1990–91, the export of tea from India stood at 596 million US dollars and in rupee terms at 1070 crores. In later years there was a fall in the export value of tea in US dollar terms. In rupee terms, also, there was a declining trend. However, a revival is noticed in recent years. The export of tea records 1.90 times increase in the rupee terms as compared to 1990–91. In the case of coffee, there is a notable increase as compared to 1990–91. During the period from 1990–91 to 2008–09, export of coffee increased 7.42 times in rupee terms. Compared to tea, the exports of coffee was relatively low in 1990–91. In 1990–91, the export of coffee remained at Rs 252 crores or 140 million US dollar, which increased to Rs 1872 crores in 2008–09. Another agricultural commodity which recorded substantial improvement in exports is rice. In 1990–91, the export value of rice was very low. However, in the succeeding year rice exports reached Rs 4568 crores, an equivalent of 1365 million US dollars. However, in the subsequent years there were fluctuations in the export value which reached relatively very high in 2008–09. Over a period of 18 years, there was a 25.48 times increase in the export value of rice in rupee terms. Another food crop exported is wheat, but compared to rice the export value of wheat is very low, or practically we do not export wheat. From centuries we had a monopoly in the export of cotton. This trend was maintained even after the reforms. In 1990–91, we exported cotton worth Rs 845 crores which increased to Rs 8865 crores in 2008–09, a ten-fold increase during the period. The other two important exports items are cashew and spices. Cashew exports remained at 249 million US dollars in 1990–91, which increased to 555 million US dollars in 2008–09. In rupee terms, compared to 1990–91 the export value of cashew increased by 4.99 times. Compared to many other agricultural commodities, the growth in the exports of cashew is not very encouraging. One of the probable reasons for this trend is the rejection of our cashew because of the difficulties in adhering to global quality standards prescribed by sanitary and phytosanitary conditions. Spices occupied a prominent place in our exports from time immemorial. The export value of spices in rupee terms stood at Rs 233 crores in 1990–91 which increased to Rs 4204 crores in 2008–09, the growth trend being an 18.04 times increase compared to 1990–91. At the same time, it is appropriate to mention that the problem of quality has slightly affected our exports because of the strict quality norms imposed as part of WTO agreement. Instances are reported that in the international market doubts are raised about the quality of our spices items. One instance is the criticism against cardamom in late-1990s. Another commodity which made substantial progress in exports is sugar. Just like Cuba, India is also a major player in the global sugar market; though the export value of sugar was relatively low in 1990–91. In 1990–91, the export value of sugar remained at 20 million US dollars or Rs 37 crores. However, the exports made a remarkable increase in the subsequent years except 2004–07. In the last reported year, 2008–09, the exports of sugar remained at Rs 5662 crores, the increase being 153.02 times compared to 1990–91. This is the highest rate of growth in the case of any reported agricultural commodity. The Indian fruits and processed fruits are also exported at a notable level. The export of fruits and processed fruits increased by 14.39 and 10.07 times, respectively, after the reforms. Just like the agricultural commodities, the allied sector products are also gaining momentum in the exports. India has a lengthy coastline. The exports of marine products which remained at Rs 960 crores in 1990–91 increased to Rs 6926 crores in 2008–09, having a growth of 7.21 times during the period. Still, it is also reported that the value of marine exports are less compared to the potential of the sector. Globalization recommends for processing and value addition. One of the sectors in the theme agriculture with enough potential for processing and value addition is the marine sector. The only requirement is that we have to reshape our policies and strategies to meet the need of the hour. Another sector with similar potential for expansion is the livestock sector. The total agricultural product exports stood at 3354 million US dollars in 1990–91 or Rs 6018 crores. This increase to 18,403 million US dollars, or Rs 74,094 crores in 2008–09, was 12.31 times compared to the base year 1990–91. The overall picture suggests that the Indian agriculture tried to adjust with the motto of export-led growth during the reforms period. Certain factors that affected the exports during the period were the weather changes, climatic conditions, changes in the exchange rates, shifts in the government policy and new or modifications in the international trade policies. When these exogenous factors are incorporated, sight variations are possible in the dollar or rupee value of the exports reported. However, the picture will be clearer when we examine the flow of agricultural exports, item-wise and country-wise. In order to make comparisons more meaningful, they are expressed in US dollars.
TABLE 21.3 Exports of Principal Agricultural and Allied Commodities (US Million Dollars)

Source: Hand Book of Statistics on the Indian Economy, Reserve Bank of India (Various Years).
TABLE 21.4 Exports of Principal Agricultural and Allied Commodities (Rupees in Crore)

Source: Hand Book of Statistics on the Indian Economy, Reserve Bank of India (Various Years).
21.2.1 Tea
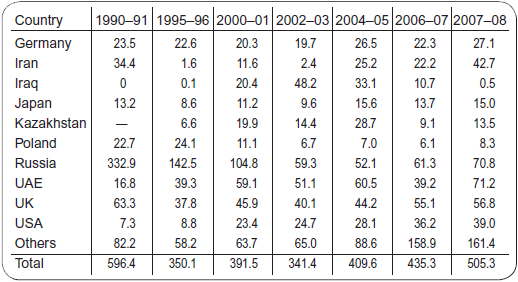
Tea is one of the major export items of India. Our main trade partners are Germany, Iran, Iraq, Japan, Poland, Russia, UAE, UK and the United States. The exports to Poland and Russia has declined drastically compared to 1990–91. It declined from 22.4 million US dollars in 1990–91 to just 8.3 million US dollars in 2007–08. This decline is continuous from 1990–91. In the case of Russia, the export of tea which remained at 332.9 million US dollars in 1990–91 came down to 70.8 million US dollars in 2007–08. In 1990–91 Russia was the major importer of Indian tea, but this position went down in 2007–08. The dismantling of Soviet Union is the most important reason behind this trend. At the same time the export of tea to UAE increased over the years. The exports of tea to other countries also recorded a substantial improvement since reforms. All these trends indicate that there are shifts in the direction and magnitude of the export of tea over the years (Table 21.5).
TABLE 21.5 Export of Tea to Principal Countries (in US Million Dollars)
Source: Hand Book of Statistics on the Indian Economy, Reserve Bank of India (Various Years).
21.2.2 Coffee
The Indian coffee is exported to Belgium, Germany, Italy, Netherlands, Russia, Spain, Switzerland, UK and the United States. In 1990–91, our major importers were Russia and Germany. These two countries imported 66.22 per cent of the Indian coffee exports in the dollar value terms. Over the years there are certain noticeable changes. The import of coffee by Russia came down to 38.9 million US dollars in 2007–08, compared to 81.5 million US dollars in 1990–91. Another country which started importing Indian coffee is Italy. Their share in the import of Indian coffee was very low in 1990–91, which made a tremendous increase over the years and reached a very high figure of 115.4 million US dollars in 2007–08. ‘Other countries’ altogether also made a substantial improvement in the import of the Indian coffee. Just like tea, there were changes in the direction of the export of coffee also after the reforms (Table 21.6).
21.2.3 Rice
Rice and wheat are the major food crops produced in India. As mentioned earlier, wheat is rarely exported from India. In the case of rice, the total exports remained at 257.2 million US dollars in 1990–91. Of this about 30.70 per cent was exported to Saudi Arabia. The rest of the countries imported only small quantity, which is evident from low dollar values. However, over the years, exports substantially improved. A notable jump is seen from 2000–01 to 2002–03. The total exports increased from 641.8 million US dollars in 2000–01 to 1204.9 million US dollars in 2002–03, an increase of about 100 per cent. This is mainly because of a substantial demand from Saudi Arabia and ‘other countries’. The improvement in yield also resulted in more production. These trends continued and again doubled by 2007–08. The main countries to import Indian rice in recent years are Bangladesh, Saudi Arabia, UAE and ‘others’. At the same time, the country faces the problem of a reduction in area under rice because of the policy of commercialization of agriculture which results in the problem of food security (Table 21.7).
TABLE 21.6 Export of Coffee to Principal Countries (in US Million Dollars)

Source: Hand Book of Statistics on the Indian Economy, Reserve Bank of India (Various Years).
TABLE 21.7 Export of Rice to Principal Countries (in US Million Dollars)

21.2.4 Spices
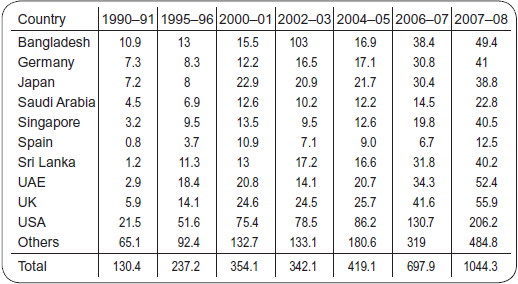
The demand for the Indian spices is well known for centuries. History indicates that many of the foreign countries came to India centuries back in demand for trade particularly spices. The major countries that trade in Indian spices are Bangladesh, Germany, Japan, Saudi Arabia, Singapore, Spain, Sri Lanka, UAE, UK and the United States. In earlier decades, Europe was one of the major markets of the Indian spices. However, this supremacy is lost due to changes in the food habits of the Europeans and also due to the availability of spices from other countries also in the international market. As per the available statistics for the year 2007–08, the major single importer of Indian spices is the United States followed by Bangladesh, UAE, UK, Germany and Japan. The total dollar value of spices exported from India in 2007–08 reached 1044.3 million US dollars. Compared to 1990–91, there are shifts in the direction and magnitude of spices exported (Table 21.8).
21.2.5 Cashew
Cashew and cashew kernels are other commodities exported from India. In 1990–91, the total export of cashew was to the tune of 249.1 million US dollars which steadily increased and reached 555.1 million US dollars. In 1990–91, two major countries that demanded Indian cashew were USA and Netherlands. However, as per the details available for 2007–08, the countries that imported the Indian cashew were Japan, Netherlands, UAE and the United States. Of the total exports in 2007–08, 60 per cent went to two countries, Japan and Netherlands and 35 per cent to the United States (Table 21.9). In recent years, the demand for Indian cashew is declining mainly because of the problem of quality standards. Thus, as mentioned earlier, achieving and maintaining the quality of the agricultural commodities is a serious concern in the era of reforms.
TABLE 21.8 Export of Spices to Principal Countries (in US Million Dollars)
Source: Hand Book of Statistics on the Indian Economy, Reserve Bank of India (Various Years).
TABLE 21.9 Export of Cashew to Principal Countries (in US Million Dollars)

Source: Hand Book of Statistics on the Indian Economy, Reserve Bank of India (Various Years).
21.2.6 Marine Products
India has an extensive coastal line, where the marine resources are abundant. Marine products are also a source of earning foreign exchange. India has a strong trade ties with Japan as far as the exports of marine products are concerned. In 1990–91, Japan imported marine products to the tune of 264.8 million US dollars. However, at the same time, it is unfortunate to note that the demand for Indian marine products from Japan is slowly coming down. In the year 2007–08, the imports of the Indian marine products by Japan remained only at 269 million US dollars. At the same time, Spain’s demand for the marine products was to the tune of 157.4 million US dollars, though its share was relatively low in 1990–91. The total exports of marine products increased from 535 million US dollars in 1990–91 to 1720.5 million US dollars in 2007–08 (Table 21.10).
In the above paragraphs we have seen the commodity-wise performance in exports. From these discussions and also based on the performance of India’s agricultural exports the following points can be highlighted.
- The agricultural commodities still constitute an integral component of India’s total exports.
- There are clear shifts in the direction of agricultural commodity exports.
- There are significant changes in the quantity of exports to different countries.
- In the case of certain commodities, the exports are coming down due to less competitive strength, limited quality, the absence of grading and high cost of production.
- The relation between production and exports is very weak, which implies that the country fails to take advantage of an increase in production.
- Even though there is an overall increase in production, the yield is still low as well fluctuating in the case of many crops. Thus the available quantity is not sufficient for meeting the demand, which leaves little for processing, value addition and exports.
TABLE 21.10 Export of Marine Products to Principal Countries (in US Million Dollars)

Source: Hand Book of Statistics on the Indian Economy, Reserve Bank of India (Various Years).
- Absence of reconciliation between the consumer prices, the remunerative prices demanded by farmers and stabilization of the domestic prices.
- Conflicts of interests between farmers, bureaucrats, policy makers and politicians.
- Neglect of investment in agriculture which affected the development of infrastructure in agriculture.
- The procedures, methods and legal framework of agricultural exports are not appropriate to the global changes.
- Even after the reforms, processing of agricultural commodities and value addition continues to be low in the country.
- There is need to make the interaction between agriculture and industry more intensive. The concept of agri business, which is becoming popular today, can play an effective role in this direction.
- There is absence of a professional marketing approach towards agricultural exports.
If we go for a close scrutiny of the recent EXIM policies, it is a relief to note that the policy makers are trying to promote agricultural exports through some measures like—
- Free export of selected agricultural commodities.
- Removal of trade restrictions.
- Setting up of agri export zones. The concept essentially refers to a cluster approach of identifying the potential products and the geographical region in which such products are grown, and adoption of an end-to-end approach to integrate the entire process, right from the stage of production to consumption. Agricultural and Processed Food Products Development Authority (APEDA) is the nodal agency of the Central Government to promote setting up of the Agriculture Export Zones.
- Assistance for reducing the market costs such as transportation cost, handling and processing cost of export of the selected agricultural commodities.
- Duty-free imports of processing machinery and equipment.
- Duty-free imports of packaging machinery and equipment, and packaging materials and packaging systems.
- Arranging promotion campaigns such as exhibitions, participation in international trade fairs, etc.
- Warehousing assistance.
- Starting professional courses in agricultural marketing as part of the MBA and international business programmes.
- The government has proposed plans for the promotion of Total Quality Management (TQM) in agriculture.
- Joint ventures with non-resident Indians or others.
21.3 Imports of Agricultural Commodities
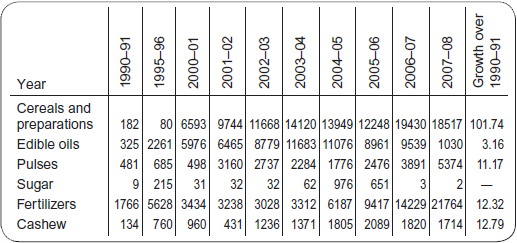
Imports also play a key role in deciding the terms of trade, just like exports. India’s major agricultural imports are cereals, edible oil, pulses, sugar, fertilizers and cashew. In the case of cereals, there is a steady fall in imports after 1990. The total imports of cereals remained at 101 million dollars in 1990–91, which steeply came down to 45 million US dollars in 2007–08. However, in rupee terms, a steep rise is reported from Rs 182 crores to Rs 18517 crores (Tables 21.11 and 21.12). Thus India still depends heavily on other countries for the supply of cereals. The other two major imports are edible oil and fertilizers. The import of these two products is continuously increasing over the years. The dollar value of the import of edible oil increased from 181 million US dollars in 1990–91 to 2558 million US dollars in 2007–08, the growth in rupee terms being 3.16 times. In the case of fertilizers, the import stood at Rs 984 crores in 1990–91 and reached Rs 5406 crores in 2007–08, the increase being 12.32 times. At the same time, the import of sugar has drastically come down. The share of agriculture imports in the total imports of India has hovered around 4 to 5 per cent. The overall trend in the imports shows that the dependency is gradually on a decline, and the country is becoming self-sufficient and surplus as far as the agricultural sector is concerned. Certain types of imports still continue as part of the bilateral trade agreements signed years back.
TABLE 21.11 Imports of Principal Agricultural and Allied Commodities (in US Million Dollars)

Source: Hand Book of Statistics on the Indian Economy, Reserve Bank of India (Various Years).
TABLE 21.12 Imports of Principal Agricultural and Allied Commodities (Rupees in Crore)
Source: Hand Book of Statistics on the Indian Economy, Reserve Bank of India (Various Years).
In the recent years, the government came out with the policy of lifting quantitative restrictions on imports. This has resulted in import of a number of agriculture products such as fruits, juices, meat products, etc. A section of the farmers also expressed their concern, since such a policy will adversely affect their prospects. Monitoring of the import of such sensitive products has so far revealed that imports of these products are limited and in total constitute only a small proportion of the total agricultural imports. However, liberalization of the quantitative restrictions is an expected threat in the future. Similarly, there are a number of Free Trade Agreements/Regional Trade Agreements (e.g., ASEAN agreement) signed or proposed by the government. Unless they are carefully implemented, the farmers, particularly the marginal and small farmers, will surely be affected mainly because of their limited bargaining power in the global market. The chair of the WTO Agriculture Negotiating Group has specifically identified certain elements in the Fourth Revised Draft Modalities Text in 2008, as areas where large negotiating gaps remain to be bridged. These are sensitive products, tariff quota creation, non-sensitive products with tariffs higher than 100 per cent, tropical and diversification products, preference erosion and the proposals for reduction in subsidies for cotton and tariff simplification. The Doha Round of WTO also raised some concerns in this direction. The round got a boost with the members adopting a framework outlining the elements and principles which will guide the further negotiations. The framework detailed modalities and specific commitments of each member in respect to agriculture and non-agriculture market access.
21.4 Indian Agriculture and WTO
When we discuss the trade in agriculture, it is compulsory and unavoidable that the discussions are associated to the WTO clauses. A summary of the salient features of WTO affecting agriculture trade is mentioned below.
- Tariffication: This means conversion of all non-tariff barriers on trade such as import quota into tariffs. Tariff bindings are to be reduced under this agreement. Least developed countries are exempted from the tariff reductions.
- Market access: In case that the tariff bindings are too high, current market access has to be maintained as the amount of exports to other countries, at the preferential tariff rates. Market access provisions do not apply when the commodity in question is a traditional staple in the diet of a developing country.
- Domestic support: WTO member countries are subject to follow obligations on domestic support to their agriculture.
- Aggregate Measure of Support (AMS): It is the annual level of support in monetary terms extended to the agriculture sector.
- Green box support: It is given on items which have minimal impact on trade like pest and disease control, market intelligence, infrastructure services, relief from natural disaster, etc.
- Blue box support: It is product limiting subsidy and pertains mainly to the developed countries.
- Special and differential treatment box support: It includes investment subsidy to the agricultural sector for farm development work.
- Export competition: Launching of measures for becoming competitive in the global trade. There are a number of measures that have been touched upon in the earlier discussions.
The impact of WTO on agriculture and agricultural trade is an elaborate topic, which requires separate discussion taking each WTO clause separately.
21.5 Terms of Trade in Agriculture
Terms of trade is the ratio between the export price and the import price. Thus a detailed calculation is possible only with the use of international prices, domestic prices and exchange rates. However, some broad trends have emerged. The developed countries account for the bulk of exports and imports in India. Of the developed countries, EEC and the United States have a major role. The reforms period also shows a greater dependence on these two destinations for the export of Indian products. As compared to the developed countries, trade with some developing countries formed only a meager amount. As regards imports, there was a decline in the trade with less developed countries and an increase in trade with OPEC countries because of a rise in the import of crude oil. To grow faster and also to compete with global scenario, the agricultural sector has to be made more export oriented. Exports should be encouraged more in value-added and processed form rather than in the raw form, because primary commodity prices in the world markets are unstable and also non-remunerative terms of trade go against them in such markets. A higher growth in agriculture, thus, needs a comprehensive revamp of the agriculture policy with reorientation towards rapid diversification of this sector. A progressive correction is required in the incentive structure for agriculture so that the excessively high minimum-support prices do not continue to distort resource allocation in agriculture. This will ensure that farmers diversify to high value-added segments of agriculture in response to the new demand structure.
References
Prasad, C. S. (Ed.) (2005) Sixty years of Indian agriculture (1947–2007). New Delhi: New Century Publications.
Prakash, B. A. (Ed.) (2009) The Indian economy since 1991 economic reforms and performance. New Delhi: Pearson.
Reserve Bank of India. (2006) Hand book of statistics on the Indian economy. 2005–06, Mumbai, RBI.
Government of India. Economic survey. (Annual) various years, New Delhi.
Planning Commission (2008) Eleventh Five Year Plan 2007–2012, Vol. 1–3, New Delhi, Oxford University Press.