7
Economic Planning in India
C. Narayan Lal and S. Rajesh Kumar
There is no unanimous idea about the meaning of the term ‘economic planning’. Different economists defined it differently on the basis of the different views formulated. We can identify economic planning as ‘a deliberate control and direction of the economy by a central authority, for the purpose of achieving definite targets and objectives within a specified period of time’. It is a technique of utilization of the resources in pre-determined goals within a specified time limit. So it entails an effective study on the problems and potentials of the economy concerned. In this chapter we will discuss the planning process in India. After providing an overview of the plans till the Ninth Five Year Plan, we have made an appraisal of the Tenth Five Year Plan and the approach of the Eleventh Five Year Plan.
7.1 History of Planning
The concept of planning is quite old and has been widely used from time to time in different ways and in a variety of senses. The idea of economic planning in its present form is comparatively new though it seems to be some what implicit in the Marxian Socialism. It was the Norwegian theorist Prof Krishnan Schonheyder, who first included the concept of planning in his definition of the economic activity. It was in 1910 that the idea of planning was given a practical application in Germany to administer the First World War. It was discarded when the war was over. But it was the former USSR which gave a real shape to the idea of economic planning. In 1928, USSR formulated its First Five Year Plan with a view to attain rapid economic progress. Yet another development happened in the 1930s when the capitalist world reeled under the Great Depression and became less confident with the market mechanism. It was then that the idea of planning became more popular as a panacea for these economic problems. The writings of Keynes, advocating state intervention in the economic matters further strengthened the belief in the efficacy of economic planning. The outbreak of the Second World War further necessitated economic planning. The war devastated the economies of Europe which were forced to adopt economic planning to restore themselves. Later, some of the South East Asian countries which attained freedom from colonial rule, also adopted economic planning as a means to attain rapid economic growth.
The history of economic planning in India dates back to 1934, with the publication of the first book on Indian planning titled Planned Economy for India by Sir M. Visvesvaraya. In 1937, the Indian National Congress, the populist political movement of that time, set up a National Planning Committee to prepare a national plan for India. But, because of some political problems the works of the committee were suspended from 1942 to 1946. The committee submitted its report in 1949. In due course, some leading industrialists of Bombay prepared a plan known as the ‘Bombay Plan’. Two other plans—‘People’s Plan’ by M. N. Roy, and ‘Gandhian Plan’ by S. N. Agarwal—were also formulated. After attaining Independence in 1947, the Government of India set up the Planning Commission and implemented the First Five Year Plan in 1950. The planning process proved to be effective towards economic progress, in the month of March.
7.2 Planning Process in India
In India, the Planning Commission of India is the core of the planning mechanism. It formulates and supervises the planning mechanism. The planning commission is helped and guided by several other policy making, programming and evaluating organizations at the centre and the state levels. Basically, Indian plans have a perspective outlook. In the first instance, the planning commission tentatively formulates certain basic goals for a relatively longer period, say 15 or 20 years. The commission sets these targets after a careful study of the social, economical and technical conditions and the future potentials. This forms a long-term perspective. After attaining approval from the government, certain broad five-year targets are tentatively framed so as to cover the first stage of the perspective plan. These five-year targets are placed before different working groups of the economists, administrators, technical experts, etc. Each group examines the implications of the proposed target for their respective spheres. They make recommendations, if necessary, to revise the long-term as well as short-term targets. They also specify the programmes and policies to be implemented to realize these targets. On the basis of these recommendations, the planning commission prepares a short memorandum on the five-year plan and submits it before the central cabinet and the National Development Council (NDC) for approval. After the approval, the planning commission prepares and publishes a draft plan which sets out the objectives of the plan estimates on resources and targets to be realized.
The draft plan is subjected to wide discussions in both the houses of the parliament. Then the planning commission sends the tentative targets to the central ministries and the states. When the consultations with the central ministries are over, the state governments are invited for discussions with the planning commission. On the basis of proposals by the central and the state governments, the final plan is formulated. The experts in the commission then make a careful examination of the programmes and project them for technical and economic consistency. After having necessary modifications, the final plan is formulated and presented to the cabinet, the NDC and the parliament for final approval. The plan approved by the parliament is then forwarded to a different department for execution.
7.3 Economic Planning in India: An Evaluation
Soon after independence, India started its development efforts with the motto ‘Growth with Social Justice’. India stepped into the era of economic planning in 1951, by launching its First Five Year Plan. Since then nine five-year plans have been completed and the tenth one is nearing competition. India is now all set to launch its eleventh plan. The planning process had its occasional disruptions. After the completion of the third plan in 1966, India faced some severe hostilities and so the fourth plan was postponed. But for the intervening period from 1966 to 1969 there were three annual plans. Similarly, in the sixth plan, there were two versions, i.e., the Draft Five Year Plan 1978–83 by the then ruling Janata government, and the other by the later elected Congress government for the period 1980–85. There was also a two-year break (1990–92) between the seventh and the eighth plans. However, there were two annual plans for this period. It was due to changes in the political situations. Thus India has passed through 56 years of economic planning. The time path of the Indian plans is shown in Table 7.1. In the ensuing sections, we discuss the progress of the economic planning in India, targeted and realized growth rates, and the national and per-capita output as given in Table 7.2. The sectoral distribution of the plan outlays is reported in Table 7.3.
7.3.1 First Five Year Plan (1951–56)
While launching the first plan in 1951, India was beset with three major problems. They were (1) influx of refugees as a result of partition of 1947; (2) severe food shortage and (3) mounting inflation. Hence the plan emphasized these problems. It was a moderate attempt, with a total expenditure of Rs 2069 crores. The plan accorded the highest priority to agriculture and community development. In the first two years, the emphasis inevitably was on correcting and controlling inflationary pressures, and on restoring the economy to a position of balance.
TABLE 7.1 Time Path of Indian Plans
| S. No. | Plans | Plan period |
|---|---|---|
1 |
First Plan | 1 April 1951 to 31 March 1956 |
2 |
Second Plan | 1 April 1956 to 31 March 1961 |
3 |
Third Plan | 1 April 1961 to 31 March 1966 |
4 |
Annual Plan | 1 April 1966 to 31 March 1967 |
5 |
Annual Plan | 1 April 1967 to 31 March 1968 |
6 |
Annual Plan | 1 April 1968 to 31 March 1969 |
7 |
Fourth Plan | 1 April 1969 to 31 March 1974 |
8 |
Fifth Plan | 1 April 1974 to 31 March 1978 |
9 |
Annual Plan | 1 April 1978 to 31 March 1979 |
10 |
Annual Plan | 1 April 1979 to 31 March 1980 |
11 |
Sixth Plan | 1 April 1980 to 31 March 1985 |
12 |
Seventh Plan | 1 April 1985 to 31 March 1990 |
13 |
Annual Plan | 1 April 1990 to 31 March 1991 |
14 |
Annual Plan | 1 April 1991 to 31 March 1992 |
15 |
Eighth Plan | 1 April 1992 to 31 March 1997 |
16 |
Ninth Plan | 1 April 1999 to 31 March 2002 |
17 |
Tenth Plan | 1 April 2002 to 31 March 2007 |
18 |
Eleventh Plan | 1 April 2007 to 31 March 2012 |
TABLE 7.2 Targeted and Realized Growth Rates of National and per-capita Output: Different Plans

Source: Government of India Economic Survey 2001–02.
TABLE 7.3 Sectoral Distribution Plan Outlays

Note: Figures in parenthesis shows percentage to the total.
Source: 1. Government of India Planning Commission, Various Five-Year Plans.
2. Government of India Economic Surveys 1998–99 and 2002–03.
The overall results of the plan were encouraging; there was an increase in the national income over the plan period by about 18 per cent. Food grains production went up to 20 per cent and over 16 million acres of land was brought under irrigation. The index of the industrial production also went up by 22 per cent. There was considerable improvement in power generation. Though the plan emphasized agriculture, irrigation, power and transport, it also aimed at creating a base for more rapid economic and industrial expansion in future years. The plan also laid foundations for social and institutional reforms to accelerate the development process. The plan offered people, not only the goals, but also the means with the cooperation and the mobilization of local resources. The plan thus evoked public enthusiasm and gave a new dimension to economic thinking and policy outlook.
7.3.2 The Second Five Year Plan (1959–61)
The second plan was formulated and implemented in an atmosphere of economic stability and confidence brought about by the first plan. The plan aimed at giving a ‘big-push’ to the economy. The time was ripe to shift the focus from agriculture to industry to give a big boost to the economy on modern lines. So the plan concentrated on the development of the basic and heavy industries to lay the foundation for future industrialization. The plan also highlighted the key role the public sector had to play in the development process and the need for a socialistic pattern of society. So it set the objectives of increasing employment opportunities, and brought about a more even distribution of income and wealth. The plan had a total developmental outlay of Rs 4800 crores. The overall results of the second plan were also satisfactory. The plan had the target of a 4.5 per cent increase in the national income, and was able to realize a 4.1 per cent increase.
7.3.3 The Third Five Year Plan (1961–66)
The third five-year plan aimed at an intensive development leading to a self-reliant and self-generating economy. As a result of the progress achieved during the first and the second plans, the Indian economy had become much larger in size and the range of its operations had become more dynamic and complex. So the third plan aimed at maximizing the rate of investment. The plan set the target of an increase in the national income by over 5.6 per cent per annum and to sustain this rate of growth in future. It emphasized the agriculture development programmes with a view to achieve self-sufficiency in food grains and to meet the industrial and export requirements. The plan had the objective of expanding the basic industries to make India self-reliant in future industrial efforts. Another objective was to secure a substantial expansion in employment opportunities and to utilize manpower resources to the fullest possible extent. The plan also wanted to establish progressively greater equality of opportunities and reduce income and wealth disparities and a more even distribution of the economic power. In the scheme of development during the third plan, the first priority necessarily belonged to agriculture. Experience of the first two plans, especially the second plan, had proved that the rate of growth in agricultural production is one of the main limiting factors in the progress of the Indian economy. The plan had a total outlay of Rs 4600 crores. Out of this, 20 per cent was for agriculture and irrigation and 24 per cent for industry and mining. Social services got a share of 18 per cent. The plan had a targeted growth rate of 5.6 per cent, but was able to realize only 2.5 per cent, i.e., less than half of the targeted rate.
7.3.4 Annual Plans (1966–69)
In the late 1960s, India came under severe shocks such as hostilities with the neighbouring country of Pakistan (1965), drought for two successive years (1965–67), devaluation of the rupee (1966) and severe inflationary pressures. Consequently the draft outline of the fourth plan prepared in 1966 had to be abandoned. Instead three annual plans (1966–67, 1967–68, 1968–69) were prepared and implemented within the framework of the draft outline of the fourth plan. The planning process was resumed when the Fourth Five Year Plan (1969–74) became operational in 1969. The agricultural glut in the two consecutive years (1965–66 and 1966–67), decline in the rate of growth of industrial production and the inflationary pressure, eroded the resources available for the annual plans. Non-plan expenditure became very high and, at the same time, the government was not in a position to mobilize enough revenue resources. Forced by these, the government resorted to deficit financing, which reached a level of Rs 676 crores during the period of annual plans.
The annual plans gave the highest priority to the agricultural production and productivity, particularly to schemes which were quick yeilding and helped to augment production in the shortest possible time. It was during the annual plans that India underwent the ‘Green Revolution’, which actually revolutionized the Indian farm sector and made the country march towards further progress. The plan also gave priority to the family planning programmes, industry and mining, transport and communication, social services, etc.
7.3.5 The Fourth Five Year Plan (1969–74)
The fourth plan aimed at accelerating the tempo of development with economic stability and progress towards self-reliance. The plan highlighted the objective of setting up a socialist pattern of the society, and so it sought to raise the standard of living of the masses through policy package, designed to promote equality and social justice. The plan laid a special emphasis on uplifting the less privileged and weaker sections of the society mainly through the provision of employment and education. The plan also announced programmes to promote social and economic equity. The plan envisaged an outlay of Rs 24,882 crores. Of this, Rs 15,902 crores was earmarked for the public sector programmes and Rs 8980 crores for the private sector. The plan aimed at a growth rate of 5.7 per cent in the national income but could realize only 3.3 per cent.
7.3.6 The Fifth Plan (1974–79)
The Fifth Five Year Plan was drafted when India was reeling under a severe inflation caused by unprecedented increase in the international oil prices in the wake of 1973 Gulf Crisis. The sharp increase in the prices of food, fertilizers and oil seriously upset the assumption on which the draft of the fifth plan had been framed. These facts necessitated a time-bound programme to achieve a measure of self-reliance in food and energy. The most important objectives of the plan were the removal of poverty and achievement of self-reliance. The strategies related to growth in the three leading sectors, viz, agriculture, energy and critical intermediates, and the generation of additional employment opportunities. But all these objectives had to be subordinated to the control of the inflationary pressures caused by both domestic and international factors.
The plan had a total public sector outlay of Rs 39,320 crores, earmarking 22 per cent for agriculture and irrigation, 26 per cent for industry and mining, and 20 per cent for transport and communication. The plan initially set a target of 5.5 per cent increase in the national income. But the plan could not complete its five years. It was terminated at the end of the fourth year (March 1978) by the newly elected Janata government. The initial plan of the Janata government was to introduce the ‘Rolling Plan’, the type of plan which was well executed in China. But they were satisfied with the two annual plans, 1978–79 and 1979–80. The fifth plan over the four years, brought about 5 per cent increase in the national income.
7.3.7 The Sixth Five Year Plan (1980–85)
The Sixth Five Year Plan was formulated taking into account the achievements and failures of the past three decades of planning. The sixth plan was launched with the prime objective of removing poverty, rural development and a balanced regional development. A substantial increase was provided in the plan outlays for the ‘Special Area Programmes’, in keeping with the objective of reducing regional disparities. The plan was formulated against the background of a long-term perspective covering a period of 15 years from 1980–81 to 1994–95. This development perspective aimed at accelerated progress towards the removal of poverty, generation of gainful employment and technological and economical self-reliance. The plan also aimed at speedy development of indigenous sources of energy with proper emphasis on conservation and efficiency in energy use and development and protection of ecological and environmental assets.
The plan envisaged a total outlay of Rs 97,500 crores. Compared to the fifth plan, it represented an 80 per cent increase in real terms. But the actual expenditure stood at Rs 109,291.7 crores at the current prices. Of the total outlay, 24 per cent was for agriculture and irrigation and 27.8 per cent for industries and mining.
The plan achieved an annual growth rate of 5.4 per cent, which was in excess of the targeted rate of 5.2 per cent. Industrial output went up by 5.5 per cent per annum, but it was less than the targeted rate of 7 per cent. The food output increased to 14.6 crore tonnes. The poverty ratio came down from 48 per cent in 1977–78 to 37 per cent in 1984–85, though this was challenged later by some Indian economists. The aggregate growth target set for the plan was achieved mainly because of good agricultural performance and rapid growth in the services sector.
Although the growth path improved much during the sixth plan, the problem of inflation, unemployment and inequalities continued unabated. There was a total trade deficit of Rs 28,558 crores during 1980–85, which put strain on the balance of payments position. Deficit financing was also 2.5 times more than the expected, and it accentuated the inflationary trends. But the overall performance of the plan was encouraging. On the whole, the sixth plan was fairly successful in sustaining and further strengthening the impulses for growth, modernization and social justice. The successful implementation of the plan also enhanced India’s ability to deal with the chronic problems of poverty and under development.
7.3.8 The Seventh Five Year Plan (1985–90)
The Seventh Five Year Plan was formulated at a time when the Indian economy was experiencing some sort of strength and vitality. The success of the sixth plan generated confidence on the part of the planners and administrators. It induced them to go for larger amounts of investment. So the plan envisaged a massive public sector outlay of Rs 1,80,000 crores. But the actual expenditure incurred was Rs 218,729.62 crores (current prices).
The plan emphasized policies and programmes to increase food production, employment opportunities and productivity. It stressed the need to accelerate the tempo of growth, and sought to push the process of economic and technological modernization of the economy further forward. The plan also stressed the need to intensify the poverty alleviation programmes. The plan presented a comprehensive strategy for agricultural development and set a targeted growth rate of 4 per cent per year in agricultural production. The plan had an actual expenditure of Rs. 26295 crores for the development of industries and minerals, and realized an annual growth rate of 8.5 per cent in that sector. In order to facilitate the growth process, the plan also placed increased emphasis on investment in the infrastructure. Nearly 31 per cent of the total public sector outlay was meant for energy. The generation of power was expected to grow at an average annual rate of 12.2 per cent over the plan period. It was in the seventh plan that employment has been treated as a direct focal point of policy. In the earlier plans, it was viewed as a residual plan, resulting from the growth process. In the early years of the plan, the growth rate recorded a decline but registered an increase in the last two years of the plan, thereby giving an annual average growth rate of 5.8 per cent as against the target of 5 per cent. Significant advances had been made in the industrial and infrastructural sectors during the seventh plan. These fields attained considerable technological improvements. The plan expected to raise the rate of domestic savings and investment to 24.5 and 25.9 per cent, respectively, of the GDP by 1989–90. However the actual rates realized were 20.3 and 22.7 per cent, respectively.
The seventh plan also experienced some difficulties. It was faced with an increasing strain on the balance of payments, budgetary deficits price level, etc. The level of deficit financing was two and a half times greater than expected. Thus, though the plan gained its growth targets, it generated various stresses and strain on the economy.
7.3.9 The Eight Five Year Plan (1992–97)
The year 1990 marked revolutionary changes in the Indian economy. Coping up with the world trends, India also stepped into the waves of liberalization, privatization and globilization. So there was a wide spectrum of economic reforms and structural adjustment programmes. The eighth plan was to be commenced in 1990–91, but could not, because of the political changes. The newly elected government decided to implement the eighth plan from 1 April 1992 (there were annual plans for 1990–91 and 1991–92 with a thrust on maximization of employment and social transformation).
During that time the economy was facing severe challenges. First there were fiscal problems, which posed a severe constraint on the availability of resources. However, at the same time India had to ensure that the stimulus for sustained long-term growth was to be strengthened in future. Moreover, the process of economic reforms and structural adjustments had to be carried forward without sacrificing the momentum of growth. Secondly, India had to roll back public sector investment from those sectors of the economy where the private sector could move in, and also to step up its investments in the social sector. Thirdly, it was to be ensured that the growth process should benefit the poor, and the changed pattern should not stand against them.
Thus the eighth plan had some special features which distinguished it from the earlier plans. They were—(1) the plan was indicative in nature rather than directional; (2) it recognized human development as the core of all development efforts; (3) it attempted to correct the fiscal imbalances from which the sixth and seventh plans suffered; (4) it was an integrative plan and so proposed to bring together the various deparments/agencies dealing in the rural development, energy and transport, etc. under one roof for co-ordinated policy formulation and implementation; (5) it recognized the importance of people’s participation in the process of development by changing the attitude of passive observance and total dependence on the government for development activities; (6) the plan was performance-oriented. It concentrated not so much on its allocative role but on optimal utilization; and (7) the plan paid special attention to employment in the rural areas so as to check migration to the urban centres. So the strategy called for a shift of emphasis from the creation of relief employment to the building up of the durable productive assets in the rural areas which could generate more employment and lead to a sustained development. It was more flexible with a scope for change, innovation and adjustment.
7.3.9.1 Objectives and Strategy The following were the objectives of the eighth plan.
- To secure an average growth rate of 5.6 per cent per annum.
- Generating employment to achieve near full employment by the turn of the century.
- To control population growth through people’s effective cooperation.
- Universalization of elementary education and eradication of illiteracy among the age group of 15–35.
- Provision of safe drinking water and primary health care to all villages.
- Growth and diversification of agriculture to achieve self-sufficiency in food.
- To strengthen the infrastructure (energy, transport, communication and irrigation).
From the objectives listed, above, it can be noticed that human resource was the main thrust of the plan.
The strategy followed by the eighth plan had the following main aspects.
- Resource allocation to the priority areas was made through central plan assistance. Emphasis was also laid on resource mobilization by the state government.
- Allocation of funds for human resources development was done by creating self-managing organizations at the village, block and district levels.
- To promote human resource development, a national grid on the non-governmental organization was created, so as to boost the resource mobilization through the NGOs.
- To promote rural development, a net work of trained and motivated experts and individuals, who were willing to work in the rural areas in honorary capacity, was also set up.
- A system of incentives and disincentives was introduced for the achievement or nonachievement of the agreed targets.
The plan stressed the need for continued reliance and domestic resources for the financing investment. It also stressed the need for reduced dependence on borrowings, domestic as well as foreign, and also on deficit financing. It placed greater reliance on buoyancy in the tax and non-tax revenue for financing the plan. The eighth plan envisaged a total investment of Rs 798,000 crores at 1991–92 prices. Of this, Rs 361,000 crores or 45.2 per cent of the total investment was for the public sector and the rest 54.8 per cent for the private sector. Thus, the private sector was accorded a bigger role in the eighth plan compared to the earlier plans. The plan aimed at a growth rate of 5.6 per cent together with a relative price stability and substantial improvement in the balance of payment position.
7.3.9.2 Appraisal of the Eighth Plan The eighth plan was introduced within the framework of structural reforms of the 1990s, whereby India made revolutionary changes in its economy. So the plan appraisal cannot be separated from a review of the reforms during the plan period. The initial spurt of the economic reforms from 1991–92 to 1994–95 was highly successful. It resulted in a continuous increase in the growth rate from 0.9 per cent in 1991–92 to 7.2 per cent in 1994–95. However, since 1994–95, there was a marked slowdown on this reform process. Nevertheless, GNP increased by 7.8 per cent in 1995–96 and by 8.1 per cent in 1996–97. Thus the eighth plan ended up with an average growth rate of 6.8 per cent per annum, i.e., 1.2 per cent higher than the targeted growth rate of 5.6 per cent. It is important to note that the average growth rate during the last three years of the plan was seven per cent, which placed India among the top ten performers of the world.
In spite of a reasonably good macro-economic performance, the plan suffered from certain weaknesses. In the first place, the development achieved in the agriculture sector was less than satisfactory. Agricultural investment and credit availability remained stagnant. Much of the growth in the output and employment was due to the good monsoons. Secondly, the plan failed to achieve the target set for the infrastructural facilities like power, transport, communication, etc. Thirdly, there had been a decline in the share of state’s total plan outlay in the eighth plan. When the state’s share declines, the sectors like agriculture, electricity, health, education and basic minimum services will suffer. Finally, the import and export trends were less promising and so the balance of payment position remained unstable. The plan also experienced an average inflation rate of 8.8 per cent.
7.3.10 The Ninth Five Year Plan (1997–2002)
The Ninth Five Year Plan was launched in the 50th year of India’s independence. The people of India had demonstrated their ability to forge a nation united, despite its diversity, and their commitment to pursue development within the framework of a vibrant and dynamic democracy. The democratic institutions had put down firm roots and flourished with the development taking place on a wide front. India felt that, it was the right time to redouble its efforts at development, especially in the social and economic spheres, so that, the country could realize its full economic potential and the poorest and weakest would be able to enjoy the fruits of development. In such a back ground, the ninth plan was formulated with the objective of ‘Growth with Soul Justice’.
7.3.10.1 Objectives and Strategy The approach to the ninth plan was characterized by an explicit recognition of the integral link between rapid growth and improvement in the quality of life. It also recognized the need to pursue pro-poor policies, and to correct the income and wealth disparities. The more specific objectives were the following.
- Accelerate the process of economic growth with stable prices.
- Promote agriculture and rural development, so as to generate enough productive employment and to eradicate poverty.
- Ensure food and nutritional security for all, particularly the vulnerable sections of the society.
- Provide the basic minimum services for safe drinking water, primary health care facilities, universal primary education and housing facilities to all in a time-bound manner.
- Control population growth.
- Ensure environmental sustainability of development process, through social mobilization and participation of people at all levels.
- Empower women as an effective agent of social and economic change.
- Empower the disadvantage groups like SC, ST and other minorities.
- Strengthen and speed up the efforts to attain self-reliance.
The ninth plan strategy was much more market-oriented than the earlier ones. Despite a vibrant private sector and a functioning market economy, the role of the government had been dominant, as an investor, producer and an arbitor of the private sector programmes. The plan also followed a greater decentralization, and improved the monitoring and enforcement systems. The main elements of the development strategy were the following.
- The most important aspect was its decentralized style of operation. One component of decentralization was its greater reliance on the market forces. The other was decentralization within the government system itself, whereby a freedom was given to the subordinate forms of the government.
- The cooperatives had been perceived as the most important institutions for promoting equity, social justice and economic development, and so freed from bureaucratic controls. The Self-Help Groups (SHGs), associations of workers or small producers were encouraged.
- The strategy also took note of the changing role the public sector had to play. Investment in areas feasible for the private sector was turned over to them. The resources thus released were to be utilized on areas where private sector investment was not feasible or inadequate. So there were policies of disinvestment in the public sector units. Moreover in areas de-reserved for public sector units, steps were taken to ensure that private investment was economically feasible.
- The strategy identified the importance of economic infrastructure and the need to enlarge it and make it internationally competitive. For that sake private participation was also encouraged. Similarly, new initiatives for additional investmentand optimum utilization of the existing capacity were also taken into account. This was done by technology upgradation and by ensuring public utilities to function on commercial lines.
- The approach to encourage small scale sector was shifted from protective to supportive and promotive.
- There were also steps to reform financial sector to restore fiscal health, to evolve sound foreign trade and investment policies, and to maintain balance of payments stability.
7.3.10.2 Appraisal of the Ninth Plan The performance of the ninth plan should be evaluated in thecontext of its exceptional circumstances. The East Asian Crisis in 1997 had a depressive effect on foreign investment in India and also on its potential export markets. In 1998, the economic stipulations imposed by some countries created some uncertainty initially, though the investor confidence was restored later. The disputes in Indo-Pak border and the steep increase in oil prices in 2000 adversely affected the plan operations.
The ninth plan proposed an investment of Rs 2,171,000 crores at 1996–97 prices. Of the total investment, 92.6 per cent was expected to be met from domestic sources. Investment in the public sector was only 33 per cent of the total. The plan assumed an Incremental Capital Output Ration (ICOR) of 4.3, which implies an assumption of the average domestic savings and investment rates of 26.1 and 28.2 per cent of GDP, respectively. The growth rate of the economy during the plan years was less than the targeted rate of 6.5 per cent per annum. In 1997–98 the economy experienced a record growth of 6.8 per cent mainly because of the increase in agricultural production.
The manufacturing sector, however, continued to perform badly as it grew at a rate marginally below 4 per cent. But the services sector continued to perform well. Four sectors like construction, communication, public administration and other services had performed much better than expected. The growth in other services was mainly because of the development in the software sector. The average annual growth rates for the economy were 5, 6.8, 5.9, 6.45 and finally 5.2 per cent as against the average annual growth target of 6.5 per cent. For the agricultural sector the plan had a target of 234 million tonnes of food grains but could achieve only 209 million tonnes. The economy also experienced inflationary trends. But the overall macro indicators showed an upswing and the ability of the Indian economy to wed up global competitions.
7.3.11 Tenth Five Year Plan (2002–07)
The buoyancy reflected in the Indian economic atmosphere in the post-reform period calls for challenging strategies to uphold India’s strength and competitiveness in the world economy. GDP growth in the post-reform period has improved from an average of about 5.7 per cent in the 1980s to an average of about 6.5 per cent in the eighth and ninth plan periods, making India one of the fastest growing developing economies. Decelerating population growth and literacy, fast growing knowledge and economy—all that add a silver line in India’s development path.
However, in the midst of these silver lines there is a galaxy of other Indian facts which pave the way for large concerns. These are several aspects of development, where progress is clearly disappointing. Although employment growth has almost kept pace with the labour force growth, the incidence of unemployment on the current daily status basis is relatively high at above 7 per cent. More than half of the children 1–5 years old in rural areas are under-nourished. The Infant Mortality Rate (IMR) has stagnated at 72 per 1000 for the last several years. Deterioration in the urban environment, increase in the slum population and the alarming population has vastly affected the quality of life of the urban poor. The decline in the juvenile sex ratio over the last decade, visible in the data from Census 2001, is an indication that the constitutional assurance of freedom and equality for women is still far from being fulfilled.
In this background, the tenth plan provides an opportunity at the start of the new millennium not only to build upon the gain of the past, but also to address the weakness that has emerged. It is the platform to respond to the growing impatience in the country at the fact that a large number of populations continue to live in abject poverty, and there are alarming gaps in our social attainments even after five decades of planning.
7.3.11.1 Objectives and Strategies of Tenth Plan The Tenth Five Year Plan has been formulated in the context of the vision of doubling per-capita income in the country, within the next ten years and also of creating 100 million employment opportunities during the same period. Such an ambition target requires a medium-term strategy and a calibrated change in policies. The corresponding GDP growth targets that have been adopted are 8 per cent a year during the tenth plan and 9.3 per cent a year during the eleventh plan. The ultimate objective of the tenth plan is a substantial improvement in the well being of the entire population. GDP growth of 8 per cent is thus both a target and an instrument for improved welfare. Likewise, achievement of some of the social goals is necessary for sustained economic growth performance in the future. To emphasize the primacy of the social development goals, the tenth plan has set out 11 monitorable indicators, which are listed below.
7.3.11.2 The Core Strategy The Planning Commission’s tenth plan targets are given in Table 7.4. The core strategy is driven by the recognition that growth to a new plateau of performance cannot be achieved by containing the existing practices. It will require radical departures from the prevailing policies. The key elements of the tenth plan strategy are as follows.
Monitorable Social Development Targets
Reduction of the poverty ratio by 5 per cent points to 21 per cent by 2007, and by 10 further points to 11 per cent by 2012.
Providing gainful and high quality employment at least to the addition to the labour force over the tenth plan period.
All children to be in school by 2003; all children to complete five years of schooling by 2007.
Increase in literacy rates from 65 to 75 per cent within the plan period.
Reduction in gender gaps in literacy and wages by at least 50 per cent by 2007.
Reduction in the IMR from 70 to 45 per 1000 live births by 2007 and to 28 by 2012.
Reduction in the decadal rate of population growth from 21.3 per cent between 1991 and 2001 to 16.2 per cent between 2001 and 2011.
Reduction in the Maternal Mortality Ratio (MMR) to 2 per 1000 live births in 2007 and 1 by 2012.
Increase in the forest and tree cover to 25 per cent by 2007 and 33 per cent by 2012.
All villages to have sustained access to potable drinking water within the plan period.
Cleaning of all major polluted rivers by 2007 and other notified stretches by 2012.
TABLE 7.4 Planning Commission Tenth Plan Targets
| Variables | Target rates | |
|---|---|---|
| GDP growth rate | 8.0 |
|
| Gross investment rate | 32.6 |
|
| ICOR | 4.08 |
|
| Gross domestic saving rate | Public sector | 4.6 |
| Private corporate sector | 5.8 |
|
| Household sector | 19.4 |
|
| Total | 298 |
|
| Current account deficit ratio (foreign saving) | 2.8 |
|
| Consolidated fiscal deficit ratio | 3.3 |
|
| Consolidated revenue deficit ratio | 0.8 |
|
Source: Planning Commission, Tenth Five Year Plan (2007–12), Vol. 1.
Strengthening Governance: The governance comprises of the provision and management of institutions and processes within which citizens and their organizations operate. Good governance enables the citizens to exercise choices, reconcile differences fairly and achieve their full potential. Disparities in performance between the different parts of the nation are often the result of poor governance.
The programme to strengthen governance can be summarized in three categories.
- Changing the role of the governments. The rationale for and direction of change is as follows.
- Liberalization of the economy means that the state should relinquish progressively many decisions to the market and civil society. The role and size of governments can diminish accordingly, although regulations of the competition become more important.
- Privatization of the public sector undertakings will provide the opportunity to cut down on the size of the governments both at the centre and in the states.
- There is a strong case for further simplification of tax administration.
- The use of subsidies by the government to insulate large elements of the population from the real cost of production or delivery has become remorseless.
- The strength of civil organization such as non-governmental bodies in contributing to national development will be encouraged. The government cannot do everything.
- The implementation of the above measures will enable the governments to contract in size with such ‘rightsizing’ under the tenth plan, and a 2 per cent per annum reduction in the government staff targeted.
- Improving government’s performance at all levels. The tenth plan proposes to implement a range of reforms designed to improve the government’s performance. The key theme running through them is openness and accountability in administration. The main elements are as follows.
- Decentralization has been shown to improve the participation of beneficiaries and the civil society in decision-making and improving accountability.
- The right to information needs to be embodied.
- Reform of the civil services will be undertaken so as to strengthen accountability and sensitivity.
- The delivery of support especially in schemes designed to help the poor is less effective in the poorer states, whose administrative capabilities are weaker. Therefore central support should be reform linked, based on the conditionalities set out in a Memorandum of Agreement.
- Introduction of the Fiscal Responsibility Bill in the state legislature.
- Improving corporate performance. Given that more reliance, than at any time since the first plan, is now being placed on the performance of the private sector. The main actions proposed in the tenth plan are the following.
- Indicial reform to ensure that contracts can be honoured and disputes resolved fairly and swiftly.
- Limitations on interstate trade will be lifted during the plan period.
- Liberalization and combining of all legislation on property transactions into one law.
- Legislation is being introduced to enable swift transfers of assets to take place to new users.
Poverty Reduction: All plans in India have had the reduction of poverty as one of their prime objectives, and there have been substantial achievements here. However, despite of food grain surpluses, a major effort in the primary education and the basic health programmes and an enormous magnitude of special targeted interventions, the incidence of poverty remains unacceptably high. Poverty is highest in the poorest states, as would be expected, although there are exceptions such as Kerala, which has a per-capita income below the national average, but has high literacy and good access to infrastructure. The tenth plan faces a double challenge in the states with relatively low income today and also those which are likely to grow at a below average rate for the next few years. Prominent amongst these are Bihar, Odisha, Assam, Madhya Pradesh and to a lesser extent Utter Pradesh. The following are the major poverty reduction strategies in the tenth plan.
- To seek to attain the most rapid growth possible and sustain it over a decade so as to increase income and demand for labour. The tenth plan targets GDP growth rate at 8 per cent.
- To ensure that the pattern of output is as labour-intensive and capital saving as possible.
- To ensure that the best attainable growth rates are achieved by the states and areas with the largest concentration of the poor. This will be helped by the implementation of good governance actions.
- To provide additional central resources for the states to undertake effective reform programmes.
- To target vulnerable minorities that might not be able to benefit from other programmes.
Employment: The conviction behind the adoption of an 8 per cent per annum growth targets rests on the assessment that more rapid growth is a necessary, but not a sufficient condition for reducing unemployment and poverty. On the employment front, given the expected growth in the size of the labour force, the planning commission analysis shows the following (Table 7.5).
TABLE 7.5 Growth and Unemployment Rates
| GDP growth rates | Unemployment in 2001–02 | Unemployment in 2006–07 |
|---|---|---|
| 6.5% without changes in policies | 9.2 |
11.0 |
| 6.5% with changes | 9.2 |
9.3 |
| 8% without changes | 9.2 |
9.8 |
| 8% with changes | 9.2 |
5.2 |
Source: Tenth Plan Approach, Planning Commission.
The tenth plan estimated an additional job creation of 29.67 million as growth related. On the basis of 8 per cent GDP growth rate the tenth plan planned to curb the unemployment level to 5.2 per cent. For this the tenth plan has recommended some labour-intensive sectors which require policy interventions.
The total employment generation will be of the order of nearly 49 million comprising of 8 per cent growth generated to be 29.67 million and programme generated to be 19.32 million (Table 7.6). If things are going on in this fashion, unemployment will be at 5.2 per cent.
Agriculture: The agricultural growth slowed down markedly during the 1990s compared with the 1980s. In food grains, in which the nation has a modest surplus, annual production growth went down to 1.3 per cent from 3.3 per cent and non-food grains to 2.8 per cent from 4 per cent.
The reasons for the slowdown are complex and differ from region to region. It is clear, though, that the public investment in agriculture fell as the subsidies absorbed resources, but private investment rose. The aim of the National Agricultural Policy is to restore growth to its best past levels of about 4 per cent per annum. Within this, total hope is attached particularly to maize, among the food grains. Horticulture, fisheries, livestock including feed and fodder, dairy products, fruit, oil seeds, agro-forestry, bio-fuels, medicinal and aromatic plants, and pulses are also areas offering growth potential. Given this diversity, and the further diversity of the regions, types of terrain, climate and soils, it is hardly surprising that the tenth plan is similarly diverse in its thrust in agriculture. These are over 130 intended areas for action, based on a number of expert committee’s reports.
TABLE 7.6 Programme Generated Additional Employment During the Tenth Plan
| Development initiatives | Employment opportunities (million) |
|---|---|
| Agriculture and allied activities | 3.55 |
| Greening the country through agro-foresting | 3.50 |
| Energy plantation for bio-mass power generation | 2.01 |
| Rural sectors and small and medium industries | 7.06 |
| Education and literacy | 1.70 |
| Employment through Information and Common Technology (ICT) | 0.70 |
| Health, Family and Child Welfare Services | 0.80 |
| Total | 19.32 |
Source: Planning Commission; Tenth Five Year Plan (2002–07) Vol. 1, p. 15.
Industry: The industrial sector will have to grow at over 10 per cent to achieve the tenth plan target of 8 per cent growth for GDP. This represents a major acceleration from its past performance; the sector grew at only about 7 per cent in the eighth- and ninth-plan periods taken together. Besides, this acceleration has to take place in an environment, which will be significantly different from the past. Two differences are particularly important. First, the industry will have to face much stronger international competition. Second is the declining relative role of the public sector. Therefore the tenth plan tries to focus on creating an industrial policy environment in which the private sector companies including the earlier public sector companies can become efficient and competitive. The main initiatives being carried into the tenth plan are as follows.
- Technology and market support—technology upgradation fund scheme for the textile sector, market access initiatives and investment in research and development.
- Decontro—phased de-reservation for the small scale sector over a period to allow adjustment and preserve employment. New competition bill to replace the MRTP Act of 1969. Review of the labour laws. Further liberalization of the FDI.
- Disinvestments of public sector undertakings will continue, and thus enable assets to be redeployed or restructured for a stronger performance.
Foreign Trade: The vision of the tenth plan regarding the foreign trade sector is as follows.
- India’s share of most markets abroad is still relatively small (under 1 per cent of global trade), so further market penetration during the tenth plan is feasible even if there is a slowdown, globally.
- The real effective exchange rate appreciated slightly. Both the Foreign Direct Investment (FDI) and the institutional investments grew markedly over the 1990s. However, the reserves rose and the debt declined.
- If the economy is to grow by 8 per cent a year, in the tenth plan, exports must grow by over half as much again, i.e., 12.4 per cent per annum. Imports would grow from $45 million in the ninth plan to $80 billion in the tenth plan.
7.3.11.3 Appraisal of Tenth Plan
Growth Performance: The economy accelerated in the tenth-plan period (2002–03 to 2006–2007) to record an average growth of 7.7 per cent, the highest in any plan period so far. Overtaking the poor performance, marked in the last four years of the plan, has averaged to 8.7 per cent, making India one of the fastest growing economies in the world.
TABLE 7.7 Sectoral Growth Rates (% per Annum)
| Sector | Tenth plan |
|---|---|
| 1. Agriculture | 2.30 |
| 2. Industry | 9.17 |
| 3. Services | 9.30 |
| 4. Total | 7.74 |
Sectoral Growth Rates: The major sectoral growth rates can be summarized as follows (Table 7.7).
Agriculture: The tenth plan had targeted a four per cent growth of the agricultural GDP per year aiming to reverse the deceleration in the second half of the 1990s from 3.2 per cent in 1980–96 to 2.6 per cent in 1996–2002. However, the realized figures show the continuation of the deceleration process. Even though the achieved growth rate of agriculture is 2.30 per cent, its period-wise composition throws light on the path of revivalism in agriculture. It may be noted that agricultural growth increased from less than 1 per cent in the first three years of the tenth plan to an average of more than 4 per cent in the last two years. Although the tenth plan had aimed to reverse deceleration in the agricultural growth, its allocation for agricultural growth was relatively modest. Zero-based budgeting was expected to bring about a convergence between various central sectors and centrally sponsored schemes. But actual integration had been slow and many schemes continued to maintain a specific identity.
Industry: Industrial performance in the tenth plan period improved to a respectable 9.2 per cent from the very low growth rate of 4.3 per cent in the ninth plan. Within the industry the manufacturing sector, accounting for 77 per cent of the industrial output, has shown a significant growth acceleration in the last two years. This revival of dynamism reversed the unacceptable decline in the share of manufacturing in GDP that has happened since 1991.
Service Sector: The services sector has grown impressively in successive plans with a sharp acceleration in the tenth plan period. The remarkable growth rate of services sector achieved in the Tenth plan, such as 9.3 per cent reflecting the rapid growth in the high-end services spurred by the IT revolution and which paved the way for high quantum of attractive employment opportunities for the educated youth.
Investment and Saving Rates
Investment: An important structural change in the investment behaviour of tenth plan is the change in relative shares of public and private investment. The trend of a declining rate of public investment as a per cent of GDP continued in the first two years of the tenth plan, but then began to be corrected in the rest of the plan period. Private sector investment continued to be buoyant throughout the Tenth plan period, so the share of public investment in total investment in the tenth plan fell to 22 per cent (Table 7.8). The rapid increase in private sector revealed the reflection of the impact of favourable investment climate formed since 1990s.
TABLE 7.8 Public-Private Investment in the Tenth Plan

Note: GDP mp is GDP at market price.
Source: Planning Commission. (2006) Towards Faster and More Inclusive Growth—Approach to the Eleventh Plan.
Saving: Both components of private saving (household and corporate sectors) have risen as a per cent of GDP in the tenth plan (Table 7.9). Both components of public sector components also showed an improvement in the tenth plan. Reduction in the dis-savings of government administration has been due to three main reasons—first, the impact of the Fifth Pay Commission’s recommendations worked itself out in the system; second, the implementation of the Fiscal Resposibility and Budget Management (FRBM) Act; and third, the buoyancy in tax revenues arising out of the high growth rate recorded in the tenth plan, combined with improvements in tax administration contributed to improved savings.
TABLE 7.9 Composition of Saving

Note: At current price 2005–06: Provisional Esimates; 2006–07: Quick Estimates.
Source: Planning Commission. (2006) Towards Faster and More Inclusive Growth—Approach to the Eleventh Plan.
Foreign Trade: During the tenth plan period, the merchandise exports moved on to a new trajectory with an annual average growth rate of 23.2 per cent and imports by 27.8 per cent. There has been a continuous shift of exports towards technology-intensive, high-value manufactures including machinery and instruments and also gems and jewellery. Services exports increased substantially in the tenth plan contributing to an increase in the net invisibles. This provided a cushion for financing a large part of the trade deficit on the merchandise account. The current account deficit in 2006–07 was US$ 9.6, billion, i.e., 1.1 per cent of GDP.
It can be argued that there is an element of cyclicality in the high growth observed in the tenth plan period, since these were also years of a global upswing. However the indepth dissection of the Indian growth performance during the tenth plan reveals that it was not merely a cyclicality but underpinned by a number of factors which are the real sources of strength.
7.3.12 Approach to Eleventh Five Year Plan (2007–12)
The NDC, the county’s highest policy making body endorsed the eleventh plan document on 19 December 2007. It envisages an average 9 per cent GDP growth in the first four years to end the five-year period with a growth of10 per cent during the terminal year 2011–12.
With an overall investment of Rs 36,000 crore, the Gross Budgetary Support (GBS) has been fixed nearly 115 per cent higher at Rs 10 lakh crores to help the states in ushering in inclusive growth through the development of social infrastructure such as health, education and eradication of poverty by generating more jobs. Further, the plan has specific nationaland state-level targets to help in monitoring the progress of the various social sector programmes. Total of 27 targets have been proposed at the national and 13 at the state level, with regard to poverty eradication, education, health status of women and children, infrastructure and environment. The incidence of poverty is to be reduced by 10 percentage points by generating 7 crore new jobs, while electricity connection is to be ensured to all the villages.
7.3.12.1 The Vision Behind the Plan The basic approach is to restructure policies for achieving a faster, broad-based and inclusive growth. The thrust is to reduce poverty and focus on equitable distribution. The objective of the eleventh plan is to attain a sustainable growth path and to achieve a growth rate of10 per cent by the end of the plan period. The plan also envisages a faster generation of productive employment and a higher rate of agricultural growth of 4 per cent.
The strategy of growth in the eleventh plan is rapid growth. A rapid growth is needed to raise the income of the masses of our population, improve the living conditions and generate the resources for providing basic services to all. Policy changes will also focus on increasing the per-capita income of different sections of the society, especially, the poor sections. The policy approach is to achieve inclusive growth, thereby providing the access to basic facilities such as health, education, clean drinking water, etc. to the masses. While encouraging the private sector growth, the eleventh plan ensures a substantial increase in the allocation of public resources for plan programmes in the critical areas. This will support the growth strategy and ensure ‘inclusiveness’.
7.3.12.2 Growth Target for the Eleventh Plan The task of achieving an average growth rate of 9 per cent in the eleventh plan is feasible at a macro-economic level. In fact, the scenario shows that even 10 per cent growth rate is achievable with a strong fiscal effort that is difficult but not impossible. However, to achieve a more inclusive growth, substantial resources would have to be directed to setting right the neglect of rural infrastructure and providing education and health services to all. While these outlays will eventually lead to a faster growth in the short term, there will be some reduction in the growth rate. It is therefore proposed that the target growth rate for the eleventh plan is placed at 9 per cent per annum.
7.3.12.3 Strategy for the Eleventh Plan The transition towards faster and more inclusive growth calls for significant new initiatives in many sectors. In some, we need to build on the policies working well but need further strengthening in critical areas to build the additional momentum needed. The projected sectoral allocation of the Eleventh Plan is given in Table 7.10.
Agriculture: One of the most important challenges of the eleventh plan will be to reverse the deceleration in the agricultural growth from 3.2 per cent observed between 1980 and 1996–97 to a trend average of around 2 per cent subsequently. This deceleration is the root cause of the problem of rural distress that has surfaced crisis levels in some. Agriculture still provides livelihood to nearly 60 per cent of our population and remains vital for food security. To ensure a better life for women and men engaged in agriculture, it is necessary to double the growth rate achieved in the tenth plan and put agriculture on a growth path of around 4 per cent. To do this and at the same time maintain prices and profitability, a corresponding increase in demand for agricultural output matched with the supply side is required.
TABLE 7.10 Sectoral Allocation—Tenth and Eleventh Plans
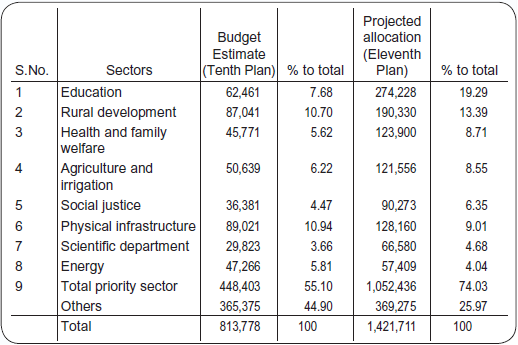
Note: Tenth plan BE represents actual allocation and not the original tenth plan projection (Rs/Cr at 2006–07 prices).
Source: Planning Commission. (2006) Towards Faster and More Inclusive Growth—Approach to the Eleventh Plan.
- Strategy to increase supply. The eleventh plan strategy to raise agricultural output is based on the following elements.
- Double the rate of growth of the irrigated area.
- Improve water management, rain water harvesting and watershed development.
- Reclaim degraded land and focus on soil quality.
- Bridge the knowledge gap through effective extension.
- Diversify into high value outputs such as fruits, vegetables, flowers, herbs and spices, medicinal plants, bio-diesel, etc. but with adequate measures to ensure food security.
- Provide easy access to credit at affordable rates.
- Improve the incentive structure and functioning of markets.
- Refocus on land reforms issues.
- Increasing demand for agricultural output. In recent years, farmers have been hesitant in expanding production because:
- Per-capita domestic food consumption has stagnated in recent years.
- The world prices turned weak for many crops. Consequently agricultural product prices received have failed to keep pace with the overall inflation and production cost, thus reducing farm profitability. Various models suggest that even with 8–9 per cent GDP growth, 4 per cent growth in agriculture will not be sustainable from the demand side unless agricultural exports pick up or consumption by the poor grows beyond what is likely as a result of GDP growth alone. A group of policies such as the strengthening of National Rural Employment Guarantee Programme and Intensification of Minimum Support Price (MSP) policy are included in the eleventh plan to attain this objective.
Industrial Growth: There is considerable evidence that the industrial sector has gained strength in many ways over the past 15 years as a consequence of liberalizing industrial controls and the gradual integration with the world economy. Automobile components, pharmaceuticals, special chemicals and textiles have shown a marked increase in global competitiveness. The surge in industrial production in 2005–06 and 2006–07 provides further evidence in support of this assessment. However, there are numerous constraints that limit industrial performance, particularly of the labour-intensive manufactures, and these need to be addressed urgently. Indian manufacturing is highly dualistic, with the organized sector producing 67 per cent of the manufacturing value added but employing only 12 per cent of all workers in manufacturing. Unfortunately, although employment in the unorganized manufacturing sector has expanded, it has not increased in organized manufacturing after mid the 1990s. A clear priority of the eleventh plan is to encourage the organized sectors to employ more labour and, simultaneously, to improve labour productivity in the unorganized sector.
The eleventh plan should aim at raising the rate of growth of industrial sector to 10 per cent and manufacturing growth to 12 per cent per annum. The most critical shortterm barriers to growth of the manufacturing sector are—absence of the world class infrastructure and skill formation. The National Manufacturing Competitive Council has proposed a strategy for manufacturing in the eleventh plan. The major ones are the following.
- Taxes and duties should be made non-distortionary and internationally competitive. Reduce the simple average of non-agricultural tariffs from the 2006 level of 13 per cent to about half that level by the end of the eleventh plan.
- Special boosting policies for the Special Economic Zones (SEZ) and Special Economic Region (SER).
- Special attention to technological modernization and research and development.
- Expansion of investor friendly climate especially related to the state governments.
- Labour-intensive mass manufacturing based on relatively lower skill levels provides an opportunity to expand employment in the industrial sector. China has done exceptionally well in this area. A major hurdle for India is some of the traditional labour laws. Therefore a very fundamental restructuring of certain labour laws is proposed in the eleventh plan.
- The policy of progressive deservation of industries for small scale production has reduced the list of reserved industries from about 800 to 326. The policy should be accelerated in the eleventh plan.
- Elimination of the residual entry barriers remains in certain industries.
Services Sector: The services sector accounts for 54 per cent of GDP and is currently the fastest growing sector of the economy, growing at 9 per cent per annum since the mid-1990s. The sector has a unique opportunity to grow due to its labour cost advantage reflecting in the world, coupled with a rising share of the working age population. The eleventh plan, therefore, puts special focus on this sector so that its potential to create employment and growth is fully realized. Professional services include a wide array, namely, the IT service, customer relations, management, health services, accountancy services, legal services, educational services, etc. The information and communication technology revolution has made it easy to provide such services all over the world. The Indian professionals have made a mark in many fields leading to India being recognized all over the world as an important player in the knowledge economy.
India has shown a competitive strength in the offshore IT services with a 65 per cent share of the global offshore market and a 46 per cent share of the global business process off-shoring (BPO) industry. This was made possible by an unparalleled export performance with an average growth rate of 28 per cent over a decade. Fortunately, the scope of future expansion continues to be large as only 10 per cent of the potentially addressable global IT market has been realized. The remaining 90 per cent of the global potential market of approximately $300 billion still remains to be realized. The eleventh plan has given enough emphasis to fetch the fruits of the knowledge economy.
Poverty and Unemployment: On the basis of the NSS large sample survey conducted in 2004–05 and using the methodology of the Expert Group Estimation of proportion and the number of poor in 1993, the percentage of population below the poverty line in 2004–05 is provisionally estimated at 27.8 per cent in 2004–05. Thus the average decline in the percentage of population below the poverty line over the period 1993–2004 is 0.74 percentage points per year, much less than implied by the official 1999–2000 data. Using comparable data, it is found that the reduction in poverty is only about 0.8 percentage points per year, which is at best a modest rate of decline. One reason for this is the slow growth rate in agriculture.
Employment is an area which shows up where our growth process is failing on inclusiveness. The employment growth accelerated to 2.65 per cent during 1999–2005 outpacing the population growth. But the average daily status unemployment increased from 6.1 per cent in 1993–94 to 7.3 per cent in 1999–2000, increased further to 8.3 per cent in 2004–05. This was because the working age population grew faster than the total population and labour force participation rates increased, particularly among women.
Agricultural employment has increased at less than 1 per cent per annum slower than the population growth and much slower than growth in the non-agricultural employment. This is the expected trend in a long-term development, but a matter of concern is that this has also been associated with a sharp increase in unemployment (from 9.5% in 1993–94 to 15.3% in 2004–05) among agricultural labour which represents the poorest group. Therefore the eleventh plan has taken these sectors as strategic areas which need special attention to uphold the ‘inclusive’ banner of the plan.
Education: Prime Minister Dr Manmohan Singh has labelled the eleventh plan as an ‘Education Plan’ by appraising the thrust given to this sector in this plan. The eleventh plan ensures a move towards raising the public spending in education to 6 per cent of the GDP. It must fulfil the constitutional obligations of providing free and compulsory elementary education of good quality to all children up to the age of 14. Special programmes are designed in the eleventh plan to ensure both access and good quality and standards in respect to the curriculum, pedagogy and infrastructure. This plan aims to progressively raise the minimum level of education to high school or class 10 level.
Monitorable Social-Economic Targets of the Eleventh Plan
Income and Poverty
- Accelerate growth rate of GDP from 8 to 10 per cent and then maintain it at 10 per cent in the twelfth plan, in order to double the per-capita income by 2016–17.
- Increase agricultural GDP growth rate to 4 per cent per year to ensure a broader spread of benefits.
- Create 70 million new work opportunities.
- Reduce the educated unemployment to below 5 per cent.
- Raise real wage rate of unskilled workers by 20 per cent.
- Reduce the head count ratio of consumption of poverty by 10 percentage points.
Education
- Reduce dropout rates of children from elementary school from 52.2 per cent in 2003–04 to 20 per cent by 2011–12.
- Develop minimum standards of educational attainment in elementary school and, by regular testing, monitor effectiveness of education to ensure quality.
- Increase literacy rate for persons of age seven years or more to 85 per cent.
- Lower gender gap in literacy to 10 percentage points.
- Increase the percentage of going to higher education from the present 10 per cent to 15 per cent by the end of the eleventh plan.
Health
- Reduce IMR to 28 and the MMR to 1 per 1000 live births.
- Reduce total fertility rate to 2.1.
- Provide clean drinking water for all by 2009 and ensure that there are no slipbacks by the end of the eleventh plan.
- Reduce malnutrition among children of age group 0–3 to half its present level.
- Reduce anaemia among women and girls by 50 per cent by the end of the eleventh plan.
Women and Children
- Raise the sex ratio for the age group 0–6 to 935 by 2011–12 and to 950 by 2006–17.
- Ensure that at least 33 per cent of the direct and indirect beneficiaries of all government schemes are women and girl children.
- Ensure that all children enjoy a safe childhood, without any compulsion to work.
Infrastructure
- Ensure electricity connection to all the villages and BPL households by 2009 and round-the-clock power by the end of the plan.
- Ensure all-weather road connection to all the habitations with population 1000 and above (500 in hilly and tribal areas) by 2009, and ensure coverage of all significant habitations by 2015.
- Provide broadband connectivity to all the villages by 2012.
- Provide homestead sites to all by 2012 and set up the pace of house construction for the rural poor to cover all the poor by 2016–17.
Environment
- Increase forest and tree cover by five percentage points.
- Attain the WHO standards of air quality in all major cities by 2011–12.
- Treat all urban waste water by 2011–12 to clean river waters.
- Increase energy efficiency by 20 percentage points by 2016–17.
7.3.12.4 Monitorable Social-Economic Targets of the Eleventh Plan To sum up, the strategy for faster and more inclusive growth outlined in the eleventh plan presents formidable challenges and requires determined action by both the centre and the states. Achieving these targets will not be an easy task, but it is definitely feasible. The knowledge that the economy is in many ways better placed today than it has ever been should help to achieve such ambitious targets.
The chairman of the Planning Commission Dr Manmohan Singh remarked at the National Development Council meeting, convened to approve the Eleventh Plan Draft— ‘There are some clouds on global financial markets following the sub-prime lending crisis. There are worries that the growth of the US and other leading economies may slow down and some may even go into recession’. This could impact the country’s exports as well as capital flows, as India’s external sector now accounted for almost 40 per cent of the GDP. Hence ‘we cannot be fully immune to international developments’. Therefore, one of the key determinants of the success of the eleventh plan will be the country’s ability to insulate from global shocks.
7.3.12.5 Mid-Term Appraisal: Eleventh Plan The growth of the world economy affects our economy directly through exports and also through the impact of the global growth prospects on the FDI. It is therefore relevant to evaluate the medium-term prospects in this regard. Although unsettled financial conditions prevailing at the end of 2007, combined with the persistence of global imbalances, have raised the prospect of a slowdown in some of the major economies over the next 12 months, this is likely to be a temporary and not a medium-term phenomenon. The Indian exports have shown a considerable resilience and have also diversified considerably so that the impact of a temporary slowdown in some of the major industrial economies may not be significant. India’s share in the global trade is still small and an aggressive policy drive for expanding exports may enable us to wither the impact of a temporary slowing down of the global economy. In effect, the constraints on our growth are primarily internal and it is reasonable to assume that the uncertainties affecting the world economy are not such as to have an impact on India’s growth potential over the eleventh plan period.
On account of the slower growth in the earlier period of the eleventh plan, it is now estimated that the average growth in GDP in the next five years will be only 8.1 per cent against the target of 9 per cent (Table 7.11). It has been indicated in the mid-term appraisal that the emphasis will have to be on augmenting the pool of resources and executing mega projects without time lag or overruns.
Much will depend on the progress achieved in 2011–12 and the subsequent years, as the growth in the GDP will have to be above 9 per cent in 2011–12 and in double digits in subsequent years. The Planning Commission and the government have to make success of the projects in the eleventh-plan period, as creation of additional capacity in the industrial sector and a step-up in the production are vital for eliminating bottlenecks.
TABLE 7.11 Growth of Indian Economy (2007–12)—Actual and Projected Figures of Various Sectors

Note: Figures for 2008–09 are quick estimates, for 2010–11 and 2011–12 are forecasts.
Source: ‘Economic Outlook for 2010/11, Report of the Economic Advisory Council to the PM, 2010, New Delhi.
Reference
Lewis, W. A. (1966). Development Planning, Routledge.
Sury, M. M. (Ed.) (2006). Economic Planning in India 1951–52 to 2006–07. New Delhi: Indian Tax Foundation.
Government of India (various years from 1991–92 to 2006–07) Economic Survey; New Delhi: Controller of Publications.
Bhagwati, J. N., and Desai, P. (1970). Planning for Industrialization, Bombay: Oxford University Press.
Dantwala, M. L. (1986). Strategy of agricultural development since independence. In M. L. Dantwala. et al. (Eds.), Indian agricultural development since independence, New Delhi: Oxford and IBH Publising Co.
Government of India (2007). Reference annual. New Delhi: Publication Division, Ministry of Information and Broadcasting.
Planning Commission (2005). Mid Term Appraisal of the Tenth Plan, New Delhi: Planning Commission.
Planning Commission (2006). Towards Faster and more inclusive growth-approach to Eleventh Plan, New Delhi: Planning Commission.
Planning Commission (2008). Eleventh Five Year plan 2007–12. Vol. I—III, New Delhi: Oxford University Press.
Richard, S. E. (1969). Planning in India. In M. F. Milikan (Ed.), National Economic Planning (1969), New York: National Bureau of Economic Research.