4
Demographic Changes in India
S. Irudaya Rajan and Sabu Aliyar
4.1 Introduction
With more than a billion citizens, India is the second most populous nation in the world after China, with an annual growth rate of 2 per cent. Each year, India adds more people to the world’s population than any other country. About three-quarters of India’s population are of Indo-Aryan origin. Smaller percentages are of the Dravidian or the Mongol descent. The Indian population is predominantly Hindu (81.4 per cent), and Muslims (12.4 per cent), Christians (2.3 per cent), Sikhs (1.9 per cent), Buddhists (0.8 per cent) and Jains (0.4 per cent) represent the minority religions. The fertility rate is declining—by half at present since the mid-1960s—but the population momentum of women in the reproductive ages suggests a high number of births for a few more decades. In 1952, India became the first country in the world to launch an official family planning programme aimed at reducing the population growth.
Although industry and commerce constitute the basis of the Indian economy, agriculture employs the majority of labour force. About 70 per cent of the labour force is engaged in agriculture and cultivation. Continued economic growth, fiscal deficit reduction, agricultural and financial sector reform and robust foreign direct investment are the government’s top economic priorities. Economic development is proceeding far more rapidly in India’s northern industrial centres. Southern coastal areas are generally poorer and rely more on subsistence agriculture.
4.2 Population Size and Growth
The latest census has shown that the population of India was enumerated as 1.03 billion as on 1 March 2001. Over the last 100 years, the population has increased about five times and since Independence the numbers have increased by three times. During the early part of the 20th century, India experienced a negative population growth rate; during 1911–21 and thereafter it experienced a continuous increase in the growth rate for several decades to reach a maximum of 2.22 per cent during 1981–91. It then witnessed a declining trend. During 1961–91, India’s population growth rate hovered around 2 per cent but in the first decade of the 21st century, it registered a growth rate of below 2 per cent. The growth rates of India during the last century can be classified in four district phases—stagnant growth (1901–21), steady growth (1921–51), rapid high growth (1951–81) and high growth with a sign of decline (1981–2001) (Table 4.1).
TABLE 4.1 Demographic Indicators for India, 1901–2001

Source: Various Census Reports.
*Sex ratio is the number of females per thousand males.
When Census 2001 was conducted, India was administratively divided into 35 states and union territories. Among the 28 states, Uttar Pradesh accounted for 16 per cent of the total population, followed by Maharashtra (9 per cent), Bihar and West Bengal (8 per cent each) and Andhra Pradesh (7 per cent). In other words, about 50 per cent of India’s one billion lives in just the five major states. Among the seven union territories, Delhi enumerated the highest number of persons (about 14 million) and the lowest number was found in Lakshadweep with just 60,595 in 2001. During 1991–2001, most of the states and union territories maintained the same rank in the population size. Uttar Pradesh was the most populous state with 166 million in 2001.
Though India has experienced a decline in the growth rate in the last two decades, some states and union territories have reported that their growth rate during 1991–2001 was higher than the previous decade. They are—Bihar, Sikkim, Nagaland, Manipur, Gujarat, Daman and Diu and Dadra and Nagar Haveli. Another interesting observation noted from the growth rates is that about half the states and union territories have registered the growth rates far lower than India’s growth rates. The lowest population growth rate in the country was reported in Kerala (0.9 per cent) followed by the neighbouring state of Tamil Nadu (1.1 per cent). Detailed analysis indicates that South India (Kerala, Tamil Nadu, Karnataka and Andhra Pradesh) is ahead of other parts of the country in curbing the population growth rates (Table 4.2).
TABLE 4.2 Demographic and Social Profile of States and Union Territories in India, 2001

4.3 Sex Ratio
Sex ratio is the number of females per 1000 males. It is a powerful social indicator of the equity between males and females in the economic and social spheres of a society at a given point of time. It is affected by the sex differentials in mortality, migration and sex ratio at birth and, at times, sex differentials in under-enumeration. Most of the developed countries in the world report excess females in their population. The sex ratio of the United States is 1029 females per 1000 males, whereas the ratio for Japan is 1041 females. However, South Asian countries including China always enumerate excess males in their population and this trend is being strengthened from decade to decade. The sex ratios of India and China are 933 and 944, respectively, in the latest census indicating excess males to the tune of 67 per 1000 females. This is also true for neighbouring countries such as Pakistan (938) and Bangladesh (953).
The sex ratio for India stood as 972 in 1901, declined to 946 at the time of Independence and declined further to 933 in 2001. Though fluctuations were reported during the several decades, it is clear that India follows the South Asian pattern of excess males in the population. Recent evidence indicates excess female mortality coupled with sex-selective abortions and female infanticide and neglect among sections of the Indian population. Among the 35 states and union territories in India, only Kerala has reported a sex ratio favourable to females (1058). However, at the beginning of the 20th century, several major states (Bihar, Tamil Nadu, Odisha, Jharkhand and Kerala) have reported a sex ratio favourable to females. Over the last 100 years, the status of women in India has been deteriorating to such a level that only Kerala could maintain a higher status of women as reflected in the excess females. Recent studies also ponder over the fact that large-scale male emigration to the Middle East may have contributed to the excess females in Kerala, and that, in reality, Kerala also presents a situation similar to the other parts of the country.
The lowest sex ratio (below 900) is reported for the following states and union territories— Jammu and Kashmir (900), Punjab (874), Chandigarh (773), Haryana (861), Delhi (821), Uttar Pradesh (898), Sikkim (875), Daman and Diu (709), Dadra and Nagar Haveli (811) and Andaman and Nicobar Islands (846). Why do so many states and union territories in India report high unfavourable sex ratios for females? Internal migration of males is a possible reason in the case smaller entities like Dadra and Nagar Haveli and Andaman and Nicobar Islands. Most of the major states report excess female mortality and sex-selective abortions and the female infanticide.
We have two indicators (sex ratio at birth and sex ratio among children aged 0–6 years) available to assess the growing imbalance among the children. The normal sex ratio among children below six years is about 960 females per 1000 males because the sex ratio at birth is always favourable to males. Several areas in North India such as Punjab, Haryana, Chandigarh, Himachal Pradesh, Delhi, Rajasthan and Jammu and Kashmir report unfavourable sex ratios for females, which indicate a strong prevalence of sex-selective abortions. If we compare the data available during 1991–2001, the prevalence of sex-selective abortion is spreading beyond North India to the west Indian states such as Goa and Gujarat.
Though the sex ratio in India has shown an improvement from 927 to 933 between 1991 and 2001, the child sex ratio has deteriorated during the same period (945 in 1991 to 927 in 2001). The deterioration is widespread in all parts of the country barring a handful of states and union territories such as Sikkim, Mizoram, Tripura, Lakshadweep and Kerala. In 2001, Punjab depicts a state where sex-selective abortion is highly prevalent by reporting a sex ratio of 793 females per 1000 males. Detailed analysis at the district level by the Registrar General of India indicates that the worst 10 districts (out of 593 districts) in India are found in Punjab and Haryana. Seven of the worst 10 districts are in Punjab.
The existence of sex-selective abortions in many parts of India is supported by the recent data provided by the Registrar General for the period 2000–2002. The normal sex ratio at birth is about 940 females per 1000 males. However, most of the major states including Kerala report a sex ratio that is unfavourable to females. While the sex ratio at birth for Punjab is about 775 (the lowest in India), the sex ratio in Kerala is 911.
4.4 Population Density
Population density is the number of persons living in one square kilometre. It was just 77 in 1901, increased to 117 in 1951 and then 324 in 2001 for the country as a whole. The highest number of persons per square kilometre was reported by Delhi (9294), followed by Chandigarh (7903) and Pondicherry (2029). Among the major states, the highest population density was reported in West Bengal (904), followed by Bihar (880) and Kerala (819). Concentration and settlement patterns play a major role in the distribution of health and school facilities.
4.5 Average Household Size
Average household size is the number of persons per household. The average household size for India is around 5.3. However, a few states report their family size above six persons. They are—Bihar, Jammu and Kashmir, Lakshadweep, Nagaland, Rajasthan and Uttar Pradesh. The lowest average household size is reported for Tamil Nadu with 4.3 persons whereas the highest size of 6.5 persons was reported for Jammu and Kashmir. The difference between the highest and the lowest is 2.2 persons.
4.6 Urbanization
Census 2001 defined an urban area as: (1) all places with a municipality, corporation, cantonment board or notified town area and (2) all other places which satisfied the following criteria: (i) minimum population of 5,000, (ii) at least 75 per cent of the male working population engaged in non-agricultural pursuits and (iii) density of population of at least 400 per sq km. According to this criterion, close to 28 per cent of the Indian population lived in the urban areas in 2001 as against 15 per cent in 1961. Delhi has registered the highest percentage of urban population (93 per cent), followed by Chandigarh (89.8 per cent) and Pondicherry (66.6 per cent). However, among the major states, Tamil Nadu leads with the highest percentage of urban population (44 per cent), followed by Maharashtra (42.4 per cent). The lowest level of urbanization is reported for Himachal Pradesh with less than 10 per cent.
4.7 Literacy and Employment
Literacy is an important social indicator of development and is one of the components in the calculation of human development. The difference between genders is indicative of gender equality in knowledge. As education is a pre-requisite for most employment, it is also considered as one of the ways to move up the social ladder. At the beginning of the 20th century, the crude literacy rate for India was just 5 per cent—10 per cent among men and 0.6 per cent among women. The gender gap was nine points. At the time of Independence, both male and female literacy rates showed a considerable improvement, but the progress was faster among men with a gender gap of 17 points. In 2001, the gender gap remains constant at 18 points even after 50 years of educational planning. The current literacy rates for females and males are 64 per cent and 46 per cent, respectively.
Kerala is at the top with the highest literacy rates for both males and females, above 90 per cent. As female education is one of the major determinants of the fertility decline, the higher the literacy rate the lower is the fertility rate. Twenty-two states and union territories report their literacy above the all-India average. However, demographically backward states report their literacy rate below the national average—Bihar, Madhya Pradesh, Rajasthan, Uttar Pradesh, Jharkhand, Odisha and Chhattisgarh.
As gender differentials exist in terms of education, this is also reflected in the case of employment. As of Census 2001, female work participation rate in India is just 26 per cent as against 52 per cent for males. The gender difference in employment is higher (26 points) than the difference in education (18 points). Most researchers feel that the female employment in India is under-enumerated. Though Kerala reported the highest female literacy rate in India (about 88 per cent), the work participation among females is less than 20 per cent. Mizoram reports the highest work participation rate (52.7 per cent) and the lowest is reported in Lakshadweep (25.3 per cent).
4.8 Mortality and Life Expectancy
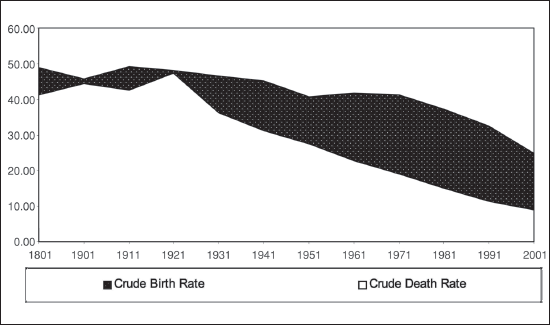
Success in combating morbidity and mortality is one of the important achievements of humanity. Mortality has steadily declined in India over the past three to four decades. Life expectancy at birth has improved substantially from the beginning of the century (Table 4.3). Life expectancy has risen dramatically throughout the 20th century from a scant 20 years at the beginning of the 20 th century. Until 1921, high mortality was due to recurring large-scale famines and epidemics of cholera, small pox, plague, malaria and other chronic diseases. The high rate in the decade 1911–21 could be attributed to the influenza epidemic of 1918, which took a heavy toll on the population. The gradual reduction in death rates since the 1920s is a reflection of the improvement of conditions. The average Indian male born in India can expect to live 63 years whereas females live 65 years according to the estimates in 2001. Although men enjoyed a slightly longer life expectancy in the first part of the 20th century, women took over at the end of the last century. The death rates since 1970 obtained from the Sample Registration System (SRS) are given in Table 4.4. The death rate declined from 48.6 per 1,000 in the 1910–20 period to 15 per 1,000 in the 1970s and improved thereafter, reaching 10 per 1,000 by 1990, a rate that held steady through the mid-1990s (see Figure 4.2).
TABLE 4.3 Vital Rates and Life Expectancy for India, 1881–2001

Source: Census Reports: 1881–60 and SRS.
Figure 4.1: Infant Mortality Rate for India, 1971’99

TABLE 4.4 Trends in Fertility and Mortality in India, 1971–2002

Source: Various SRS Statistical Reports.
The crude death rate for 2002 is 8.1 and is slightly higher for the rural areas of India. The lowest death rate was reported for Chandigarh with 3.4 and the highest was registered for Odisha with 9.8 per 1000. The difference between the highest and the lowest is about six points. The Infant Mortality Rates (IMRs) over the past 30 years from the SRS are presented in Table 4.4. The IMR declined from 129 per 1000 live births in 1971 to 63 per 1000 in 2002. The highest rate was reported for Odisha with 87 and the lowest was in Kerala with 10–77 points’ difference within India. Thirty per cent of the infants had low birth weights, and the death rate for children aged one to four years was around 10 per 1000 of the population.
Figure 4.2: Birth and Death Rate for India, 1881–2001
In most developing countries, maternal mortality has declined rapidly during the past 50 years and maternal deaths have become rare. In contrast, in India, complications of pregnancy and childbirth are the leading causes of death among women of the reproductive age. Maternal mortality has recently received more national attention as evidence of the magnitude and significance of the problem has become available. While there has been a declining trend in the overall mortality levels as well as IMR, the pace has been faster in some states and more in the urban than in the rural areas of all states (Figure 4.1).
4.9 Fertility
The crude birth rate for India was about 25 in 2002, having declined from 37 in 1991 (Table 4.5). This is also true about the Total Fertility Rate (TFR) of three children per woman (Figure 4.3). Goa reported the lowest birth rate with 14 and the highest was reported for Uttar Pradesh with 32—the difference being 18. Similarly, the lowest TFR was reported for Nagaland with 1.5 children per woman to 4.5 in Bihar—the difference being three children.
Kerala was the first state to have reached the TFR of 2.1 in 1988. The TFR of Kerala declined from 4.1 in 1971 to 2.1 in 1988, showing a decline of two children in a period of about 17 years. The decline in fertility continued in the state to reach TFR level 1.7 in 1994, after which fertility seems to have stagnated at the level of 1.8 till 1998. According to the state government, the present TFR level is 1.96, indicating a spurt in fertility over the last few years. While Kerala is doing well in most of the demographic indicators, problems like higher suicide rates, more deaths resulting from road accidents, larger old age population without family support and care because of large-scale migration of the young people, are the new problems facing the state.
TABLE 4.5 Vital Indicators for Indian States and Union Territories, 2002

* Estimated by the author.
Source: Various SRS Statistical Reports.
Figure 4.3: Total Fertility Rate for India, 1971–98

Tamil Nadu seems to have achieved the TFR level 2.1 in 1993. It took 22 years for the state to bring down its TFR level by 1.8 children from 3.9 in 1971 to 2.1 in 1993. It is interesting to note that the TFR level in Tamil Nadu in 1971 was lesser than that of Kerala. The decline in fertility in Tamil Nadu was far slower as compared to Kerala. This may be due to the poorer social and demographic indicators of the state as against Kerala. The fact that Kerala is a more compact state in terms of transport and communication facilities with barely any remote or rural areas may have speeded the process of fertility decline there. However, the income level in Tamil Nadu was higher as compared to Kerala. After reaching the replacement level fertility in 1993, the fertility level in Tamil Nadu has not further declined much as has happened in Kerala.
The TFR rate as per SRS figures hovered between 2.2 and 2 in the period between 1994 and 1999. The TFR may reach the floor level 1.8 by 2010. In Tamil Nadu, there is a considerable scope for bringing down birth rates and improving other demographic indicators like IMR, Maternal Mortality Rate, Couple Protection Rate, institutional deliveries and the marriage age of girls. The state government seems to be going for a new strategy of close monitoring of the implementation of the family planning programme with the involvement of District Collectors. The programmes to increase the accessibility of the services through more outlets, district-specific plans, improved quality and involving the private sector and NGOs should produce better results during the Tenth Plan. The experience of Tamil Nadu points towards the need for actively sustaining population stabilization activities even after reaching the replacement level fertility. Other states and union territories which have already reached the TFR level 2.1 (Goa, Nagaland, Delhi, Pondicherry, Andaman and Nicobar Islands and Chandigarh) may not call for a detailed analysis, as their share in the population of the country is small. No doubt they may have the demographic problems peculiar to each. It may, however, be pointed out that only 11 per cent of the people live in the states and union territories which have achieved the population replacement level of fertility so far.
4.10 Age Structure
The age structure is governed by the degree of variations of the immediate preceding and long past events that occurred in the population. One can also assess the three components of population change—fertility, mortality and migration—through the age structure. India’s population continues to remain young, with about 57 per cent in the age group of 15–59 years.
The median age for the country is 22.74 years while that for the male and female population is 22.36 and 23.13 years, respectively. There is a wide variation in the median age across the country ranging from a low of 18.54 years in Meghalaya to a high of 27.95 years in Kerala. Other states with the median age below 20 years are Bihar, Uttar Pradesh, Arunachal Pradesh and Nagaland. The states of Goa, Tamil Nadu and Pondicherry have the median age above 25 years.
The country has persistently shown a high fertility and a decline in child mortality in the last few decades. More than 35 per cent of the population is less than 15 years of age. In 1971, it was estimated at 42 per cent and has declined seven points over the last 30 years. About 23.2 per cent of the Indian population is now less than 10 years and 10.7 per cent is less than five years of age.
The census data also indicates that there is an unequal growth of population in the various age groups over a period of time. For instance, the absolute number of the working age population (15–49 years) in Census 2001 is more than two times that counted in 1961. It is partly due to the continued high fertility for several years, as well as the effects of population momentum.
On the other hand, the percentage of elderly persons (60+) continues to rise because of declining mortality and consequent increase in the life expectancy. The proportion of the elderly in India was only 6.5 per cent in 1981, which increased to 7.4 per cent in 2001 as shown in Figure 4.4. Kerala leads with the highest percentage of the elderly in the country.
Figure 4.4: India 2001

The number of females in the reproductive ages of 15–49 years stands at 251 million in 2001, 2.5 times higher than the corresponding number in 1961. The number has increased by over 26 per cent during the last decade and is likely to rise in absolute terms in the near future.
The age pyramids of India, Uttar Pradesh and Kerala in 2001 are presented in Figures 4.4, 4.5 and 4.6. It is clearly shown that the shape of the age pyramid for Kerala is different from India and Uttar Pradesh, and the fast demographic transition in Kerala has changed the age pyramid substantially. In other words, Kerala’s population growth rate is about 1 per cent, the children below four years report negative growth and the growth rate of the elderly is above 4 per cent. Uttar Pradesh is one of the most populous states in the country with high fertility and mortality rates, and it is reflected in the shape of age pyramid.
Figure 4.5: Uttar Pradesh 2001

Figure 4.6: Kerala 2001

4.11 Religious Composition
Given the Hindu—Muslim demographic conflict during the last decade or so, the (unadjusted) population growth rate of the six religious communities published in the first report on religion could have been avoided. The difference between ‘adjusted’ and ‘unadjusted’ growth rates is unlikely to be clear to most people, irrespective of the religious affiliation! The difference reported in the ‘unadjusted’ growth rate between the Hindus and Muslims was around 1.6 per cent per annum as against the ‘adjusted’ growth rate difference of 0.9 per cent per annum.
We have estimated the population growth rate of the different religious communities for the last 100 years taking into consideration the missing census data of Jammu and Kashmir (1991) and Assam (1981). Some important observations are made in Table 4.6 and Figure 4.7. At the beginning of the 20th century, the Muslim growth rates were slightly lower than the Hindu growth. Since then, Muslims in India registered not only higher growth rates than Hindus but also to the total population over the last 100 years. During the influenza decade of 1911–21, India’s growth rate was zero and Hindus registered negative growth rate. Muslims registered a minimal growth of just 0.1 per cent per annum. The turning point of both the Hindu and the Muslim population growth rate was at the time of Independence. Muslims registered a negative growth rate of 1.8 per cent per annum resulting from large-scale movement of people from India to Pakistan. On the other hand, Hindus registered the highest growth rate of close to 2.4 per cent. If we assess the growth rates of both the Hindus and the Muslims in the post-independence decades, the Hindu population growth hovered between 2.0 and 2.2 per cent per annum whereas the Muslims growth was between 2.7 and 2.8. In other words, both groups grew more than 2 per cent during 1961–91. Interestingly, in the just-concluded decade, the decline noted in the growth rates of both the communities is almost the same, with 0.2 per cent per annum, though they are at different levels. The real decline in the growth rate among the Hindus started during 1981–91 with just 0. 2 per cent (2.2 in 1971–81 and 2 in 1981–91) and they maintain the same decline during 1991–2001. The Muslims started late in the fertility transition, they lag behind the Hindus, but clear signs of decline are evident.
TABLE 4.6 New Growth Rates of Different Religious Communities in India, 1901–2001

Note: Figures for 1981 include Assam and figures for 1991 include Jammu and Kashmir where census could not be conducted and they are authors’ estimates.
Source: Various Census Reports.
Figure 4.7: Growth Rate of Three Major Religious Communities in India (1901–2001)

4.12 Household Assets
The census collects data on the household assets such as televisions, radio/transistors, telephones, bicycles, scooters/motorcycles/mopeds, car/jeep/van to assess the economic condition at the household level. According to Census 2001, 41 per cent of the rural households in India do not possess any of the assets mentioned above, whereas the percentage for the urban India is just 19 per cent—a 22-point difference between the rural and urban India. In general, a higher proportion of urban households possess all the items listed above compared to the rural counterparts. In the rural areas, only 19 per cent of the households possess a television as against 64 per cent for the urban India. Similarly, only 4 per cent of the rural households are connected with telephones as against 23 per cent for the urban India.