2
Economic Reforms and Performance of Indian Economy
B. A. Prakash
2.1 Introduction
Following the unprecedented economic crisis of 1991, the Government of India announced a package of major economic policy reforms aimed specifically at macro-economic stabilization and restoration of the growth momentum in the economy. A three-pronged approach has been followed to achieve stabilization, restructuring and globalization of the Indian economy. Firstly, the stabilization of the economy implies balancing of the aggregate demand and supply by reducing the mounting budget deficits of the central government. Secondly, it implies restructuring of the Indian economy to make the Indian industry internationally competitive through industrial and foreign trade policies. Thirdly, it implies globalization of the Indian economy through reduction in custom tariffs, allowing free flow of foreign capital, opening up of the service sector to foreign capital, devaluation of the Indian Rupee and partial and full convertibility of the Rupee. Major policy changes have been announced with respect to fiscal, monetary, trade, industry, agriculture, foreign exchange, foreign investment and public sector undertakings since 1991. These policies, such as devaluation, desubsidization, delicencing and deregulation, imply a major shift in the economic policies pursued till 1991. The economic rationale behind the policy reforms is to strengthen the market forces and allow the market to function more freely, which is more appropriate than interfering too much with the market mechanism by regulations and controls.
Though the Congress government introduced reforms in 1991, the subsequent United Front coalition, the Bharatiya Janata Party (BJP)-led coalition and the Congress party-led United Progressive Alliance (UPA) governments pursued the reforms without much change. The Common Minimum Programme (CMP) was the basic policy framework of the Congress-led UPA government that came to power in 2004. Without making any change in the basic principles of the reforms, the CMP laid more emphasis on the welfare of the weaker and poorer sections such as farmers, agricultural labourers and workers in the unorganized sector.
The Indian economy has been able to achieve significant achievements in many fronts due to the reforms. The economy achieved a higher rate of growth, rapid growth of secondary and tertiary sectors, sustained increase in exports and imports and improved Balance of Payments (BoP), increase in the inflow of foreign capital, increase in foreign exchange reserves, rise in the value of the Rupee, less reliance on foreign borrowing and overall development of the economy. More consumer durables and consumer products of better quality at affordable prices were produced in the country, and were made available to the middle and lower middle classes. However, the reforms have not achieved the desired results on some fronts like generation of employment in organized sectors, reduction of unemployment and poverty, rural development, improvement in the condition of the rural and the urban poor, expansion of public services, infrastructural development, housing, etc. More speculative investment in stocks, real estate, gold and other assets created unhealthy and undesirable social effects. The reforms also affected structural changes on many fronts and resulted in the marginalization of the poorer and weaker sections in the urban and rural areas. The effect of the reforms on the agricultural sector, especially on farmers, agricultural labour and those who are solely dependent on agriculture and allied activities, was not encouraging. In many parts of the country, a large number of farmers committed suicide. Some sections, such as workers in the informal sector, landless labour, tribals living in isolated areas, fishermen, urban poor living in slums and female workers, faced marginalization.
In this context, the chapter examines the economic policies pursued in the post-reform period and assesses the economic performance up to 2008, prior to the period of global economic crisis. We present the following hypothesis to explain the economic reform and economic performance. ‘Though the economic reforms implemented since 1991 were able to attain significant achievements in economic growth, sustained improvements in BoP situation, foreign exchange reserves and overall development of the economy, the reforms have not achieved the desired results on many fronts such as reduction of poverty and unemployment, expansion of public services, infrastructural development, rural development, increase in the income and employment of farmers and improving the conditions of the marginalized sections of the society’.
The chapter is presented in five sections. After the introduction, we present the economic policy framework. The economic reforms implemented in India during the prereform period are discussed in the second section. The third section discusses the Structural Adjustment Reforms (SARs) implemented in India. In the fourth and the fifth sections, we examine the performance of the Indian economy and the emerging issues of the economy, respectively.
2.2 Economic Policy Framework and Economic Reforms in India
2.2.1 Economic Policy Framework: Theoretical Issues
The liberalization-type economic reform is based on the neo-classical paradigm of the competitive markets. The theory of competitive markets requires conditions such as small firms or economic agents, none of which have any power to control prices, no externalities and no government intervention. Under these ideal conditions, the value of the output is determined jointly and automatically by the buyers (consumers) and the sellers (producers) of goods, services and the factors of production (land, labour, capital). Higher prices create higher returns to the factors of production, including future workers and investment, which, therefore, move into activities that create the greatest value.
But, in the real world, market failure occurs due to monopoly or oligopoly—externalities, increasing returns to scale, imperfections in some markets, particularly insurance and futures markets, slow adjustments to changes by individuals and enterprises, government taxation, etc. An important problem is that in the developing countries, market institutions are themselves poorly developed and do not function efficiently. Indeed, large segments of population are excluded from the important markets. Further, the policy goals of governments such as self-sufficiency, income distribution and poverty alleviation are not well served by markets.
Neo-classical economics prescribes corrections for some of these market failures. Monopolies can be regulated. Firms can be taxed or subsidized and in some cases regulated, to correct for external costs or benefits. Infant industries can be protected or subsidized until they mature and become competitive. Governments can promote private institutions to improve market performance. Government itself can invest in the infrastructure that supports private activities. For the correction of market failure, the neo-classical economics suggested the following priorities: (1) to improve or enhance the functioning of markets by providing infrastructure and promoting market institutions, (2) prefer market-based mechanisms such as taxes, subsidies and administered prices and over-quantity controls such as import bans or credit allocations and (3) when regulations are necessary, use them sparingly and target them carefully.
However, many developing countries, especially the Third World countries, which pursued active state intervention for development during the second half of the 20th century, intervened too much in the market mechanism. With the objective of correcting market failures, enhancing growth and improvement of income distribution, the governments have imposed controls and frequently distorted foreign exchange rates, interest rates, wages, price of essential commodities and the quantity of imports, credit allocation and many other market variables. Governments have also started public sector units for the production of goods, providing public utilities and other services. Many of the controls and restrictions imposed have distorted the market prices, created incentives for the entrepreneurs for rent seeking and corruption, and acted as obstacles to competition, technological change and the promotion of efficiency of production.
This is the context in which the SARs were put forward as a solution to the problems created by an excessive state intervention in market during 1980s. The reform framework, derived from the neo-classical paradigm, contains five components, viz., freeing markets to determine prices, adjusting controlled prices to scarcity values, shifting resources from the government into private hands, rationalizing the government’s remaining role in the development and reforming institutions to carry out governments new role.
The reforms aimed at changing the structure of production (towards tradable goods) and consumption (towards non-tradable goods) and increasing the efficiency and flexibility of the economy. Stabilization, which means correction of imbalances in foreign payments, government budgets and the money supply, to control inflation or otherwise reducing macro-economic instability, is a pre-condition of SARs. Structural adjustment is often designed to achieve an outward-looking economy envisaging a complex of policies in which export expansion is the engine of economic growth and development. A subset of structural adjustment is liberalization, dealing with the removal of government interventions of all kinds—price controls, quantity restrictions, investment and import licensing and other barriers to entry. Privatization, budget rationalization and institutional reforms are other subsets of SARs.
Though SARs will increase economic efficiency and give better results compared to the excessive state intervention with many other advantages, still they has certain inherent defects. The reforms have not provided answers to the basic question of market failures. The reforms provide an institutional setting for the concentration of wealth and economic power in the hands of a few, which is not socially desirable. A marketization process will take into consideration the interests and requirements of the people who have the purchasing power and exclude those who do not have it. There is also the possibility of an undesirable increase in the prices of the commodities, especially in the case of essential commodities, without having a corresponding increase in the cost of production. The marketization process will marginalize some sectors of the community especially the poor who do not have the resources, skills and abilities to adapt to the rapid changes in the economy. Thus, there will be a conflict between the market-oriented reforms that aim at economic efficiency and attainment of equity, re-distribution and social welfare of the poor and marginalized sections of the society. So, appropriate safety mechanisms or policies should be evolved by the state to face the serious problems that arise due to the conflict.
2.2.2 Economic Policies During the Pre-Reform Period
After the attainment of freedom from the British colonial rule in 1947, India wanted to achieve a socialistic pattern of society. The policy measures taken were to start a highly centralized planning machinery for the economic planning and public investment decisionmaking, expansion of the public investment in the basic and key industries, and to intervene in the market through a number of regulatory measures and controls. The approach was to achieve a rapid economic development through state intervention in the market, public investment and planning. The Indian economy was termed as a mixed economy.
The major characteristics of a mixed economy that India adopted were as follows— first, a framework of private agriculture based on public investment support in key areas such as irrigation, research and extension; second, the adoption of the logic of investment planning aimed at coordinating large-scale investment in the so-called key sectors of the economy; third, assigning of a lead role to investment under the state auspices; fourth, a complex system of regulatory instruments aimed initially at conserving foreign exchange but in the course of time extended to prevent the growth of the so-called monopoly houses; fifth, a deliberate policy of fostering small and medium industries to help diffuse ownership; sixth, the use of state power to regulate the inflow of the private foreign capital. Finally, the adoption of a regime of administered prices in the key sectors to regulate both the instabilities and the presumed inequalities of the market system. From the industrial and trade policies pursued, we will get an idea about the type of policies pursued.
The objectives of the industrial policy as spelt out in the industrial policy resolutions between 1948 and 1980 were as follows—(1) increasing production and productivity, especially in the priority sectors, (2) bringing about regionally balanced industrial development, (3) encouraging small-scale industries to generate employment and foster entrepreneurial talents, (4) preventing the concentration of economic power by the control of monopolies and ‘large’ houses, (5) limiting and controlling foreign investments in the domestic industry, (6) pursuing self-reliance through the import substitution-oriented policies of industrial development and (7) carving out a central role for the public sector in the process of development. A system of industrial licensing and a system of import licensing were introduced. These policies created barriers to entry, provided indiscriminate protection to domestic industry from the foreign competition, created an atmosphere to exist for sick and non-viable units, imposed a system of physical controls given the incentive for rent seeking and acted as an obstacle for technological upgradation.
On the foreign trade front, the choice between import-substitution-oriented strategies and export-promotion-oriented strategies or a suitable combination of the two strategies has been an important element of the policy. In 1950s, the emphasis was on the importsubstitution strategy. During the 1960s, along with export orientation, a heavy import-substitution-oriented strategy was also followed. The imposition of import controls, licensing and restrictions were widely used to restrict imports. A fixed exchange rate regime was also pursued.
From the above, it is clear that excessive intervention in the market to regulate the domestic economy and the external sector has distorted the market prices, interest rates, wages, foreign exchange rates, created incentives for entrepreneurs for rent seeking and corruption, and prevented modernization and technological change. The continuous deficits in BoP were financed through external borrowing resulting in huge foreign debt. The Government of India also resorted to continuous borrowing to cover the deficits in the budgets, which resulted in the rapid increase of public debt and the economy began to experience a serious crisis during the decade 1980s. The crisis became unmanageable and unprecedented by the end of the 1980s.
By 1991, the country was in the midst of an unprecedented BoP crisis. For the first time, India was faced with the prospects of defaulting on its international commitments. Access to the external commercial credit market was completely denied, international credit ratings were downgraded and the international financial community’s confidence in India’s ability to manage its economy was severely eroded. India could only borrow against the security of gold reserves by physically transporting the gold abroad. In May 1991, the government leased 20 tonnes of gold out of its stocks to the State Bank of India to enable it to sell the gold abroad with an option to repurchase it after six months. In addition, the government allowed the Reserve Bank of India (RBI) to ship 47 tonnes of gold to the Bank of England in July 1991 to raise a loan of $600 million. An increase in public spending resulting in continuous increase in the fiscal deficit, deficits in BoP financed by continuous external borrowings, mounting inflation rate, failure of the public sector to generate surpluses, restrictive trade and industrial licensing policies that caused serious loss of efficiency in production and export competitiveness of the Indian products, Gulf crisis in 1990 leading to a fall in remittances and an increase in oil prices, etc. are some of the major causes for the crisis.
2.3 Structural Adjustment Reforms in India
Structural Adjustment Reforms were implemented in India by the Congress government, which came into power in 1991 with Shri P.V. NarasimhaRao as Prime Minister and Dr Manmohan Singh as Finance Minister. The foundation of the economic reforms was laid by this government during 1991 and 1996. Between 1996 and 1999, due to the political instability in the centre, the reforms were not vigorously pursued. However, the BJP-led government under the prime ministership of Shri Atal Bihari Vajpayee pursued the reforms vigorously between 1999 and 2004. A number of new policy reforms were implemented during the period. The subsequent UPA government led by the Congress party under the prime ministership of Dr Manmohan Singh also continued the reforms since 2004, with more focus on agricultural development, rural development, welfare of the weaker sections and removal of poverty. Thus, except for the period between 1996 and 1999, the successive governments at the centre pursued the economic reforms vigorously.
The Congress government, which assumed office in June 1991, implemented a programme of macro-economic stabilization through fiscal correction. To impart inherent competitive strength to the industrial economy, a programme for the structural reforms of trade, industrial and public sector policies was also initiated. The objective was to evolve an industrial and trade policy framework that would promote efficiency, reduce the bias in favour of excessive capital intensity and encourage an employment-oriented pattern of industrialization. The four major policy initiatives taken by the government were fiscal correction, trade policy reforms, industrial policy reforms and public sector reforms. An important element in the fiscal policy was to restore fiscal discipline in the context of the acute BoP crisis and the persistent inflationary situation that prevailed due to large budgetary fiscal deficits. The objective of the trade policy reforms was to create an environment that would provide a stimulus to exports, while at the same time reduce the degree of regulations and license control of foreign trade. The industrial policy announced in July 1991 sought to substantially de-regulate industries so as to promote the growth of a more efficient and competitive industrial economy. The objective of the public sector reforms was to improve the operational efficiency of the public sector units whose performance was very poor and to implement a limited disinvestment of the public sector equity.
Between 1991 and 1996, major policy changes were implemented with respect to the industry, the international trade, external sector, infrastructure, fiscal front, financial sector and the capital market.
In the industrial sector, the major policy changes initiated since 1991 include the removal of entry barriers, reduction of areas reserved exclusively for the public sector, rationalization of the approach towards monopolistic and restrictive practices, liberalization of the foreign investment policy, liberalization of the import policy with respect to intermediate and capital goods, measures to bring about regional balance, especially the development of backward areas, and encouraging the growth of employment-intensive small and tiny sectors. Some of the reforms implemented were reduction of the number of items coming under industrial licensing to 15, the number of industries reserved for the public sector to 6, measures to promote foreign investment and encouragement for private investment in infrastructure like power, roadways, telecommunications, shipping, ports, airports, etc.
The main objective of the export—import policy was to phase out quantitative restrictions in the form of licensing and other discretionary controls. Quantitative restrictions on the imports of most intermediary inputs and capital goods have been eliminated. A large number of items covering 1487 tariff lines whose import is otherwise restricted are allowed to be imported under freely tradable Special Import Licenses.
Major policy changes were implemented with respect to the exchange rate. In March 1993, India moved from the earlier dual exchange rate regime to a single, market-determined exchange rate system. Under this system, there is no officially fixed exchange rate of the Rupee. Instead, the rate is determined by the demand and supply conditions in the foreign exchange market.
In February 1994, the RBI announced the liberalization of exchange control regulations up to a specified limit relating to the exchange earners’ foreign currency accounts, basic travel quota, studies abroad, gift remittances, donations and payment of certain services rendered by the foreign parties.
Major reforms were implemented in the infrastructure such as telecommunications, telecom equipment manufacturing industry, road transport, highway development and shipping. The reforms implemented in telecommunications included value-added services like the cellular mobile phones, radio paging, electronic mail, etc. which were opened up to the private sector. Foreign equity participation was permitted to provide the basic telecom services and the Telecom Regulatory Authority of India (TRAI) was set up. The telecom equipment manufacturing industry was deregulated in 1991 with automatic approval of the foreign equity up to 51 per cent of the total equity. The road sector was declared an industry to facilitate borrowing on easy terms and permit floating of bonds. The government announced a policy to encourage private sector participation, levying user fee and construction on Build Own and Transfer (BoT) basis for highway development. Similarly, a number of policy changes were affected to promote the shipping sector.
On the fiscal front, a number of policy measures were taken to rationalize the direct and indirect taxes. The measures were geared to move towards a tax structure which is simple, relies on the moderate tax rates with a wider base and better enforcement and serves the objective of equity, and provides the incentives and signals consistent with developing an internationally competitive and dynamic economy. In the case of income tax, the initial exemption limit was raised from Rs 22,000 in 1991 to Rs 40,000 in 1995, the number of slabs reduced from four to three and the maximum rate of tax was reduced from 56 to 40 per cent. There has been a substantial reduction in the rate of corporate income tax and tax on the foreign companies. Import duties, which were very high, and in several cases more than 300 per cent prior to reform, were reduced to 50 per cent in 1995.
Major changes were effected in the monetary and banking policies and banks were given the freedom to decide the levels of holding of individual items of inventories and receivables. Similar reforms were implemented in the capital market, the primary market and the secondary market.
The second phase in which the economic reforms were expanded was the period of the BJP rule between 1998 and 2004. The liberalization, privatization and globalization processes were further accelerated during this phase. In the industrial sector, a number of products such as coal, lignite, petroleum, sugar, etc. were delicenced. Measures were made to promote the knowledge-based industry by reducing customs duties on several items of IT and telecom. Foreign Direct Investment (FDI) was permitted to automatic route in all the industries except for a small list. Delicencing of 340 items of import, the removal of all quantitative restrictions on imports of about 3,500 items from the SAARC countries and a free trade agreement between India and Sri Lanka were the major steps taken in 1998. FDI was promoted in e-commerce, the Special Economic Zones, projects involving electricity generation and distribution, etc. Favourable policies were formulated to promote private investment in the power sector. Development of highways through the National Integrated Highway Projects connecting Delhi, Mumbai, Chennai and Kolkata, a new telecom policy allowing multiple fixed service operators, restructuring of airports through long-term leasing route, uniform tax holidays of15 years for all infrastructure projects, etc. were implemented. Major tax reforms implemented were the reduction of import duty on machinery, expansion of the coverage of service tax, rationalization of the customs duties of several products, etc. Major policy changes were also made in the financial sector, capital market, FDI and the money market during this phase. This phase can be considered as a second phase in which reforms in all the sectors were further expanded and implemented vigorously.
The third phase of the reforms began in 2004 when UPA government assumed power under the prime ministership of Manmohan Singh. The CMP was the basic policy framework of the UPA government. There was not much change in the basic principles of the reforms except giving more emphasis for the welfare of the weaker and the poorer sections such as farmers, agricultural labourers and workers in the unorganized sector. The important features of the CMP are the following:
- To attain a growth rate of 7–8 per cent a year in a sustained manner over a decade with more employment generation.
- To enhance the welfare and well being of farmers, farm labour and workers, particularly those in the unorganized sector.
- To fully empower women politically, educationally, economically and legally.
- To provide full equality of opportunity, particularly in education and employment for the Scheduled Castes, Scheduled Tribes, OBCs and the religious minorities.
- To unleash the creative energies of our entrepreneurs, businessmen, scientists, engineers, professionals and other productive forces of the society.
- Enactment of the National Employment Guarantee Act to provide a legal guarantee for at least 100 days of employment.
- To give the highest investment, credit and technological priorities to the continued growth of agriculture, horticulture, aquaculture, floriculture, afforestation, dairying and agro-processing that will significantly add to the creation of new jobs.
- To take steps to revive industrial growth and put it on a robust footing through a range of policies, including deregulation. Where necessary, incentives to boost private investment will be introduced. FDI will continue to be encouraged and actively sought, particularly in the areas of infrastructure, high technology and exports.
- To introduce the economic reforms with a human face that stimulates growth, investment and employment.
- Strengthen the Public Distribution System (PDS).
2.4 Performance of Indian Economy
This section starts with an examination of the performance of the economy up to 2008, prior to the Global Crisis, using the economic indicators such as economic growth, indicators of output, savings, investment and inflation rate. Subsequently, we make an attempt to assess the changes in the external sector, employment, unemployment, poverty and the human resource development.
2.4.1 Economic Growth
Economic growth is an increase in the national income of a country indicating the value of goods and services produced in the economy during a year; it is estimated either at current or constant prices. A review of the growth of the Indian Economy from the First Five Year Plan till the Tenth Five Year Plan showed that the growth rate was low up to the Fourth Five Year Plan (below 4 per cent). Since then, the economy achieved a growth rate of 5 per cent up to 1990 except for the Annual Plan Period (1979–80). Since the inception of planning in 1951, the highest growth rate was achieved during the Tenth Plan period (7.9 per cent). The annual average growth rate of the Indian Economy from the First plan to the Tenth Plan is given in Table 2.1.
TABLE 2.1 Annual Average Growth Rates of Indian Economy (At 1999–2000 Prices)

Source: Economic Survey 2009–10.
TABLE 2.2 Gross Domestic Product at Factor Cost (Rupee in Crore) (Constant Prices)
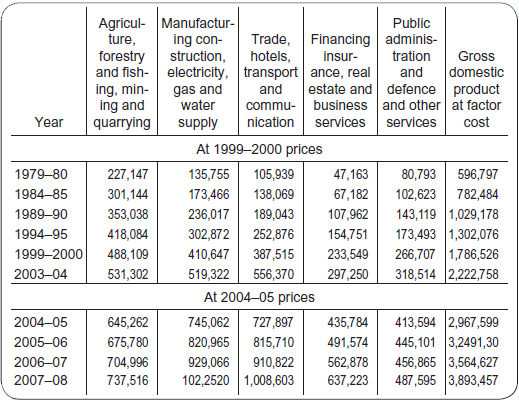
Source: Economic Survey 2009–10.
We may examine the trends of the Gross Domestic Product (GDP) during the 1980s, 1990s and the first decade of the 21st century. The GDP had increased from Rs 596,797 crore in 1979–80 to Rs 1,029,178 crore in 1989–90 and Rs 1,786,526 crore in 1999–2000 at constant prices. Between 2004–05 and 2007–08, GDP increased from Rs 2,967,599 crore to Rs 3,893,457 crore. The trends in the growth of GDP at constant prices are given in Table 2.2.
In order to present the trends in the growth rate of the pre-reform decade (1980s) and post-reform period, we have provided the growth rates in Table 2.3. During 1980s and 1990s the annual average growth was about 5.6 per cent. But the pattern of growth was different in the two decades. In the 1980s, the annual growth rate was below 5 per cent in five years. But during 1990s, except for two years, the rate of growth was more than 5 per cent. This indicates that the economy achieved a more steadier and sustained growth rate during the post-reform period compared to the earlier period. During the first decade of the 21st century the economy achieved a higher growth rate except for the first three years. Between 2005–06 and 2007–08, the economy achieved a record rate of growth—more than 9 per cent (Box 2.1).
A sector-wise growth rate in 1980s, 1990s and the later decade will give us an idea about the changes that have been taking place in different sectors of the economy. Table 2.4 gives a sector-wise growth rate of the Indian economy since 1980–81. Agriculture and the allied sectors provide more than half of the total employment of the country. India is the second largest producer of rice and wheat, first in pulses production and fourth in the coarse grains. The major commercial crops in India are groundnut, mustard, soya bean, other oilseeds, cotton, jute and sugar cane. Indian agriculture suffers from a mismatch between food crops and cash crops, low yields per hectare except for wheat, volatility in production and wide disparities of productivity over regions and crops. India exports agricultural products such as rice, wheat, oilseeds, fruits, vegetables, cashew, tea, coffee, sugar and molasses. Among the factors that determine agricultural production, availability of rainfall is the basic factor. Hence, policies for agriculture development have only a small role in determining agriculture production. Trends in the annual growth rate of agriculture during the 1980s show that the sector registered a negative growth rate in one year (Table 2.4). On the other hand, during 1990s, the sector witnessed a negative rate of growth in the three years. Between 2000–01 and 2007–08, the agricultural growth was fairly good except for the three years. A major factor contributing to a higher growth of the Indian Economy since 2005–06, is the better performance of agriculture. The indicators of production such as index of agricultural production and food grain output also give an idea of the broad changes in the sector. The index of agricultural production shows that the performance of agriculture was better during the decade 1980s compared to 1990s (Table 2.5). The growth in food grains output also shows that the growth was higher in 1980s compared to 1990s (Table 2.6). The index of agricultural production and food grains production also indicates a better performance of agriculture during the first decade of the 21st century, though the country experienced drought in the years 2002 and 2004.
TABLE 2.3 Annual Growth Rates of GDP
P: Provisional estimate.
* At 2004–05 prices.
Source: Economic Survey 2009–10.
Box 2.1 Highest Annual Growth Rates of Indian Economy Since 1951
| Year | Growth rate (%) |
|---|---|
2005–06 |
9.5 |
2006–07 |
9.7 |
2007–08 |
9.2 |
TABLE 2.4 Sector-wise Growth Rate

P: Provisional estimate.
Source: Economic Survey 2009–10.
TABLE 2.5 Selected Economic Indicators

Source: Economic Survey 2004–05, 2006–07 and 2009–10.
TABLE 2.6 Indicators of Output

Source: Economic Survey 2004–05, 2006–07 and 2009–10.
Trends in the growth rate of the secondary sector comprising manufacturing, construction, electricity, gas and water supply show that the sector achieved an annual average growth rate of 5.72 per cent during the 1980s and 5.74 per cent in 1990s (Table 2.4). The sector achieved a steady growth rate during the 1980s compared to 1990s. However, the secondary sector registered a higher growth rate during the first decade of the present century. We have also provided the trends in the growth rate of the industrial production since 1981–82 in Table 2.7.
TABLE 2.7 Annual Growth Rate of Industrial Production (Based on the Index of Industrial Production)
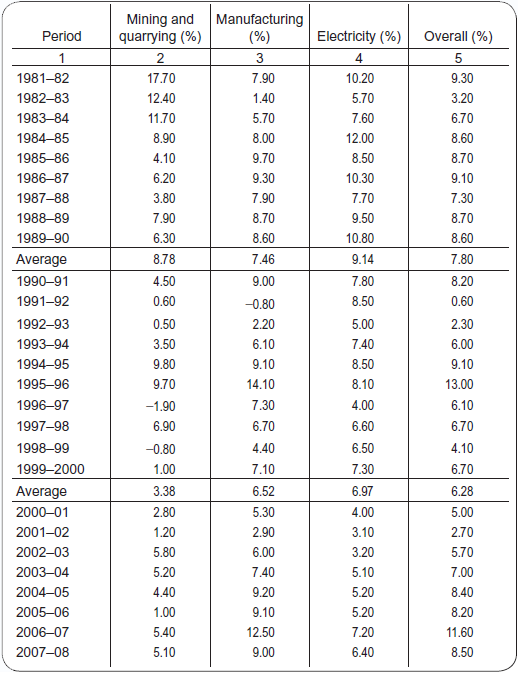
Source: Economic Survey 1997–98, 1998–99, 2004–05, 2006–07 and 2009–10.
The table shows that the rate of industrial production was lower in 1990s as compared to the earlier period. However, the rate of industrial production witnessed a rise since 2002–03. During the post-reform period, the industrial sector underwent rapid structural and technological changes with the introduction of a number of new products. Some of the industries that witnessed rapid changes are automobiles, textiles, gems and jewellery, electronics, steel, basic chemicals, petrochemicals, pharmaceuticals and cement. A disturbing development was the decline in the rate of electricity generation. Compared to the 1980s, there has been a fall in the growth rate in 1990s and first half of the first decade of the present century (Table 2.7). This low rate of growth of electricity generation has already emerged as a basic problem in the infrastructure front.
We may also examine the trends in the growth rate of tertiary sector comprising trade, hotels, transport and communication, financing, insurance, real estate, business services, public administration, defence and other services. This sector witnessed a higher growth rate in the 1990s compared to 1980s (Table 2.4). Trade, hotels, transport and communication are the sub-sectors that registered a higher growth during the decade 1990s. Financing, insurance, real estate and business services also registered a higher growth rate. Between 2005–06 and 2007–08, the sub-sectors, viz., trade, hotels, transport and communications; financing, insurance, real estate and business services registered a record growth of more than 10 per cent. This has also contributed to a higher growth of Indian economy during the period.
Per capita income is also an indicator of growth. The trends in per capita income at constant prices showed that the rate of growth of the per capita income during the decade 1990s was higher than the 1980s. During the first decade of the present century, the per capita income registered a steady increase. The trend in the per capita income at the current and constant prices since 1979–80 is given in Table 2.8. Thus, the overall increase in the per capita income at constant prices suggests that the rate of growth was higher during the post-liberalization period as compared to the 1980s.
TABLE 2.8 Per-capita Income
| Year | Per capita net national product (Rs) (At current prices) | Per capita net national product (Rs) (At 1999–2000 prices) |
|---|---|---|
1979–80 |
1521 |
8185 |
1984–85 |
2772 |
9534 |
1989–90 |
4755 |
11,188 |
1994–95 |
8993 |
12,739 |
1999–2000 |
15,881 |
15,881 |
2003–04 |
20,871 |
18,301 |
2004–05 |
24,095 |
24,095* |
2007–08 |
35,430 |
30,316* |
* At 2004–05 prices.
Source: Economic Survey 2009–10.
2.4.2 Structural Change
Economic growth will result in the structural changes of an economy. The structural change denotes the changes in the composition of sectoral shares of the GDP. The broad changes in the composition of sectoral shares of the Indian economy since 1980–81 are given in Table 2.9. During the 1980s, the major change was a decline in the share of the primary sector on the one hand and an increase in the share of the secondary and the tertiary sectors on the other. During the 1990s, the pattern of change was a bit different from the earlier decade. While there was a rise in the share of the tertiary sector, the share of the secondary sector remained constant. During the first decade of the present century there has been an increase in the share of secondary as well as tertiary sectors. Thus, the broad structural changes witnessed during the last three decades are—continuous fall in the share of primary sector, a steady rise in tertiary sector and a small increase in the secondary sector.
TABLE 2.9 Changes in Sectoral Share of GDP at Constant Prices (1999–2000 Prices)

P: Provisional estimate
* At 2004–05 prices
Source: Economic Survey 2009–10.
2.4.3 Savings and Investment
The basic determinants of the growth of an economy are the rate of savings and investment. The domestic savings in India comprises of the household sector, the private corporate sector and the public sector. Compared to the 1980s, the rate of domestic savings and capital formation were higher during the 1990s and the first decade of the present century (Table 2.10). In the case of domestic savings, the household sector and the private corporate sector registered a rise. The only sector that registered a fall in savings was the public sector. Thus, the achievement of a fairly good rate of growth of the economy during the post-reform period may be attributed to better domestic savings and capital formation.
2.4.4 Inflation
A major impact of the reforms had been the acceleration of inflationary trends in the economy during the first half of 1990s. Due to the protective policies, the prices of most of the commodities were maintained artificially at lower levels through subsidies, controls and other protective measures prior to the implementation of reforms. With the withdrawal of subsidies and controls, prices of most of the commodities registered a steep rise. The wholesale price index that reflects changes in the price of 447 commodities covering all traded goods in primary sector, fuel, power and manufacturing sector, is the indicator of inflation. During the first half of 1990s, the rate of inflation was more than 10 per cent. A major factor that contributed to inflation was the increasing price of the primary articles such as food articles, non-food articles, fuel and power. But during the second half of 1990s, the rate of inflation fell to 5.1 per cent.
TABLE 2.10 Gross Domestic Savings and Gross Domestic Capital Formation (As Per cent of GDP at Current Prices)

Source: Economic Survey 2009–10.
We may also examine the trends in inflation since 2000–01. The inflation that was 7.2 per cent in 2000–01 registered a fall in the subsequent years (Table 2.11). During the years 2003–04 and 2004–05, it registered a marginal increase. Another factor that contributed to the inflation since 2000–01 was increase in the price of petroleum products.
TABLE 2.11 Annual Average Inflation Rate Based on WPI
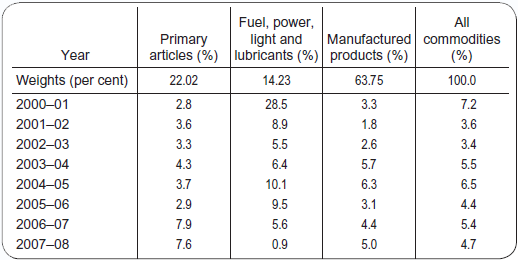
Source: Economic Survey 2009–10.
2.4.5 External Sector
A major achievement of the economic reforms has been the steady and sustained improvement in the BoP position. Table 2.12 gives selected indicators of the external sector. There was a sharp increase in the coverage of imports by exports earnings during 1990s and subsequent decade. This improvement in the export—import ratio combined with the improvement in the invisible account had resulted in a sharp reduction in the current account deficit. The country’s dependence on external assistance and external commercial borrowings came down. The heavy dependence on commercial borrowing to finance the current account deficit has been brought down to manageable limit. The debt—service ratio had also shown a declining trend during the decade. The import cover of foreign exchange reserves also registered a steady increase. These indicators suggest that the Indian economy has moved to a more stable and sustainable BoP position during the post-reform period. The BoP summary given in Table 2.13 also suggests that there has been a continuous improvement in all the major indicators. In recent years India’s BoP has been characterized by surpluses in both current and capital accounts. During the last three years ending 2003–04, India achieved surplus in its current account. The current account surpluses in India’s BoP in recent years are attributable to the expanding invisible surpluses. The current high levels of private transfers, which comprise largely inflows of remittances from Indians working abroad, have made India the highest global recipient of remittances. During 2004, India received an amount of Rs 21.7 billion US Dollars as remittances from overseas Indian workers. The bulk of these remittances come in from expatriates in the US and the Middle East.
There has been a steady increase in the surpluses in the capital account also. Earlier the capital account surplus in India’s BoP used to be partially offset by current account deficits leading to lower overall surplus. The growing strength of the capital account has arisen largely from steady growth in non-debt, creating foreign investment flows. External commercial borrowings and external assistance have been showing net outflows in recent years. Thus, the fast growing invisible and non-debt creating foreign investment inflows are the main factors behind the accumulation of foreign exchange reserves.
TABLE 2.12 Selected Indicators of External Sector

Source: Economic Survey 2004–05, 2006–07 and 2009–10.
TABLE 2.13 Balance of Payments: Summary (US $ Million)

* Portfolio (net).
Source: Economic Survey 2004–05, 2006–07 and 2009–10.
We may also examine the commodity composition of exports and imports. The latest statistics on exports indicates that about 69 per cent of the value of exports is the manufactured goods. The major items are textiles including readymade garments, gems and jewellery, engineering goods, chemical and related products. The agricultural and allied products and ores and minerals account for about 13 per cent of the total value of the exports. The products that registered an increase in exports during the recent years were gems and jewellery, engineering goods, textiles, chemicals and related products. The principal commodities imported were petroleum products, capital goods, electronic goods, gold and silver, chemicals, pearls and precious stones. Petroleum products alone account for one-third of the total value of imports. During the recent years, the imports that registered an increase were petroleum products, capital goods and electronic goods.
A trend in the growth of foreign exchange reserve will give us an idea about the stability the country achieved in the external sector. The foreign exchange reserve comprises of gold, Special Drawing Rights (SDRs) and the foreign currency assets. Table 2.14 gives the trend in the foreign exchange reserves between 1980–81 and 2007–08. From the table, it is clear that the growth in the foreign exchange reserves is mainly due to growth in the foreign currency assets. During the 1990s, except for1995–96, there was a continuous increase in the foreign exchange reserves. The trend also continued during the first decade of the present century. The total foreign exchange reserves of the country increased from $5,834 million in 1990–91 to $309,723 million in 2007–08. In the external sector, the most significant achievement of the country during the post-reform period has been the sustained increase in the foreign exchange reserves.
TABLE 2.14 Foreign Exchange Reserves (US $ Million)

Source: Economic Survey 2004–05, 2006–07 and 2009–10.
Another important development was the appreciation in the value of Indian Rupee during the years 2006 and 2007. There was a fall in the exchange rate of Indian Rupee vis-à-vis other currencies like U.S. Dollar, Pound Sterling, Euro, Singapore Dollar, Japanese Yen, Kuwait Dinar, U.A.E. Dirham, Bahrain Dinar, Qatar Riyal, Saudi Riyal, Oman Riyal, etc. Though the rising value of the Indian Rupee in terms of major foreign currencies like U.S. Dollar, Pound Sterling and Euro indicates an increase in the strength of the Indian currency, it affects exports and imports differently. As imports become cheaper, it will have a favourable impact on importers and there will be a tendency to import more quantities of goods. On the other hand, the exports become more costly and will have unfavourable impact on exporters-export-oriented industries and activities.
2.4.6 Employment
Based on the employment estimates of National Sample Survey Organization (NSSO), we present the growth and structure of employment during the pre- and post-reform period. The Current Daily Status (CDS) definition of employment, based on the gainful employment during seven days, is used to define employment. According to the NSSO surveys, the total employment increased from 239.57 million (person years) in 1983 to 315.84 million in 1993–94 and 336.75 million in 1999–2000 (Table 2.15). Based on the four NSSO surveys, we examine the overall and sector-wise growth in employment between 1983 and 1999–2000. Between 1983 and 1987–88, the annual growth of employment was in the range of 2.73 per cent. The agriculture sector witnessed a growth of 1.64 per cent, secondary sector 5.56 per cent and tertiary sector 3.91 per cent during this period (Table 2.16). The trends in the growth rate continued during 1987–88 to 1993–94. During this period, while agriculture sector registered a higher growth, there was a fall in the growth rate of secondary sector. There was a decline in the growth of employment of mining and quarrying, manufacturing and construction. However the trend in the growth continued without much change in the tertiary sector.
TABLE 2.15 Sectoral Employment (CDS Basis)

Source: Economic Survey 2003–04.
During the post-reform period, especially between 1993–94 and 1999–2000, there was a fall in the growth rate of employment. The annual growth rate of employment declined to 1.1 per cent. The agriculture sector remained stagnant with zero growth of employment during the period. The secondary sector registered a growth of 3.05 per cent. Electricity, gas and water supply registered a negative growth rate. On the other hand, there was an increase in all the sub-sectors of the tertiary sector with the only exception being community, social and personal services. Thus, the trends in the growth of employment during the 1980s and 1990s showed that the rate of growth was lower in the 1990s.
Let us also attempt an examination of the structure of employment since 1983 based on the NSSO estimates of employment (Table 2.17). The broad changes witnessed were the following: (1) There had been a fall in the share of employment in agriculture and allied activities indicating a shift of employment to non-agricultural activities. But agriculture accounted for 52 per cent of the total employment by 2004–05. (2) There had been a marginal increase in the share of secondary sector due to the increase in employment in industries and construction. (3) The sector that achieved a steady increase in employment was the tertiary sector. In tertiary sector, the sub-sectors that registered a substantial increase in the share of employment were trade, hotels and restaurants, transport, storage and communications, financial and business services. Thus, the economic reforms have accelerated a process of structural change indicating a fall in the share of agricultural employment and a rise in secondary and tertiary employment.
TABLE 2.16 Sectoral Employment Growth (CDS Basis)

Source: Based on Table 2.15.
TABLE 2.17 Sectoral Employment Shares by Current Daily Status (CDS Basis)

Source: Economic Survey 2007–08.
2.4.7 Unemployment
Generation of employment and reduction of unemployment are the major concerns of the economic reforms. Let us examine the trends in unemployment rate during the pre- and post-reform period in this context. Based on the NSSO surveys, an attempt is made to present the trends in unemployment rate using the CDS definition of unemployment. The CDS indicates the unemployment status of a person during all the seven days in a week. The rate of unemployment is the ratio of unemployed days per week (seeking or available for work) to the total labour supply per week (working plus seeking plus available days). The trends in unemployment rate between 1983 and 1999–2000 are given in Table 2.18. The table shows that there was a decline in the unemployment rate during the pre-reform period, i.e., 1980s. On the other hand, the rate of unemployment registered an increase since 1993–94. The trends in unemployment during the 1990s were different for urban and rural areas. While there was a marginal increase in the rate of urban unemployment, the growth rate of rural unemployment was much higher.
TABLE 2.18 Unemployment Rate in India (CDS Basis)

Source: Economic Survey 2003–04.
2.4.8 Poverty
Reduction of poverty is one of the basic social objectives of the country. Let us examine the impact of economic reforms on the reduction of poverty. The measure widely used to determine poverty is the poverty line. The poverty line serves as a cut-offline for separating the poor from the non-poor, given the size distribution of population by per capita consumer expenditure classes. Population with per capita consumer expenditure levels below the level defined by the poverty line is counted as poor. The expert group of Planning Commission (1993) had fixed a monthly per capita total expenditure of Rs 89.45 (rural) and Rs 117.64 (urban) for 1983 as the poverty line, which was the official poverty line of India for 1983. At this level of per capita total expenditure, it is expected that a person will get the required per capita daily intake of 2400 calories in rural areas and 2100 calories in urban areas. According to this norm, the people below the poverty line in rural areas were 45.7 per cent and urban areas 40.8 per cent (Table 2.19). There was a continuous decline in poverty during the 1980s and 1990s based on the official poverty line. But a notable development was that poverty declined at a higher rate during the 1990s. This suggested that the reforms have initiated widespread changes in employment and income generation resulting in a larger reduction of poverty in 1990s. However, between 1999–00 and 2004–05, there has been a marginal increase in the rate of poverty.
TABLE 2.19 Estimates of Incidence of Poverty in India

Source: Economic Survey 2003–04 and 2009–10.
But, the poverty line, which is based on the per capita total expenditure, linked to a level of calorie consumption, has a number of limitations and does not capture many important aspects of poverty. It does not capture ill-health, low educational attainments, geographic isolation, ineffective access to law, caste and gender-based disadvantages, low income and dependence of debt, and ignores structural inequalities and other factors that generate, sustain and reproduce poverty. Hence it is likely that the magnitude of poverty in the country will be higher than the one estimated, based on the official poverty line.
2.5 The Emerging Issues of the Economy
This section presents the major emerging issues of the Indian economy during the end of the first decade of the present century. The issues discussed are agriculture, backwardness of rural areas, infrastructure, public services, external sector, unemployment and poverty.
2.5.1 Agriculture
A basic problem in agriculture has been low and declining growth rate in recent years. There has been a deceleration in the growth of agriculture during the last two decades. Another development is the decline in the area under food crops like cereals and pulses and the continuous increase in the area under commercial crops, during the post-reform period. This trend may affect the food grains production in the future. More than 60 per cent of the operational holdings are marginal holdings and the majority of farmers cannot earn a reasonable income from the farming activities. The fall in prices of agricultural commodities, arising due to trade liberalization, more imports and removal of market barriers within the country, had resulted in the fall in prices and income of farmers.
The drought situation, the fall in prices, increase in the cost of cultivation, lack of demand for agriculture products, spread of diseases and inadequate agricultural credit had affected the agricultural activities adversely, and created acute distress and large-scale farmers’ suicides in the country. The total number of farmer suicides in the states of Maharashtra, Andhra Pradesh and Karnataka was estimated as 89,362 between 1997 and 2005. In Kerala, the number of suicides of the farmers was estimated as 841 between 2001 and 2006. The large-scale acquisition of land for big economic projects, Special Economic Zones and starting big industrial and infrastructure units had resulted in forceful acquisition of land from the farmers and denied the farmers their only income yielding asset, land. This had resulted in a widespread discontent among the farmers and in violent protests in different parts of the country. Serious attempts have not been made to address this disturbing and unhealthy development in the agriculture sector. The market-oriented reforms and the consequent structural changes that have been taking place in the rural economy have marginalized the weaker sections like landless agricultural labourers, marginal farmers, tribal people, workers in the informal sector and workers solely dependent on agricultural and allied activities. This indicates the need to formulate appropriate policy measures, institutional changes and public expenditure schemes to protect the interests of the marginalized sections of the society.
2.5.2 Backwardness of Rural Areas
In India, nearly 72 per cent of the population lives in the rural areas and the rural development has been a major objective of economic development since independence. During the post-independence period, a dualistic pattern of development took place in the country. While the rural areas remained backward without much change, the urban areas witnessed rapid development. Large investment in physical and social infrastructure took place in cities, towns, industrial and commercial centres, port towns, etc. This increased the disparities in development in the rural and urban areas. It is expected that the economic reforms implemented since 1991 will help to promote more investment, technological change and increase in production and productivity of the rural economic activities. But the reforms had not succeeded in the promotion of investment and technological changes resulting in the generation of non-agricultural activities in rural areas in a big way. The farmers who committed suicide and worst affected in many parts of India were marginal and small farmers who were solely dependent on the agricultural activities. They did not have any other options outside agriculture. The regions were very backward with little employment opportunities outside agricultural sector. Rural development aiming at generation of non-agricultural economic activities and non-agricultural employment is the need of the hour.
2.5.3 Infrastructure
Development of infrastructure like roads, railways, telecommunications, sewerage and water systems, airports, sea ports and other public utilities is the basic requirement for achieving higher economic growth and improving the quality of life of the people. Inadequate infrastructure in the urban and rural areas is the basic problem faced by the country since independence. Lack of public funds was the basic reason for this. During the post-reform period, notable progress was achieved in sectors like telecom, roads, ports and civil aviation due to the liberalized policies and promotion of private investment in the sectors. In spite of this, infrastructural shortages still remain a basic problem. Currently, the economy is faced with a shortage of electricity throughout the country. Similarly, infrastructure shortages are also there in towns and cities. Rapid growth of population in the urban centres without commensurate growth in the urban infrastructure has created acute problems in many cities and towns. Lack of adequate infrastructure like roads, water supply, irrigation, electricity, telecommunications, etc. is the important problem faced by the rural areas of India. This problem needs urgent attention from the central, state and local self-governments.
2.5.4 Education, Health and Public Services
During the post-reform period, more private investment had taken place in education and health sectors due to pro-liberal policies. Though, better schools, colleges and other educational institutions were set up in the private sector, they cater to the requirement of those who have money or income. This is also true in the case of the modern hospitals and health care institutions started in the private sector. A large section of population that is part of the lower-middle class and poor category cannot afford the services of the private institutions. Due to the general neglect, poor administration and low public spending, there is a steady deterioration in the quality of the education and health services in the public sector. During the post-liberalization period, not much priority was given for developing public services in education and health sectors. As a large section of population cannot afford the educational and health services provided in private sector, strengthening the public institutions are crucial for improving the welfare of people. Policies should focus on the development of the pubic health and educational institutions. Similarly, efforts are also needed to strengthen the public distribution network aiming at distribution of food and other essential articles to the poorer sections of the society. Regulation of the prices of medicines especially used for the treatment of the common diseases is also required.
2.5.5 External Sector
Economic reforms had helped to achieve a sustained improvement in the BoP position and increase in the foreign exchange reserves. An important recent development in the external sector has been the appreciation of value of Indian Rupee vis-à-vis other currencies like US Dollar, Pound Sterling, Euro, Japanese Yen, Chinese Yuan, UAE Dirham, etc. This has created positive as well as negative effects. As a result, imports became cheaper and exports costlier. An increase in the cost of exports due to the rising value of Rupee in 2006 and 2007 had already affected a number of domestic industries, which produce products for exports. It is reported that the export-oriented industries that are badly affected are textiles, gems and jewellery, leather manufacturing, handicrafts and engineering goods. There has been a substantial fall in employment due to this. It has also affected industries such as the IT sector, especially Business Process Outsourcing. Another disturbing development has been the continuous increase in the international price of petroleum products, which is the major product imported to India. The rise in the price of petroleum products will have widespread economic consequences on the entire economy.
2.5.6 Unemployment
Economic reforms did not succeed in the generation of more employment opportunities to absorb the increasing labour force. In spite of the higher growth rate of the GDP the reforms were not able to reduce the rate of unemployment. The recent data on unemployment suggests that the rate of unemployment had increased for the rural and urban areas, during the first half of this decade as compared to the 1990s. A disturbing development has been a continuous increase in rural unemployment. Another negative development has been a fall in employment in the organized public and private sectors during the recent years. Thus, the unemployment problem, which has been the basic socio-economic problem of the country for the last six decades, remains unsolved without much change. The exemption of labour laws given to industries like IT and other newly emerging service sectors during the postliberalization period had adversely affected the wages, working hours, working conditions and non-wage benefits of the workers employed in the private organized sector.
2.5.7 Poverty
Massive poverty was the most important socio-economic problem of the country, at the time of independence in 1947. In spite of the development of the country during the last six decades, poverty still remains the basic socio-economic problem of the country. According to the latest estimates, more than one-fourth of the population lives below the poverty line. Compared to the urban areas, the poverty ratio is high in the rural areas. It is disturbing to note that the incidence of poverty was high in states like Odisha (47 per cent), Bihar (43 per cent) and Madhya Pradesh (37 per cent) in 1999–2000. It is estimated that more than a third of the population was below the poverty line in eight states. Though, a number of poverty alleviation schemes were implemented to solve the problem of poverty, the incidence of poverty is still high. In this context, policies aiming at a more equitable distribution of income and wealth are the need of the hour. The reduction of poverty in rural areas can be solved only through radical distribution of the asset, land.
2.6 Conclusions
The above analysis about the performance of the Indian economy may be concluded with the following observations—compared to the 1980s the economy achieved a steady and sustained growth rate in the 1990s. During the first decade of the present century, the rate of growth has been fairly high since 2002–03. During the post-reform period, the tertiary sector achieved a higher rate of growth compared to the primary and secondary sectors. Though the growth of the industrial sector was moderate, the sector underwent rapid structural and technological changes and enhanced its productive base to produce quality products for the international market. The structural change that occurred during the post-reform period has been a decline of the primary sector and the emergence of the tertiary sector as the dominant sector. Steady increase in the gross domestic savings and the capital formation has accelerated the investment process of the economy. Though the reforms had pushed up inflationary trends in the early years, the economy was able to achieve price stability in the subsequent period. The most significant achievement of the reforms has been the steady and sustained improvement in the BoP position and accumulation of the foreign exchange reserves.
However, the reforms have not achieved the desired results in some fronts like reduction of unemployment and poverty, rural development, improvements in the condition of the rural and urban poor, expansion of public services, infrastructural development, etc. The growth in speculative investments in stocks, real estate, gold and other assets has created unhealthy and undesirable social effects. Some of the policies pursued in agriculture adversely affected the interests of the small and marginal farmers and resulted in the suicides of a large number of farmers in different parts of the country. The reforms have also marginalized the poor sections of the society like landless agricultural labourers, marginal farmers, tribal people, workers in informal sectors and workers solely dependent on agriculture and allied activities. Likewise, the policies have failed to improve pubic education, health services and public utilities and strengthen the network for PDS.
Though the reforms have not achieved the desired results on some fronts and resulted in the marginalization of certain sections of society, the overall achievements are commendable. On the whole, the reforms have laid the foundation for the transformation of an industrially and technologically backward, inward-looking economy to a modern, industrially and technologically advanced, outward-looking economy.
References
Ahulwalia, I. J., and Little I.M.D. (Eds.) (1999), India’s economic reforms and development (Essays in honour of Manmohan Singh). New Delhi: Oxford University Press.
Basu, Kaushik (Ed.) (2004). India’s emerging economy. New Delhi: Oxford University Press.
Brahmananda, P. R., and Panchamukhi V. R. (Eds.) (2001). Development experience in the Indian economy: Inter-state perspectives. Delhi: Bookwell.
Brahmananda, P. R., and Panchamukhi V. R. (1987). The development process of Indian economy. Mumbai: Himalaya Publishing House.
Census of India 2001 (2006). General population tables, Pt. I. New Delhi: Controller of Publications.
Dandekar, V. M. (1994). Indian economy 1947–92, Vols. 1–2. New Delhi: Sage Publications.
Government of India. Economic survey (annual), issues from 1991–92 to 2009–10. New Delhi: Ministry of Finance.
Government of India. (2005). India 2005. New Delhi: Publications Division.
Government of India. (2005). Agricultural statistics at a glance 2005. New Delhi: Ministry of Agriculture.
Jalan, B. (1992). The Indian economy—Problems and prospects. New Delhi: Viking.
Joshi, V. and Little I.M.D. (1999). India: Macro economics and political economy, 1964–1991. New Delhi: Oxford University Press.
Krueger, A. O. (Ed.) (2002). Economic policy reforms and Indian economy. New Delhi: Oxford University Press.
Parikh, K. S. and Radhakrishnan R. (2002). India development report—2004–05. New Delhi: Oxford University Press.
Planning Commission. (1993). Report of the expert group on estimation of proportion and number of poor. New Delhi: Planning Commission.
Planning Commission. (2002). Foreign investment. New Delhi: Planning Commission.
Planning Commission. (2008). Eleventh Five Year Plan 2007–2012, Vols. 1–2. New Delhi: Oxford University Press.
Reserve Bank of India. (2006). Handbook of statistics on the Indian economy 2005–06. Mumbai: RBI.
Reserve Bank of India. (2006). Report of the committee on fuller capital account convertibility. Mumbai: RBI.
Reserve Bank of India. (2006). State finances: A study of budgets of2006–07. Mumbai: RBI.
Reserve Bank of India. Bulletin (various issues 2000–2006). Mumbai: RBI.
Srinivasan, T. N. (Ed.) (2000). Eight lectures on India’s economic reforms. Oxford: Oxford University Press.
World Bank. (2003). India, sustaining reform, reducing poverty. New Delhi: Oxford University Press.
World Bank. (1995). Recent economic development andprospects. Washington DC.