Investors fall prey to myth because they’re used to seeing investing truisms in accepted and normal ways—as they were taught. Once you start thinking even a bit differently—not in a complicated way, just differently, like graphing a bell curve or looking for the same phenomenon overseas—myths tend to fall apart. Whenever you’re confirming an investing belief, try it from a fresh angle. Go crazy. Be creative. Flip things on their heads, backward and inside out. Hack them up and go over their guts. Instead of trying to be intuitive, think counterintuitively—which may turn out to be much more intuitive.
For fun, let’s look at why, intuitively, high P/Es don’t spell disaster for stocks. Most investors look at stocks with high P/Es and assume their prices are too high relative to the companies’ earnings. If a price is proportionately much greater than earnings (so goes the thinking), the stock must be overpriced; what goes up must come down. What investors forget is the P isn’t the only moving variable in the P/E.
In years following high-P/E markets, earnings often rose faster than share prices. And often after low-P/E years, we ran into unexpected rough economies where earnings vanished. In fact, in 1929, the most famous market peak of all time, P/Es were low, not high, because the soon-to-disappear earnings were too high in 1929, making the P/E low.
When we buy stocks, we’re buying future earnings. At some times we’re willing to pay more than at others. In high-P/E markets, earnings often exceed expectations (as in 2003 and 2009), and the market prices in higher earnings before we can see them coming. Just by considering what is happening with the denominator side of the P/E—looking at it differently—you can reason for yourself why the myth is wrong.
The myth that high-P/E markets are dangerous and low-P/E markets are safe persists. But anyone with a dial-up modem and a pencil can see high-P/E years are, in themselves, not any worse than lower-P/E periods. Why does this myth persist? Because fundamentally, TGH is perverse and counterintuitive. It can be painful to accept whatever is fueling your water-cooler debates is wrong or already priced into markets. It’s humbling but true.
How Would Your Grandparents Think About It?
Now I’ll steal a page from Chapter 3 and focus on how our brains blindside us on the P/E issue. There’s a genetic reason people fear high P/E markets. I can’t prove this, but I believe it’s true. And you can’t disprove it. It’s a pretty different way to see this dilemma. You inherited your genes and the information processor that is your brain from your parents, as did they from theirs. Your far-distant ancestors had brains adept at processing certain types of information—that which related to problems they encountered related to passing on their genes successfully. Were that not true, you and I wouldn’t be here. The folks back then who didn’t process information well relative to those problems don’t have descendants walking the earth now.
Your brain wasn’t really set up to deal with the stock market. It was set up to deal with problems of basic human survival. One problem your ancestors learned to process was heights. If they fell from greater heights, the risk of death or crippling (pretty much the same thing back then) was exponential. Higher heights increased risk. Falling from two feet is just a stumble. Falling from 10 feet isn’t all that tough for a 10-year-old jumping off a roof but bone breaking for older people. Falling from 40 feet kills usually and from 400 feet always.
Folks learned well when confronted with problems appearing in a framework of heights—more height meant more risk. Greater heights meant you could fall farther—exactly how people think of P/Es. They envision higher P/Es as farther potential falls and lower P/Es as less distance to smack into the floor, so there is less smacking risk. Any time I present information to you in a form appearing as a heights framework, more height scares you and less height seems safer. If I can present the same information in a way not involving heights, your fear fades instantly. (We do that in a few moments.)
A Quick Preview of Question Three
When the market’s P/E is higher than normal, most investors know it. Even those who don’t know what P/E stands for can tell you “these days” the market is frighteningly overvalued. Their resulting fear of heights and concern over possibly sustaining a loss can be explained by a behavioral finance truism: People hate losses much more than they like gains.7
People talk about investors being risk averse, but that isn’t quite right. Investors are provably loss-averse. Two pioneers in the field of behavioral finance, Daniel Kahneman and the late Amos Tversky, demonstrated and proved normal Americans (yes, you’re probably pretty normal) hate losses about two and a half times as much as they like gains.8 Investors feel the sting of a monetary loss much more intensely than they enjoy the pleasure of a gain. In your heart, you probably already knew that was true for you. And because loss is more agonizingly painful than gain is pleasant, investors will do more to avoid losses than to achieve gains.
Investors will actually adopt additional risk if they believe it can help them avoid a loss they would otherwise incur. Kahneman and Tversky described this phenomenon in what they called “prospect theory.” They discovered normal investors (again, you) confuse actual risk with the perception of risk, all in the effort to avoid the possibility of a loss.9 The perception (or, one could say, misconception) of possible losses long misassociated with high-P/E markets is what keeps investors fearful in what could otherwise be a relatively low-risk market environment. The same powers are at work at the bottom of a bear market. Investors are typically most fearful at the end of bear markets when risk is diminished and upside potential considerable. Investors’ perceptions are just off.
Investors, particularly many who consider themselves “value investors,” have had violent and near-religious reactions to this notion. Instead of practicing introspection and asking themselves Question One—What do I believe that is wrong?—they grab at any straw to disavow they’re influenced by a very natural bias. In rebuttal, they claim the phenomenon occurs because ultra-high P/Es come from suppressed earnings posted at the end of a recession. Not quite. This sometimes happens, but it’s far from universal. It certainly wasn’t true in 1996, 1997, 1998 and 1999. To excuse that, investors say the markets are just irrational. Investors’ vehemence that ultra-high P/Es must have a high risk is another aspect of the perverseness of TGH.
Upside Down and Backward If You Can
We’ve demonstrated how to use Question One with a well-entrenched misconception. As you strike out on your own, testing your own mythology, make sure you’re thorough. A good scientist doesn’t stop once he gets the answer to a question; he looks at it repeatedly from different angles.
First, be realistic about your findings. Don’t jump to conclusions too fast. One might consider the previous data and create a new myth—high P/Es are predictive of above-average returns. Don’t fall for that trick. The evidence here is enough to utterly decimate any wrongheaded belief about high P/Es being bad for stocks. Anything more is inconclusive. It isn’t enough. It isn’t overwhelming. It won’t let you bet and win much more often than you lose. Ultimately, you should take away P/Es aren’t, by themselves, a predictor of future results.
Furthermore, if you get just one result supporting your hypothesis, no matter how remarkable, it’s happenstance, not a pattern. This is true for anything you encounter. You don’t want to make a bet based on happenstance. For example, you might be tempted to conclude ultra-high P/E markets tend to be low risk and high reward. Yes, it is true ultra-high P/Es have led to some great stock returns. But there haven’t been enough occurrences to make this anything more than an interesting observation and probably coincidence. As you create and test, you must test as many occurrences as you find.
We now know P/Es have no predictive power, so is the P/E good for anything? To find out, we need to steal a page again from Chapter 2 and Question Two. What can we fathom about P/Es that is hard for others to fathom? A standard trick to help you see better and see things others don’t is to look at it from a different perspective. One powerful way to test your belief and results is to flip your myth on its head and see what you see then.
So take the P/E and flip it on its head. By putting the earnings over the price in this equation, you have the exact same information in a different framework—the earnings-to-price ratio, better called the earnings yield. This is simply the inverse of the P/E—the E/P.
Investors are used to seeing expected returns of bonds and cash quoted in yields whereas most investors are accustomed to valuing stocks by their P/Es. By inverting the P/E and looking at the earnings yield, you can compare apples to apples. What’s more, you also escape the heights framework just discussed. Table 1.1 shows how to take a P/E and arrive at an earnings yield—a P/E of 20 is really a price of $20 divided by $1 of earnings. So the E/P for this is 1 divided by 20, or 5%. When you think of the relationship as an earnings yield, it compares better to interest rates (as we see later, it should), and the heights framework scaring us about P/E disappears instantly. The P/E of 20 scares you, but the earnings yield of 5% doesn’t. It’s pretty easy math—again, no Stephen Hawking automaton necessary.
Table 1.1 What Is an Earnings Yield?

This comparison is more rational and straightforward than determining if a stock is cheap or expensive based on P/E alone. Since stocks and bonds compete for investor dollars, the comparison of bond yields and stock earnings yields gives you something concrete for comparison. For example, if you have a market with a P/E of 20, most folks would say that seems “high.” How do you think about a 5% earnings yield? If bond interest rates are 8%, the 5% earnings yield might not be attractive, but if bonds are 3%, it could be. Compare that with going bond yields now.
Before you think a stock market (or single stock) with a 5% earnings yield is inferior to, say, a 6% US Treasury bond, remember the tax treatment. The earnings yield is effectively a company’s after-tax annualized cost of raising expansion capital by selling stock. What does that mean?
Since the P/E is an after-tax number, you know the E/P is an after-tax number, too. A company can get expansion capital by selling stock or issuing a corporate bond. But if it issues a corporate bond, the interest paid on that bond is deductible for tax purposes against revenue. The corporate bond rate is a pretax number. The E/P is an after-tax number.
Suppose the stock has a P/E of 20 and it’s an average-grade corporation, meaning a BBB corporate bond rating. As 2011 ended, it could borrow 10-year money through a bond at about 4.6%.10 Assuming a 33% tax rate, the 4.6% cost is really 3.1% after tax. (To get the tax-adjusted equivalent, multiply the 4.6% rate by 1 minus the 33% tax rate—or 0.67.) The stock’s E/P is 5%, already after tax. So it’s cheaper to raise expansion capital by issuing a bond at 3.1% than selling stock at 5%. Corporate bond rates would have to rise above 7.5% to make it cheaper for that P/E 20 company to get expansion capital by selling stock. That is the firm’s viewpoint.
From your viewpoint, it’s somewhat different. The earnings yield needn’t be above the tax-adjusted bond yield to make stocks more attractive than bonds. When you buy stocks, you do so assuming future earnings will be somewhat higher due to subsequent future growth. Stocks as a group tend to generate earnings growth over time, sometimes more, other times less. But a bond coupon is fixed. You know it has no chance of rising. If you hold it to maturity, you will get that interest rate. When you buy stocks, you’re actually buying the future average earnings yield, which is likely somewhat higher than the current earnings yield. When you buy bonds, the future average bond yield is the current yield. For this reason, the current earnings yield needn’t be higher than the bond yield to make stocks attractive relatively.
Interestingly, the earnings yield for the US stock market and the bond yield have historically tracked pretty close to each other—at least since 1985 (see Figure 1.4). Times when the earnings yield has been above the bond yield, it wasn’t by much, but these usually marked good times to own stocks. Why? When the earnings yield is above the bond yield, stocks are typically undervalued relative to bonds. Translation: Stocks are relatively cheap.
Figure 1.4 US 10-Year Bond Yield Versus Earnings Yield
Sources: Global Financial Data, Inc., Thomson Reuters.
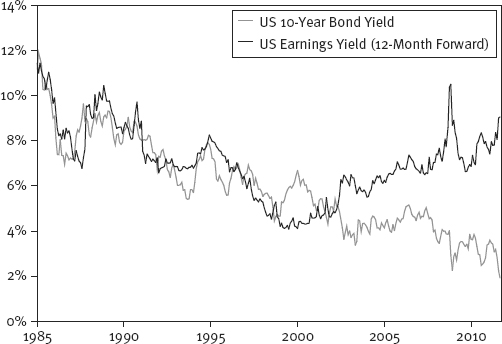
Since 2002, the earnings yield has been higher than bond yields in America, so stocks have been historically very cheap—just when most folks said they weren’t cheap, but high—because P/Es were above historic averages. If you had let high P/Es scare you out of stocks, you would have missed the entirety of the 2002 to 2007 bull market and the powerful initial bull market years of 2009 and 2010.
Keep in mind, this is by no means a forecasting tool. The gap was also wide during the 2008 bear market. But it is one way to assess, rationally, how firms are likelier to raise capital and whether stocks are over- or undervalued relative to bonds. Just because stocks are relatively cheap doesn’t mean they must rise or that they must outperform relative to bonds. Stocks can be cheap and get cheaper still, and the reverse is true for bonds.
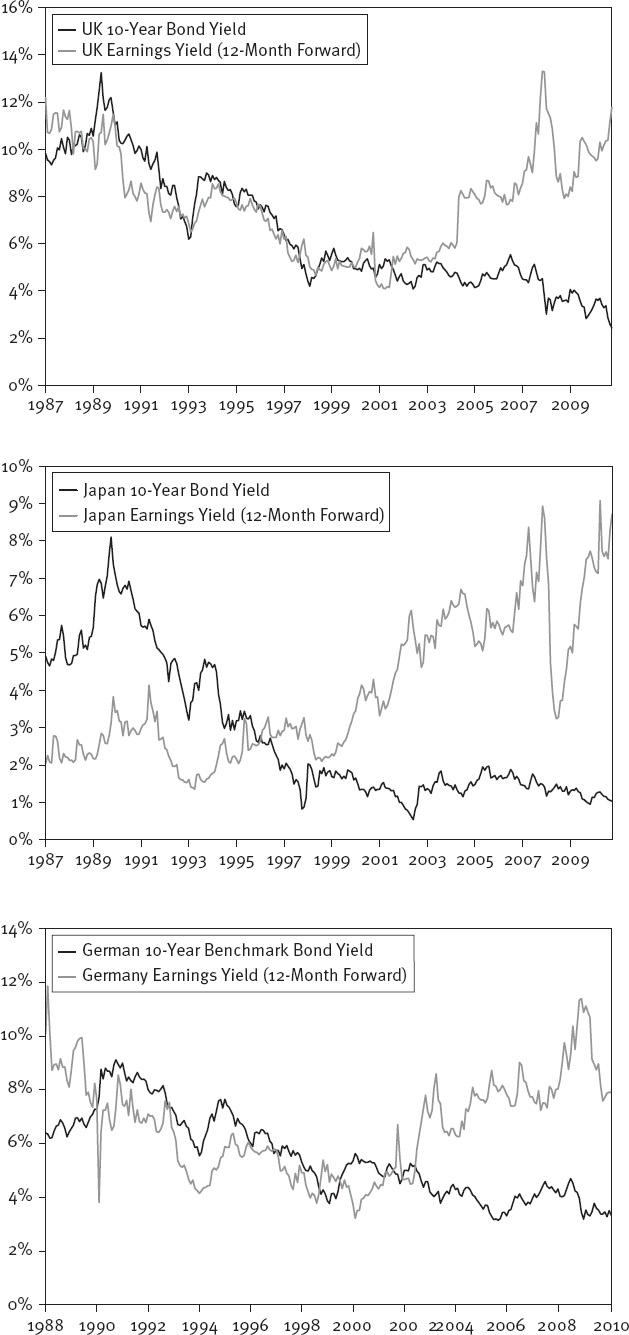
But we aren’t done yet. Remember, if something is true here, it should be true in most foreign developed countries. We can see all around the world earnings yields exceed bond yields now, and by more than in America—and that, too, is uncommon. Stocks are cheaper globally in recent years compared to long-term interest rates than they’ve been in a quarter century (see Figure 1.5).
Figure 1.5 10-Year Bond Yield Versus Earnings Yield
Sources: Global Financial Data, Inc., Thomson Reuters.