Better Living Through Global Benchmarking
Not all capital markets technology is about forecasting. It can also be a tool to keep you disciplined. One such mature capital markets technology alive and well in my firm (to which I’ve already alluded) is global benchmarking. This isn’t new, and I didn’t invent it! We spoke about benchmarking as a cure to many Stone Age ills in Chapter 3.
You may scoff at this idea of picking an index to follow and manage against and measure yourself against as being technology. It’s too simplistic and not a new concept—maybe too widely dispersed already. And anyone can do it! Yes, it is simplistic, and anyone can do it—but mostly, they don’t. And if they do, they usually do it wrong. If they did use it, they would likely have more success and make fewer errors. This is why it’s great. You can measure yourself against your benchmark, but more important, you should manage yourself against it.
Your inclination, like many US investors, may be to shy away from global investing, preferring to focus on the S&P 500 and US stocks and mutual funds. After all, you know America is better and are more comfortable with it. Cincinnati doesn’t scare you but maybe Tampico does. Still, it remains true global thinking helps you think better about everything, including understanding America better. One prime purpose of global benchmarking is to think better.
For example, many wrongly believe they don’t need to think globally or own foreign stocks because they can get the equivalent of global exposure through US firms that have heavy sales exposure overseas—through US multinationals. This widely held view is easily proven false using what you learned in Chapter 1. Now you just have to do it on your own. If US multinationals give you foreign exposure, then they should correlate tightly with foreign stocks, right? If not, you’re not getting the exposure you want. But if you get a bunch of US, Japanese, German and Dutch multinationals, you will find they correlate much closer with their own countries than they do with each other. That is to say, Exxon, Coke and Ford correlate much closer to each other and the S&P 500 than they do with Sony, Toyota, Hitachi and the Morgan Stanley Topix. The correlations teach you that US multinational stocks act like US stocks and don’t give you foreign exposure.
The reason, of course, is each country has cultural effects impacting its stocks beyond where the company generates its revenue. A Japanese firm has primarily Japanese employees, is centered on Japanese laws more than non-Japanese laws and primarily gets more financing from within Japan than outside Japan. But the answer remains in the correlations. This example also teaches you that until you start thinking globally, you can’t really understand that about the US multinationals—which is my basic point. To understand America better today, whether through global yield curves or relations between US stocks and how they perform, you must think globally.
Xenophobes don’t know and have a hard time accepting that the index you pick as your benchmark doesn’t much matter if you have a very long investing horizon. Believe it or not, all correctly calculated major equity benchmarks end up in about the same place if you give them enough time—they just get there via very different paths (as I detail later). But a rational person would select a benchmark getting to that long-term equity return with the least likely volatility—for a smoother ride. Additionally, a rational person would pick the benchmark that provides the most opportunities to make market bets and win and has the most to teach using the Three Questions—and that must be the whole world, leading us back to global.
A benchmark is absolutely vital because it’s your road map for your portfolio. Investing without a benchmark is like getting on an unfamiliar road in an unfamiliar state in an unfamiliar car even, meandering without a map or directions and wondering why you’re getting no closer to your destination. But you aren’t really sure what your destination is except you might recognize it when you see it. The benchmark, as your road map, instructs you on what to include in your portfolio, in what percentage and when.
Your Benchmark Is a Road Map for Your Long Journey
On the morning of September 11, 2001, I happened to be on a train with a group of my East Coast staff on the way from Washington, DC, to Philadelphia to conduct client seminars for local clients. Then the terrorist attacks shattered normality. From Philly, staff dispersed toward homes and families posthaste in all different directions—from New Hampshire to Florida. Unable to fly, two colleagues and I rented a van and drove west to California. We broke the speed limit whenever possible—most of the time. There are two main routes to take. We took the longer southern route through St. Louis for fear if there were more bombings, Chicago and the northern route was a more logical target—hence, we picked the road less traveled. We dropped off one fellow in St. Louis who planned to take a midnight train to his home in Dallas. We drove on in three-hour shifts, and then we stopped at a convenience station for gas, food and to switch for the next three-hour shift. We made it across America, amazingly, in 32 hours. If you really set your mind to it, nonstop, that is how long it takes.
And we never could have done it without a road map. It helped us see the southern route wasn’t much longer and was maybe faster and certainly less traveled. It told us where to go and, when detoured, how to get back on track. It helped us decide which way to drive around Denver. From Denver, whether to take the northern route through Salt Lake City and the Donner Pass or the southern route through the Mojave Desert (this time, we went north). It helped us manage and plan our trip. It let us control our risk. A good stock market benchmark provides the same benefits.
The benchmark also serves as a measuring stick for performance. When you look at your portfolio each year, do you check if you were up or down and by how much? If you do, how do you know if you had a good year or a bad year? If you were up 20%, is that good? Is it still good if you find out the broad market was up 35%? If you were down 5%, is that bad? What if you were down just 5% while the market was down 25%? As you drive from Philly to San Francisco, there are simply stretches where you can beat the speed limit and stretches where you can’t be anything but patient. Markets are like that.
Many investors claim their goal is to beat “the market” but fail to identify which market they mean and how they’ll go about beating it. The market could refer to US equity markets, world equity markets, even bond markets. For a few years, myriad investors wanted to beat the Nasdaq. You cannot rationally aim to beat “the market” unless you choose a specific one to beat. The market you select will be your benchmark and drive every conscious portfolio decision you make.
Once you’ve selected your benchmark, you can then choose to beat it by plowing everything into one narrow stock subcategory, but the risk if you’re wrong is huge. The benchmark helps you define your risk profile—how concentrated or diverse you are compared to the road map you’re managing against.
Broad equity indexes like the S&P 500, the MSCI World and the MSCI ACWI make good proxies for market performance and, hence, a benchmark against which to manage and measure results. But your benchmark can be any well-constructed index—the Russell 2000 if you like small caps. Most British investors use the FTSE and Germans the DAX. Or the Nasdaq if you’re a technophile. Whatever the index, you must be specific about what you compare and measure your portfolio and investing activities against. And then you must generally stick to that index for a long time.
Pick an Index, Any Index (But Don’t Believe More Volatility Gets You Higher Returns)
Ten years on and another bear market later, many investors still keenly remember the Tech bubble bursting, making them fear the Nasdaq. Yes, the Nasdaq tanked in 2000, 2001 and 2002 and led the global market into a relatively long bear market. Is it therefore bad and to be avoided? The Nasdaq isn’t a bad index. In fact, it’s perfectly fine and well constructed. It’s just very narrowly focused and, hence, more volatile. The narrower the index, the more volatile you can expect it to be over time—which is a fairly intuitive investing truth. It has very little that zigs within it to reduce total volatility when something else zags. The Tech-heavy Nasdaq will gyrate wildly with the fortune of mostly Tech and Tech alone.
But there’s no reason to suffer such an intense, near-term roller-coaster ride since over long periods (like your 20, 30 or 40-year investment time horizon), all well-constructed indexes should, near the end, yield very similar returns, though traveling wildly different paths to get there. Maybe you don’t believe that. I hope to convince you.
But you can accept that if all well-constructed major equity benchmarks eventually get you to about the same place, one prime concern should be how smooth the ride will be. Figure 4.2 shows a variety of indexes or benchmarks converging over time but taking different paths en route. These aren’t real indexes but rather a representation of different types.
Figure 4.2 Benchmark and Time Horizon
Note: For illustrative purposes only. Not drawn to scale. Not to be interpreted as a forecast.

Index 4 is a volatile benchmark that vastly outperforms other major indexes at its peaks but vastly underperforms at its troughs. Think of this as any very narrow index, like the Nasdaq, or perhaps a very small country index. Index 3 lagged a bit early on but outperformed in later years—which could be like a larger, developed country index. Index 2 did better early on but trailed off a bit in the past 15 years—which is somewhat similar to Japan. A rational investor would prefer the index with the lowest volatility as represented by Index 1, which arrives with the smoothest ride. The smoothest ride tends to come from the broadest benchmarks.
Currently, the broadest indexes are the globally oriented MSCI World Index, which reflects developed nations and has a long history, and the ACWI, which includes Emerging Markets (which I still prefer to call “less developed nations”—after all, some of them emerge and some of them submerge). The ACWI has a shorter history and is less useful in measuring historical data but is darned acceptable as a benchmark.
Keep in mind, even a very broad index doesn’t protect you from systemic risk. When broad markets fall, a global index likely falls big, too. Huge even! But a global index does mitigate country- and sector-specific risk inherent in narrower indexes.
Risk Versus Return?
How can it be the volatile Nasdaq is likely to get you to about the same place over long periods as the S&P 500 or even the über-broad ACWI? If the Nasdaq is more volatile, you should get more return, right?
Many who have studied finance believe this common myth. It is conventional wisdom—wrong—and propagated commonly by infinitely educated people who should be able to see right through it but somehow can’t. The notion is that to get higher return, you must take more risk, as measured by volatility, so you should have a volatile portfolio if you want to beat the market. That works over time for stocks versus bonds versus cash—which is historically where the concept originated. But within equity types, it’s measurably wrong in history. This is one reason history is so beautiful as a way to test if commonly accepted wisdom is right. If it were true, Tech would have higher long-term returns than less volatile indexes—but it doesn’t.
You can create a narrow, volatile index by taking almost any pure category of stocks that all move the same way in the short term. You get volatility that way, but it has nothing to do with long-term returns (as we cover in Chapter 7 when we discuss supply shifts determining long-term pricing). Were that not true, all the subsectors that make up a broad index, all being more volatile individually than the total index, would have higher returns than the index itself. But that can’t be—the returns of the parts can’t be different than the parts of the returns. This is a very fathomable Question Two most people can’t get themselves to contemplate at all. Within equities, short-term volatility has nothing to do with long-term returns. All correctly calculated equity indexes should get you to about the same return—the equity return—if you give them a long enough period. And the ones that come out ahead don’t come out ahead by much and only by serendipity or some weird shift in stock supply, likely soon reversed.
Mind you, lots of readers will have been taught what I’m telling you here is wrong. But this is a provably false assumption. History says, “It ain’t so.” History is beautiful.
This Question One myth persists because we don’t question our assumptions and don’t use history to verify if theory is real. Investors are biased toward their favorite category, and confirmation bias props up their preset notions. Many investors incorrectly assume their pet category—small-cap growth, Energy, Tech, large value, Emerging Markets, whatever it is—is inherently superior. It’s provably wrong, yet precious few bother to check, which is why this is a great myth to debunk. There is absolutely no evidence any one category is permanently better. A fan of a category can show you a cut of time where that category beat the market. Pick a different starting and ending date and its dominance fades. Take a slightly different cut of the same noun and adjective and their meanings fade, too.
A data mine is when someone, intentionally or unintentionally, picks data conveniently seeming to prove their point. But if you use slightly different data or alter the time frame, the whole thing falls apart. Take the long-held myth small-cap stocks do better than big-cap stocks. Historically, there is some validity to this because since 1926, small stocks on average have done better than big-cap stocks. Most observers confuse averages with (1) what happens most often and (2) reality. We know it’s a myth because if you take the data series used to prove the point, and then take the homogenous periods coming off the bottom of the four biggest bear markets (times when small caps have always done well)—1932 to 1935, 1942 to 1945, 1974 to 1976 and 2002 to 2004—and looked at the rest of history, you would see in the remaining time periods, big-cap stocks did better than small-cap stocks by a big margin. All the excess small-cap return comes from those few periods. But if you could identify the bottom of the four biggest bear markets correctly, you wouldn’t need small-cap stocks to figure out how to beat the market. (Or if you took the very smallest, least liquid small caps out of the study, the whole thing falls apart again.)
My point is the supposed long-term small-cap effect touted by so many is worse than a data mine. It’s a confusion pit for most observers (courtesy of TGH). Otherwise, there’s simply no validity to it. Some long times, like most of the 2000s, small stocks do lead and markedly. Other times, they lag for a long time.
Said another way, if you were 35 in 1945, just back from World War II and starting to invest and thought you knew small-cap stocks did better on average than big cap, you would have gotten all the way to retirement age at 65 in 1975 and seen big cap beating small cap on average during that overall period. That’s just a little too long to count on something working that gets most of its payoff rarely in history. Or say you got back from Vietnam at 25 in 1973, went through psychological counseling for five years, cut your hair and started investing in 1978 at age 30—for the next 20-plus years, big-cap stocks did better on average than small caps (although for the first few years, you would have done well and absorbed some confirmation bias). A quarter century is a long, long time to wait for averages to revert.
Pick your time period carefully, and you can seem to prove a lot of things. But despite most investors having longer time horizons than they think they have, darned few can afford to be wrong for a full quarter of a century. You can combat that by not concentrating all in one size, style, sector, you name it.
If one category was demonstrably better than all the others, we’d all know it by now and invest our money in it; all other equity categories would go away. We’re all subject to capitalism. Stock prices are determined by supply and demand. And no one index, size, style or category is best forever. None. And you don’t have 25 years to wait for the next time category X leads the market.
Global Thinking Equals Better Thinking
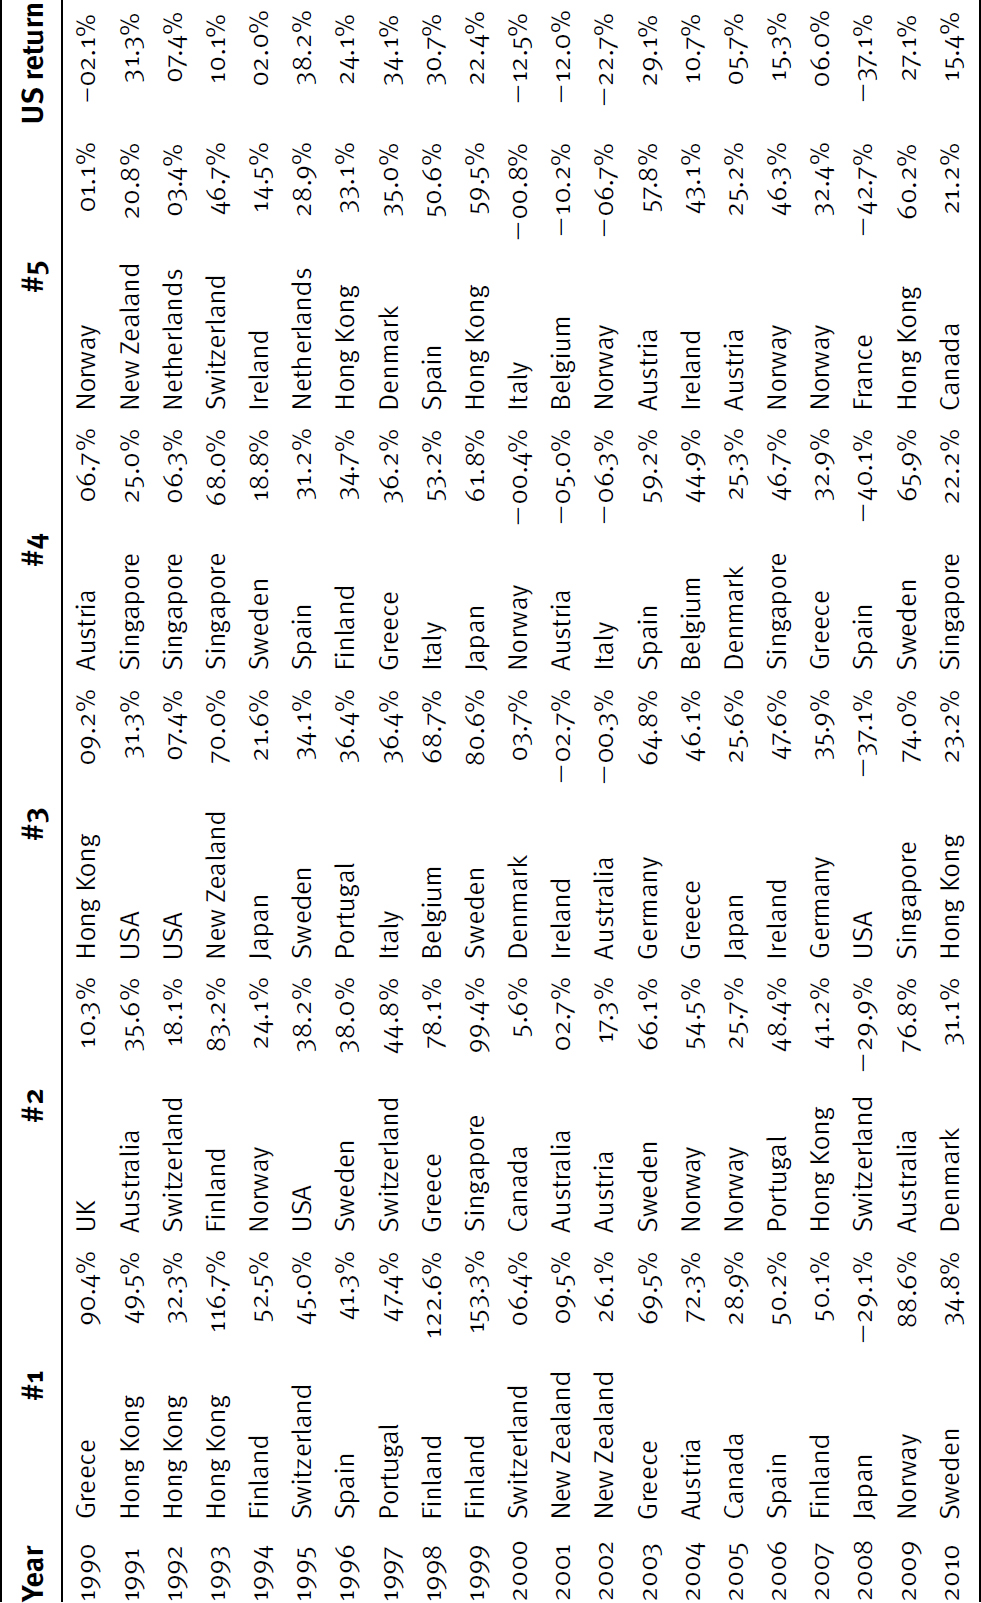
It should make sense the more you spread your exposure globally, the more you spread your risk. No country leads consistently, and no one knows with certainty who the next leader will be. Table 4.2 illustrates the changing leadership of country performance from year to year. The opportunity cost of not diversifying across geographic lines can be huge. Instead of fearing the unfamiliar, you should fear missing large opportunities to be had abroad. And you should fear your own country of origin may be where the roughest risk resides next.
Table 4.2 Leadership Keeps Shifting—Top Five Performing Stock Markets Since 1990
Source: Thomson Reuters, individual country returns from 12/31/1989 to 12/31/2010.8
If you aren’t comfortable picking individual foreign stocks, you can easily get global exposure through a low-cost index fund or an exchange-traded fund (ETF). The MSCI EAFE, reflecting the developed foreign markets, has been widely available as an inexpensive index fund for years. Using such an investment vehicle spreads your risk, getting you needed foreign exposure while being otherwise completely passive.
Note: I’m generally not a fan of mutual funds or index funds (as I wrote in a Forbes column reproduced in Appendix D). They’re usually far too expensive and eliminate too many tax benefits for high net worth investors. But if you have a smaller kitty to work with, they can help you get the diversification you need. And if you don’t know anything others don’t, passiveness is always appropriate.
If you do go the mutual fund route, be sure to buy a sufficiently broad fund or a collection of funds. Also, remember to check the expense ratios. Many funds are very expensive. Diversifying your portfolio globally is smart, but not if fees eat all the benefit.
Truly, you need not fear foreign investing. Many foreign stocks can be purchased easily with US dollars in the form of American depositary receipts (ADRs). What’s more, you need only check your fridge, medicine cabinet, closet, workbench or garage (or heck, maybe your employer) to find plenty of familiar names from foreign lands.
Never Say Dow
I keep saying your benchmark should be a “well-constructed” index, but what’s a “poorly constructed” index? Say hello to the Dow Jones Industrial Average, a very poorly constructed index indeed.
Many investors live and die by the Dow Jones Industrial Average, frequently referred to reverently as “the Dow.” Investors assume the Dow is a reliable market indicator, but in reality, the Dow is poorly constructed, tells little and should never be used as a benchmark. I haven’t paid any attention to the Dow in decades and can’t even tell you its absolute level because I trained myself (as titled in my November 19, 1999, Forbes column) to “Never Say Dow.”
My advice to you is you will see markets better if you train yourself to ignore the Dow for the rest of your life as well. The only time to ever say Dow is when you’re referring to a publishing company, a chemical company or an Asian philosophy (spelled Tao). But never use the Dow Jones Industrial Average.
First, but not most important, the Dow is comprised of only 30 big stocks—hardly a fair and total representation of US markets. Then, those few Dow stocks are picked arbitrarily. Some get taken over and drop out. Others are dropped out and replaced by the Dow committee doing the picking. (They picked Coca-Cola but not Pepsi. Microsoft but not Apple, though Apple is 75% larger by market cap. Then they picked both Merck and Pfizer. Why? No idea.)9 It has maintained its stature in the popular press mainly for sentimental and cultural reasons—the same type of reasons allowing market myths to persist for multiple decades. (That its sponsor also owns the Wall Street Journal and Barron’s doesn’t hurt either.)
But its biggest deficiency is it’s a price-weighted index. Never pay attention to price-weighted indexes—any, ever. Let me say that again for emphasis. Never pay attention to any price-weighted index.
Consider, as I update in 2011, Caterpillar has three times more potential impact on the Dow’s outcome than Microsoft, though Microsoft is three times bigger by market cap.10 Why does a vastly bigger stock have materially less impact? Welcome to price-weighting.
The higher the price per share of a stock in a “price-weighted” index like the Dow (and Japan’s NIKKEI—by the way, don’t use it either—another very misleading price-weighted index), the more impact it has relative to other stocks in the index. In a price-weighted index, a $100 stock has 10 times the future impact on the index as a $10 stock, even though the $10 stock can be from a firm worth vastly more and much bigger by any standard. Madness.
Price-weighted indexes are inherently problematic because if a stock splits, its weight in the index also splits. The overall level of the index hasn’t been affected, but the split reduced the impact of that stock relative to the index’s other stocks. You don’t want to believe that—most people don’t—but it’s true. The reverse is also true—if a stock does a reverse split, as rarely happens (meaning you get one share for every two you owned previously, as an example), the stock’s weight in the index doubles.
Stock splits and reverse splits are purely cosmetic and don’t impact a company’s market capitalization or dividends, investors’ net worth or any other form of real economics—not at all. However, stock splits absolutely affect which stocks have impact and power within a price-weighted index. Unless you can predict stock splits, and there has never yet been a technology capable of it, you don’t have a rational basis for predicting a price-weighted index for even a year or two at a crack—even if you could perfectly predict the price performance of every single stock in the index. That’s a fact. In some years, the Dow would have done 10% better or worse than it actually did depending on which stocks in the index could have ended up splitting or not. I don’t mean 11% instead of 10%. I mean 20% instead of 10%.
Mathematically, year by year, the Dow’s value is quite technically purely random depending on which stocks split and when. In any year, if the split stocks do worse than the stocks that don’t split, the index does better than the average stock. If the stocks that split do better than the stocks that didn’t split, the index does worse than the average return of the stocks.
Crazy, right? Said alternately, if the high-priced-per-share stocks beat the low-priced-per-share stocks, then the Dow does better than the economic returns of its stocks. Conversely, if the low-priced-per-share stocks do better than the high-priced-per-share stocks, then the Dow does worse than its stocks.
You’ve heard the Dow has a thing called the “divisor” to adjust for splits. Let’s truly alter your sense of reality. When a stock in the Dow splits, Dow Jones and Company does adjust the “divisor”—just like with any price-weighted index. This divisor keeps the level of the overall Dow constant from before the change to afterward so it’s cosmetically seamless. That is, changing the divisor makes the split not affect the overall level of the Dow (allegedly) as the split occurs. The divisor is continually adjusted, but it still can’t keep the Dow from its steady march away from reality.
The Two-Stock Index
Here is an easy demonstration why price-weighted indexes are to be shunned and you should wholly disregard the Dow. We’re creating a price-weighted index made up of just two stocks—ABC and XYZ—each initially worth $100 per share. For simplicity, they both have the same overall market value, and every other quantitative feature about them is identical. To get the initial index value, we simply add the prices of ABC and XYZ together, divide by the total number of stocks (2) and get $100. So our Two-Index starts out at 100. Straightforward! You didn’t even need a calculator for that.
On Monday, ABC is up 10% to $110 and XYZ is down 10% to $90. Add 110 to 90 and you get 200, divide by 2 (our initial divisor) and you still get $100, which makes sense because the 10% move in each perfectly offsets. Again, easy math! Nothing weird—yet. Later Monday, they reverse and are both at $100 again and the index remains at 100.
But wait!
On Tuesday, ABC announces a 100-for-1 stock split. Mind you, most splits are usually on the order of 2-for-1 or 3-for-1, but for the sake of example, clarity and insanity (since price-weighted indexes are insane), it’s easier to use extreme numbers. ABC now trades at $1 per share, though the overall value of the company remains unchanged. Nothing changes for shareholders, either. If a shareholder earlier had 100 shares of ABC at $100, now he has 10,000 shares each worth $1—and in both cases owns $10,000 of ABC. ABC sells for $1. XYZ is still $100. Add the two together and you get $101. Divide by 2 and now you get $50.50.
But wait, that isn’t right. That won’t work. We know the index must remain at 100 because nothing changed but the split. Time for a divisor adjustment! Just what the Dow would do. Instead of dividing by 2, like we did initially, now we ask, “What number, divided into 101, gives us 100?” Simple algebra—the answer is 1.01. So we set the new divisor at 1.01, just about half of what it was before the split, and our index remains at 100, and we’re fat, dumb and happy.
On Wednesday, ABC rises 10% again and XYZ falls 10%. But instead of the index remaining unchanged as it should and as it did before the split, now it changes markedly. ABC is now $1.10. XYZ is now $90. Add them together and you get $91.10. Divide by our new divisor of 1.01 and you get an index value of $90.20. What the . . . ? The index fell nearly 10% for no reason other than the two stocks in the index had identical but reverse percentage moves. How can that be?
Welcome to the dirty little secret reality of price-weighted indexes. While the economic returns of the companies haven’t changed one iota since the index’s creation, the index itself has—markedly. If the companies are worth the same, they should have identical impacts on the index, but this is impossible with any price-weighted index—even the most holy Dow.
Said again: In any year, if the split stocks do worse than the stocks that don’t split, the index does better than the average stock. If the stocks that split do better than the stocks that didn’t split, the index does worse than the average return of the stocks.
I’m always amazed, with most professionals focused on craftsmanship, how few of them in their training ever took a course in construction of indexes—which are always craft-like. Almost none! Hard to figure why. For those of you who would like a further, easy–to–self-learn tutorial on index construction, I recommend Chapter 5 of Frank Reilly’s Investment Analysis and Portfolio Management (Dryden Press, 1996). It’s one of my favorite investment textbooks. And Frank is one of my favorite academics and a very nice guy.
A well-constructed index is market-capitalization weighted, which means companies worth more actually weigh more heavily in the index. Apple, with its behemoth market capitalization of $370 billion, has much more impact on the S&P 500 and the ACWI than Caterpillar with its market cap of around $60 billion.11 As it should. Few would argue a bigger stock shouldn’t be more impactful on the index.
Never Maximize Return
So benchmarking should be based on market capitalization-weighted indexes. What’s more, as mentioned earlier, this specific capital markets technology—global benchmarking—is intended not to forecast returns but to keep you on your path and to force you to think globally. It’s the essence of conquering your Stone Age brain and gaining self-control to help you master Question Three.
Even after selecting an appropriate benchmark, many investors end up hurting themselves by trying to maximize return. They want to see big positive returns each and every year—hit home runs—and forget to check what the benchmark is doing as a way to control risk. Tied to order preference, they disregard the importance of relative return versus absolute return in a preference for absolute return. And in doing so, they forget about risk completely.
Relative return is the return realized relative to your chosen benchmark. For instance, if your portfolio returns 5% in a year, you may think it’s a rather poor showing. But if your benchmark is up 3%, you beat the market by 2%, which is very good and better than most do on average. Likewise, you might feel pretty good if your portfolio returns 15% in a year. But if the benchmark did 30%, you lagged by a very big 15%. Making up a lag that big if your aim is to get market-like returns on average is tough—you’d have to beat the market by an average 1% for the next 15 years!
Usually, your focus should be on relative return—how you did versus your benchmark—rather than absolute return. Why? Because we already know if you can do a little better than the market over the long term, you do better than almost all investors—it’s that simple. Even just matching the market is a feat most investors fail at long term—even professionals.
Beating the market (whatever your chosen market is) is a noble goal but very tough. Doable but tough. But instead of focusing on whacking the ball out the park each and every year, a better goal might be to aim to be benchmark-like. If your benchmark is up 20% over a year, you had a great year if you met it or beat it by a little bit with returns of 21% or 23%.
Why is such a narrow margin great? See it this way. If your benchmark is up 20% and you’re up 40%, you may be elated and think you’re a genius. (Beware pride accumulation, overconfidence and hindsight bias!) However, if you take a bet big enough to beat your benchmark by 20%—ask yourself, “What if I was wrong?” Answer: If you were wrong with that same bet, you would have likely lagged the benchmark by 20%. If the benchmark was up 20% and you were flat for the year, you wouldn’t feel so smart anymore.
Remember the good discipline control mechanism talked about in Chapter 3: Don’t aim to beat your benchmark by much more than you are comfortable lagging it. Why? You can and will be wrong. Often! And if you are more wrong than right in a year, you’ll likely lag. That’s ok, and you should expect it. It doesn’t much harm you long term, as long as you use your benchmark to control risk.
If you do beat your benchmark by 30%, you can do a joy dance to the luck gods, but don’t try to repeat it. That’s likely much too much risk for your long-term goals, and you probably should figure out how and why you did it, or next time you may be on the negative end of the spread. Those who swing for the fences regularly strike out much more than average. Try to maximize return, and you may end up maximizing losses. Nobody likes that.
This means, usually, if your benchmark is down, you will be down, too (we look at the one exception a bit later). If your benchmark is down 10% in a year and you’re down a bit more or less, you had a fine year. Your benchmark was slightly negative. It happens. It’s reality and you can’t do anything about it.
For now, start thinking about relative return and not absolute return. Do a good job managing risk and you’ll likely get better results than you do now. Portfolio management is all about controlling risks, not about hitting home runs. Do a poor job by taking on too much or too little risk and you’ll be surprised how quickly you can do lasting harm to your chances of achieving your long-term goals.
The Greatest Risk of All
Most investors focus on risk that is felt as near-term volatility. However, in the long run, the greatest risk you take as an investor is benchmark risk. Benchmark risk is how much you differ from your benchmark, for good or bad. If you have an all-equity benchmark because you need long-term market-like returns to reach your goal but think you’re being safe and conservative by holding large allocations of cash and bonds most of the time, that’s huge benchmark risk and potentially very damaging to your long-term goal. It just isn’t the volatility risk you’re thinking about. You’re betting that, in the long term, stocks do worse than cash and bonds, which is a very long-shot prediction and historically backward.
Consider the risk of needing to average 8% a year (over a long time period, of course) to get the growth needed to support your desired retirement lifestyle and getting only 4% or 5% instead because you held too much in cash and bonds for long periods. Short-term volatility can be very tough to live through, but what can be even tougher is maybe cutting your lifestyle in half in 20 or 30 years because you took on too much benchmark risk and your long-term returns are too low. Really great investors, almost to a person, have hardened themselves to normal volatility for just this reason. (And yes, volatility is normal. Read more in Chapter 3 of my 2011 book, Markets Never Forget.)
Benchmark risk doesn’t apply only to stocks versus bonds. You take on benchmark risk by becoming too heavily weighted in any category relative to the benchmark. Think of the investors who got killed in the Tech bubble crash. If your benchmark was 30% Technology in 1999 (about the S&P 500’s weight then) and you were one of many who let their Tech allocation creep up to 50% or 60% (or 80% or 90%) of your overall holdings, you adopted tremendous benchmark risk. With such a big relative overweight, your portfolio had to crumble relative to the market as Tech imploded. This happened to many, many folks without their ever knowing what hit them. What hit them? A lack of risk control by failing to control benchmark risk! When you focus on benchmark risk, the risk of something like Tech going crazy on you is ever present in your foresight. Must be!
Anytime there’s an asset bubble that nails investors hard, investors look for scapegoats. It’s natural! They blame greedy bankers, stupid central bankers, stupider politicians. Maybe any or all of them are to blame, maybe not. But none of them are responsible for your portfolio decisions. Folks who let a part of their portfolio get out of whack and then get whacked bigger than they should after that part implodes should blame, first and foremost, their own overconfidence that led them to take such massive benchmark risk.
Overconfidence can cause benchmark risk in the other direction, too. Heavy underweighting or divesting entirely of a benchmark sector can hurt just as much as being a crazed over-investor. This would be all the folks who said in 1995 they would never own Tech because they didn’t understand it. It isn’t so hard to understand. And from there, over the next five years, Tech did great, and not owning it at all seriously hurt. Making that decision—saying I won’t own something that is a huge part of the world and one easily learned with a little effort—is a little like saying, “I don’t understand women, so I won’t ever associate with any.” Tough choice! Stupid choice! A lot of benchmark risk. A lot of lifelong opportunity cost.
Investors who either tremendously overweight or underweight any sector aren’t asking Question Three. They’re suffering from overconfidence (among other errors) and can’t see they might be wrong about the bets they make. That was what guided me when I maintained a small position in Tech in 2000, even though I was certain I knew something others didn’t about what would cause a Tech implosion. I was ready to act on my bet, but I didn’t want to make it too extreme, knowing I could be wrong.
If you make a big bet against your benchmark and are wrong, you won’t get the performance your benchmark would have given you without the bet. Investors overweighted in Tech in 2000 were wrong and paid the price. Investors hiding under a rock in 2003 were wrong about Tech, and the rest of the market to boot, as stocks boomed. Because they took big bets away from their benchmark and were wrong, they likely lagged big. Big benchmark lag can be very hard to make up. The remedy is simple—if you don’t believe you know something others don’t, just be like your benchmark. Be passive! If you believe you know something others don’t, bet on it, but don’t be too darned extreme—because you still may be wrong. And will be sometimes.
There is one, and only one, instance when, in my view, it can be worth risk to adopt huge benchmark risk and seriously deviate from your benchmark. But we’re not ready for that—not quite. Get the Three Questions under your belt, and we’ll talk about how to improve your odds of recognizing a true bear market in Chapter 8.
You may wonder how to be like your benchmark and how to know what a benchmark looks like. All major equity indexes have websites (www.standardandpoors.com and www.msci.com, for example) where the indexes are conveniently broken down into sectors and even percentage weightings. Usually, you can even find the P/E for your index, helping you decide if you want to be more value or growth oriented. Let those percentages guide you, not your overconfident Stone Age brain. Start from those weightings and make departures from there based only on what you believe you know but others don’t. Bet where you can. Where you can’t, be passive and benchmark-like. The benchmarks are good road maps toward long-term equity returns.
Beating the Market Is Hard—But Possible
What about beating the market? Beating the market is possible, though difficult. But more important, it needn’t be an occasional lucky accident. There are those among professionals and academics who want you to believe the market is so darned efficient, if you do beat it, it was unrepeatable serendipity. They would have you believe Bill Miller, Bill Gross and Peter Lynch were simply lucky for so long. Nonsense! What did they have in common? They knew things others didn’t.
You can aim to increase your success rate if you know something others don’t via the Three Questions. How? Take measured amounts of benchmark risk. The idea is to outperform the market if you’re right with your bets and not get hurt too badly if you’re wrong. You needn’t be right with every bet. And you probably won’t be! You just must be more right than wrong on average—as long as you don’t try to be too extreme with any bets.
Remember what you learned in Chapter 3—if you’re really bullish on a sector and the sector is about 10% of your benchmark, consider making a small bet by increasing your holdings to 13% or maybe 15% of your overall assets. Heck—double the weight and make it 20% if the Three Questions have you convinced (but not overconfident) you have found something really unique. If you’re right, you participate even more in a hot sector. If you’re wrong, you aren’t hurt too badly. Same on the flip side—if you think a sector is for the birds and it’s 10% of your benchmark, don’t ax your entire holding. Instead, drop it back to 5% or 7% or 8%. If you’re right, you have participated less in a lousy sector. If you’re wrong about the sector and it’s the best performing one this year, you won’t have missed out entirely.
You have plenty of potential decisions every year—each with a chance to make a bet. More foreign or US? More value or growth? Small-cap bias or large? Health Care or Tech? Energy, Materials, Telecom, Utilities? And what about industries and sub-industries? The list goes on. Decide where and when and how much to make a relative over- or underweight on each part of your benchmark (always limiting yourself to what you think you know others don’t). You don’t need an educated opinion about each and every category. Don’t know how to analyze the Telecom sector? If you can’t make a bet based on knowing something others don’t for a category, just be benchmark-like. Telecom is 8% of your benchmark? Then hold 8% in Telecom—maybe hold 2% to 3% in a few different Telecom stocks to be diversified. Or buy a Telecom ETF. That’s easy.
Get more bets right than wrong on average over your long time horizon, and that’s a recipe for beating the market. As Warren Buffet used to say, this is a game where you can wait for a great pitch—the ball coming at you that you know something unique about.
If you use your benchmark, beating the market isn’t the insurmountable task many believe. And if you do become great at the Three Questions, you still won’t beat the market each and every year and maybe not even for two, three or four years in a row. I’ve had multiple periods where I lagged the market for several years because I got my bets wrong, but by controlling benchmark risk, I didn’t lag by a lot, and you can make that up later. The reason so many fail longer term—including most investing professionals—is (1) they don’t restrict themselves to making investing decisions based on something others don’t or can’t know and (2) they don’t use a benchmark to control risk, and their risky bets can go haywire on them.
Some folks claim they use a benchmark and do actually check how the S&P 500 does each year. But mostly those people are more focused on maximizing return than on maximizing the odds of beating the benchmark. They aren’t managing benchmark risk on an ongoing, forward-looking basis. They just use the benchmark return to tell them how well or badly they did—after the fact. Even investors who focus on relative return often use their benchmark incorrectly. If you compare their portfolios with their benchmark’s sector weightings, you may find them far too heavy in their favorite sectors and light to nil in those sectors they “don’t understand” or “don’t like.” That’s why proper global benchmarking is a wonderful Question Three capital markets technology you can use right away, and it won’t fade away from you no matter how many others adopt it.
Now that you know the Three Questions and can use the results to develop tools to create forecasts and remain disciplined, you’re ready for some more applications of the Three Questions and ways to know something your fellow investors don’t or can’t. In other words, you are ready to start beating the market. Onward!
Notes
1. Global Financial Data, Inc., S&P 500 Index annual total returns, 1926 through 2010.
2. National Oceanic and Atmospheric Administration, National Hurricane Center, “Retired Hurricane Names 1954–2005,” http://www.nhc.noaa.gov/retirednames.shtml (accessed May 11, 2006).
3. James O’Shaughnessy, What Works on Wall Street: A Guide to the Best-Performing Investments Strategies of All Time (New York: McGraw-Hill, 1997).
4. Kenneth L. Fisher and Meir Statman, “Investor Sentiment and Stock Returns,” Financial Analysts Journal (March/April 2000), pp. 16–23.
5. Thomson Reuters, S&P 500 total return from 12/31/1998 to 12/31/1999.
6. Kenneth L. Fisher, “Forecasting Made Easy,” Research (September 2002), pp. 50–54.
7. See note 4.
8. Thomson Reuters, MSCI Australia, MSCI Austria, MSCI Belgium, MSCI Canada, MSCI Denmark, MSCI Finland, MSCI France, MSCI Germany, MSCI Greece, MSCI Hong Kong, MSCI Ireland, MSCI Italy, MSCI Japan, MSCI Netherlands, MSCI New Zealand, MSCI Norway, MSCI Portugal, MSCI Singapore, MSCI Spain, MSCI Sweden, MSCI Switzerland, MSCI UK, MSCI USA, all total return indexes from 12/31/1989 to 12/31/2010.
9. Thomson Reuters, DJIA constituents as of 09/30/2011.
10. Thomson Reuters, as of 09/30/2011.
11. Thomson Reuters, as of 12/21/2011.