
Chapter 6. Tools for Intent
Enterprise frameworks, Cisco DNA, Intent-Based Networking—they all provide descriptions and context on how network infrastructures are designed and operated and how they should work and interoperate with applications, users, and other “external” sources. It is all abstract and concept-based.
Without the proper tools and technologies, these concepts cannot be implemented and brought into practice. One of the key responsibilities for a network architect or network engineer is to know which tool or technology can meet the specific requirements set by the business.
A significant number of tools and technologies exist that can be used. It is impossible to provide a full compendium of all tools and include an in-depth explanation of them. This chapter provides you with an overview of some of the tools available for campus networks that can be used to enable Intent. Chances are that you are using some of these tools already, and this will help in enabling Intent-Based on your network infrastructure.
This chapter covers the following topics:
What Is Network Automation?
Network automation is one of the key concepts used to enable an Intent-Based Network. There is no Intent-Based Network without a process for network automation. The word automation is defined in the Oxford dictionary as “the use or introduction of automatic equipment in manufacturing or other process or facility.” This definition is clearly related to automation processes in industrial environments like factories. The definition can be applied to a network infrastructure as well. In general, the operation of a campus network consists of creating the network and operating it by performing software updates and changes to its configuration.
Network automation is thus the process (or methodology) where software can automatically provision, configure, test, and manage network devices.
Several examples for network automation already exist, such as a Cisco Application-Centric Infrastructure-based Datacenter, where the Application Policy Infrastructure Controller (APIC) is configuring the network devices (and firewalls) automatically. The concept of network automation also exists in the campus network, where access points are configured and managed automatically by the wireless LAN Controller (WLC).
Network operations are in general responsible for the full lifecycle of the network infrastructure. This lifecycle management is based on executing a number of tasks, whether on an individual device or on a group of devices. Although several methodologies are available that can logically group these different tasks, within network automation, the most common methodology is based on the time when the tasks are commonly executed. Figure 6-1 provides an overview of this grouping.

Figure 6-1 Grouping of Network Lifecycle Management Tasks Over Time
In essence, the life of the network device (or system as a whole) is looped through a number of stages. These stages are grouped around the tasks that network operations normally perform on the network device (or system).
The tasks related to the installation and provisioning of a new network device (or network) are grouped into day-0 operations. In other words, the network device is racked and stacked into the equipment room, supplied with the appropriate operating system version and proper configuration.
The tasks related to configuration and operation management (monitoring) are grouped in day-1 operations. In other words, if a device requires a change in configuration, the change procedure is grouped under day-1 operations.
Troubleshooting tasks, such as responding to an incident or problem resolution, are grouped in day-2 operations. Day-2 operation tasks can be seen as those tasks required to bring the network (device) back into the normal operating state.
Other common operational tasks, such as patching and updating the software on network devices, are grouped into day-n operations. These operations are not performed sequentially from a day-2 operation but can be executed on any day in the lifecycle of the network device (or network as a whole). Therefore, these operations are named day-n.
Unfortunately, no real group is defined for the decommissioning of a network device or network. If it is the removal of a virtual network, it would logically be grouped under day-1 operations, as it is a configuration change.
Network device removal would occur either when the network device is replaced, which would result in day-0 operations, or when the complete network is removed, which basically ends the lifecycle as a whole.
It is, of course, possible to execute the different tasks related to the lifecycle individually on a box-by-box basis. Network automation tools, however, can execute these tasks automatically on all related and required network devices, reducing the risk of human error often at a higher speed. Network automation tools typically provide services and solutions in day-0, day-1, and day-n operations. The focus for automation within an IBN is primarily on day-0 operation (provisioning a base network infrastructure) and day-1 operations (creating or removing networks or policies based on the requested intent). That explains the importance of network automation for Intent-enabled networks.
Network Automation Tools
A vast number of network automation tools are available on the market. It would be near impossible to provide a complete list of available network automation tools that can be used to transform existing networks into an Intent-Based Network infrastructure. A complete book could be written for an extensive list of network automation tools, including a detailed overview of their configuration and inner workings. It is not the author’s intent to provide a full detailed overview of all tools available, but rather to provide a brief overview of commonly found and available tools that can be used to transform existing networks into Intent-Based Networks.
Cisco DNA Center
Cisco announced DNA Center (DNAC) in June 2017 together with Intent-Based Networking. Cisco DNA Center is developed for a Cisco DNA-based network infrastructure and integrates the automation, analytics, and cloud service management functions into a single solution. Cisco DNA Center is an evolution of Cisco’s APIC-EM software architecture with many internal and external improvements. Cisco DNA Center’s solution combines several applications, such as LAN automation, assurance, and policygeneration, into a single unified platform and experience. It is Cisco’s targeted platform for any Intent-Based Network.
Cisco DNA Center’s first public release was version 1.1, primarily targeting Software-Defined Access (SDA) solutions and a public beta of analytics. Cisco DNA Center version 1.2 introduced new features into the solution focusing on non-SDA-based networks, a plug-and-play application (day-0 operations), and improvements for the assurance and analytics component.
Within Cisco DNAC, the configuration and operation of the campus network is based on a three-step approach. Some steps are more focused on SDA-based networks than others. But these three general steps are used to configure and deploy campus networks:
Step 1. Design: In this step, the campus network is designed. This design is based on a hierarchical view of the campus network consisting of areas, buildings, and floors. An area could be a geographical area or a single city. The hierarchical design itself is up to the administrator. Each level of the hierarchical view can be used to set specific network settings, such as IP address pools, DHCP and DNS settings, software image versions, as well as network profiles. Network profiles are template-based configurations applied to each network device assigned up to that level in the network hierarchy. The network profile mechanism is used primarily for non-SDA-based networks. Figure 6-2 provides an example view of the network hierarchy and the different settings available within the design step.

Figure 6-2 Hierarchical Design Within Cisco DNA Center
Step 2. Policy: The specific network policies are defined in the policy step. Although this step primarily focuses on SDA-based networks, allowing you to create virtual networks, access-group policies, and one or more fabrics, it is also used to define specific QoS settings on the network.
Step 3. Provision: In the last step, the information specified in the design and policy step are provisioned onto the network devices. This step is executed for both non-SDA-based networks (where network devices are provisioned to a specific location in the network hierarchy) or SDA-based networks (where multiple fabrics can be defined and deployed). Figure 6-3 provides a screenshot of the provision step within DNAC for a non-fabric network.

Figure 6-3 Screenshot of Provision Step Within DNA Center
These three steps together form the basis for any network managed and operated within DNAC.
From a network automation perspective, several tasks are tightly integrated into different tools and steps within DNAC. DNAC can perform the following tasks from the single pane of view:
Day-0—Provision: Usin0067 LAN Automation for SDA-based networks or network Plug-and-Play (PnP) makes it possible to provision new network devices with ease of use.
Day-1—Change and operate: Using the policy and design steps, changes to the network can be prepared and documented. The provision step allows the changes to be executed on the devices that require change.
Day-n—Patch and update: DNAC includes a software image management application, called SWIM. This application is based on image management within Prime Infrastructure and allows the administrator to define golden images for network device families and for specific locations in the network hierarchy. If devices do not have this software image, a workflow can be used to update those devices to the new golden image.
As DNAC is designed and built for a Cisco Digital Network Architecture, DNAC provides APIs both for network devices (including third-party network device support) as well as APIs that third-party software developers can use to communicate with DNAC. This allows DNAC to be integrated with a wide range of other applications, for example, IT Service Management (ITSM) tools.
These integrations combined with a single solution to design, provision, and operate a campus network allow DNAC to provide a unique holistic view of the complete campus enterprise network. And as DNAC matures, more and more features and applications will be integrated within DNAC.
Prime Infrastructure and APIC-EM
Although Cisco DNA Center is developed for Intent-Based Networking based on SDA, DNAC is still early in its features and possibilities compared to mainstream network management solutions such as Cisco Prime Infrastructure and Cisco Application Policy Infrastructure Controller Enterprise Module (APIC-EM). These two software solutions, tightly integrated, have been around for a while and have matured over time. Although it is not possible to compare both solutions feature-wise as they were developed for different purposes, the combination of Prime Infrastructure and Cisco APIC-EM can be used to transform existing networks to Intent-Based Networks.
Cisco Prime Infrastructure has been the primary campus network management system from Cisco for a number of years. Cisco Prime Infrastructure has evolved over the past years into a stable product. The strong features on wireless (such as the configuration of wireless networks, providing wireless client statistics, extensive reporting capabilities, and generating heat maps) demonstrate the origins of Prime Infrastructure from the earlier Cisco Wireless Control System. Over the past years, an increasing number of features have been integrated into Prime Infrastructure for the management of LAN and WAN solutions. Prime Infrastructure’s design principle is that you first design and prepare the network within Prime Infrastructure and then provision (deploy) the configuration or image to the devices. For a campus network to transform into IBN, the most powerful features of Prime are the command-line template deployment, image management, and its API capabilities.
The Cisco APIC-EM solution was introduced in 2015. Its initial launch was intended as an SDN controller for enterprise networks. The architecture of APIC-EM is quite different from Prime Infrastructure. Where Prime Infrastructure is a single monolithic database that contains all data, APIC-EM uses an application-centric architecture. On top of a common infrastructure (within the appliance and operating system), different applications can be installed and deployed to perform network-related functions. The most common and known applications are Network Plug and Play (for day-0 operations), Path Trace (how does a specific packet flow through the network?), and EasyQoS (enable Quality of Service based on best practices and application definitions where the app will generate the proper configuration based on the network device’s role). Other applications are available as well. The architecture of APIC-EM has been the basis for the development of DNAC.
One of the true strengths of APIC-EM is its Network PnP application. This application allows a network operator to predefine a configuration (static or template) and attach that template to a switch. As the switch is booted (from factory default configuration), it connects to APIC-EM, and once the template is assigned to the device by the operator, the configuration deployment is executed by APIC-EM. This device configuration can include a specific operating system (IOS or IOS-XE) version that is approved for the specific enterprise. Network Plug-and-Play is explained in Appendix A, “Campus Network Technologies”, as it is used by both APIC-EM and DNA Center.
The combination of these two tools can be used to get started transforming existing campus networks to IBN. APIC-EM is used for day-0 operations (provisioning of new devices), and Prime is used to provision templates. If you use APIC-EM for day-0 operations, the CLI templates of Prime Infrastructure are used to deploy and remove services on the network. The APIs available within Prime Infrastructure and APIC-EM are used to enable programmability.
Network Services Orchestrator
One of the probably lesser known products from Cisco for automation is Network Services Orchestrator (NSO). As the name implies, it is a service orchestration tool primarily targeted for service provider networks. But as enterprise networks and service provider networks are merging more and more together (virtualization of network functions, harmonizing software running on devices), NSO makes it quite capable for the automation function within IBN.
NSO takes a model and transactional driven approach to the network. NSO collects the configuration from network devices and stores that configuration in the configuration database called CDB. The data stored in the CDB is not the actual (text) version of the configuration, like the inventory in Prime, but it is translated into an abstracted model of the configuration. This network model is based on the common available YANG models. And as YANG has become the de facto standard, NSO can support a wide number of network devices. In this aspect, Network Elements Drivers (NED) translate the configuration stored in the YANG model into the actual configuration commands required for a specific network device. A huge list of NEDs are available that can be used. Also, sample code for models and configuration has become available on a special GitHub repository (https://github.com/NSO-developer) since NSO has become free for development purposes.
Note
YANG itself is a modeling language and has become an industry standard to model the configuration of a network device.
Besides the CDB for configuration, NSO uses a YANG model to define the services that run on the network. As mentioned, NSO was originally written for Service Providers. A service description is similar to an intent description and thus has similar behavior. Instead of service descriptions, NSO can be used to describe available intents and allow NSO to provision those intents to the campus network. As the network is abstracted into models, NSO also provides the possibility to manage network functions, or specifically virtual network functions. A package manager is used in combination with a VNF management module to deploy and manage the full lifecycle of virtual network functions. Besides having a CLI and web interface, NSO also provides API support to have self-service systems request automated changes to the network. Figure 6-4 displays a schematic overview of the different elements of NSO.
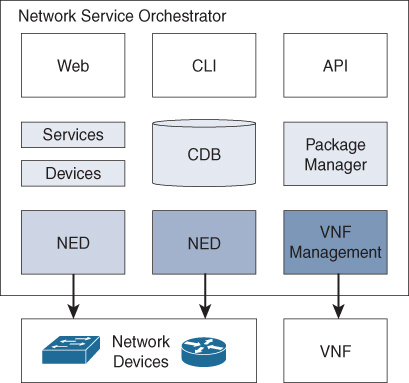
Figure 6-4 Schematic Overview of NSO
One of the advantages of NSO is its transactional behavior. If a change is required on the network, the change is prepared in the CDB, and once committed, the change is executed on the network devices using the translations by the NEDs. If the commit fails on one of the required network devices, the complete change is rolled back. So the configuration of the network devices remains consistent with the model defined in CDB and the services applied.
Another advantage of NSO is that the network itself is (if no other access to devices is allowed) represented in the CDB. This allows network engineers or operators to check the applied configuration of all network devices using the CDB instead of having to log in to each device to validate the configuration.
Changes to common items, such as SNMP or Syslog, can be executed easily, using a single transaction. Example 6-1 represents a common template applied to all devices in a single transaction.
Example 6-1 NTP Configuration via NSO
admin@ncs(config)# devices template “Common parameters” config
admin@ncs(config-config)# ios:ip domain name company.org
admin@ncs(config-config)# ios:ntp server server-list 172.16.1.3
admin@ncs(config-server-list-172.16.1.3)# exit
admin@ncs(config-config)# ios:logging host 172.16.1.3
admin@ncs(config-host-172.16.1.3)# exit
admin@ncs(config-config)# exit
admin@ncs(config-template-Common parameters)# commit
Commit complete.
admin@ncs(config-template-Common parameters)# exit
admin@ncs(config)# devices device-group all apply-template template-name ?
admin@ncs(config)# devices device-group all apply-template template-name
  Common parameters
admin@ncs(config)#
From an IBN perspective, NSO as an automation tool provides the features required for all automation tasks. For day-0 operations, Zero Touch Provisioning (ZTP) is used, where TFTP and DHCP are combined to provide the initial configuration to a device. Once the device is bootstrapped with the initial configuration, it can be linked to a device group and services applied.
Puppet Enterprise
Puppet Enterprise (from Puppet Labs) is a software automation tool originally developed for server (and application) automation in the datacenter and cloud. Puppet Enterprise takes a unique approach to automation and is truly developed from a DevOps perspective.
The Puppet Enterprise architecture is based on the principle that automation is a method to provide a node into a specific state and keep that node in that specific state. Puppet Enterprise accomplishes this by using a platform-independent language that describes the state a specific file, directory, or server needs to be in. This language is used to create specific Puppet Enterprise modules. (See this as a way to logically group specific states.) These modules are imported (uploaded) to a puppet master server where puppet agents talk. Periodically, by default every 30 minutes, the puppet agent checks which modules are applicable for its host and checks whether its host is compliant with the state. If it is not, the module, together with the language and attributes, provides mechanisms for the agent to place that node into the requested state.
A common example used to illustrate the power of this state-matching methodology is the provisioning of a new server or container. From the puppet master, a new server deployment is requested with a specific number of tags. Puppet communicates with the virtualization platform (or cloud) to request that the new server be created based on a specific template. Once that server is booted, the agent registers itself with the puppet master and requests what state it needs to be in. Based on the provided modules, the agent installs the proper server software, such as mail-server, application server. The agent also installs the correct configuration files and makes sure common things such as NTP and Syslog are configured properly. The expected state is confirmed back to the puppet master. In turn, the load balancer is informed that a new server is ready and is in the correct state, and the server is added into the server pool to execute the work.
This short example demonstrates the power that Puppet harnesses. One of the benefits is that troubleshooting a server problem has become less frequent. The code on the application server has been tested and approved from a test environment. In case of a problem, the problematic server can just be thrown away and a new server provisioned automatically. Besides that new install, the Puppet system itself takes care of the rest.
Puppet provides a few advantages. First, the puppet language is not comparable with any programming language. It is truly a descriptive state language, so no iterations are available; you just describe what you want the server to have. Although the learning curve for developers is steep, this is eventually a powerful advantage. Example 6-2 displays a small piece of a puppet module for the NTP configuration on a Linux server.
Example 6-2 Puppet Class Definition for NTP Configuration
# @summary
#  This class handles the configuration file for NTP
# @api private
#
class ntp::config {
      file {     $ntp::config:
             ensure => file,
             owner => 0,
             group => 0,
             mode => $::ntp::config_filemode,
             content => $step_ticker_content,
      }
      # remove dhclient ntpscript which modifies ntp.conf on RHEL and Amazon Linux
      file  {
             ‘/etc/dhcp/dhcpclient.d/ntp.sh’,
             ensure => absent
      }
}
This code example describes that there must be a config file, with owner root (userid 0), and that the content is provided in a specific variable (which is defined earlier in the code). The file ntp.sh must not be present to resolve a conflict with specific Linux versions. This is where the power of Puppet really comes into play. Every 30 minutes the puppet agent checks whether that file is there, and if this is the case, it removes the file automatically.
The other advantage is platform independence. Puppet agents are available for many modern operating systems, such as Windows, Linux, and MacOSX. For example, Google, Inc. has used Puppet to automate workstation management (including Apple MacBookPros) in the past. With funding of Cisco Investments, Puppet support for Nexus and IOS-XE switches was introduced. The requirement was that a puppet agent had to be installed on the specific switch. However, in June 2018 Puppet also launched a module that provides support for IOS switches without requiring an agent on that switch. That puppet module allows you to configure Cisco Catalyst switches running IOS with specific configuration sets. Example 6-3 displays the puppet file for configuration of NTP on that switch.
Example 6-3 Puppet Code for NTP Configuration on a Switch
ntp_server { ‘10.141.1.1’:
   ensure => ‘present’,
   key => 94,
   prefer => true,
   minpoll => 4,
   maxpoll => 14,
   source_interface => ‘vlan 42’,
}
This code describes the state the switch must have, including an NTP server configured with IP address 10.141.1.1 and that the source interface is vlan42. The puppet agent takes care of the rest. If in time the NTP server needs to be changed, then you just need to change the value in this file, and the automation tool takes care of the rest automatically.
Puppet Enterprise is available as open source (with some feature limitations) as well as a free version for up to ten nodes. Above these ten nodes, a paid subscription model is required. Quite a few resources are available for Puppet Enterprise, including a ready-to-use virtual machine appliance as well as a website called PuppetForge where modules are shared.
Ansible
Ansible is a similar automation solution to Puppet Enterprise. Both Puppet and Ansible originate from server and application automation environments to facilitate the DevOps methodology. Ansible itself is completely open source, and as an automation engine it allows for provisioning and configuration management. In contrast to Puppet, Ansible is an agent-less solution. In other words, instead of an agent polling a master for the state the managed node should be in, an Ansible server connects to the managed nodes and executes the different automation tasks.
The Ansible solution consists of a number of components that work together. Figure 6-5 provides an overview of the components that make up a typical Ansible deployment.

Figure 6-5 A Component Overview of an Ansible Solution
Control Engine
At the heart of the solution is the Ansible control engine. As Ansible is written on Linux, you do need a UNIX-based platform to run the control engine. The control engine is configured using a combination of inventory files, modules, and playbooks.
The inventory files define which nodes the control engine needs to manage and how to connect and authenticate to these devices. Within an Ansible deployment, it is common to use asymmetric SSH keys for the authentication of the control engine on the managed node. Ansible modules for Cisco provide support for both username/password and asymmetric keys for authentication.
Asymmetric SSH Key Authentication
It is common for network operators to connect to network devices using SSH. SSH allows a remote user to connect to the shell (or CLI) via a secure communication channel. For Cisco devices, the authentication is commonly based on username and password (local or centralized using TACACS or RADIUS); however, it is also possible to perform authentication using asymmetric keys. The private key is stored on the remote terminal (commonly the user’s home directory), and the public key is stored on the remote terminal server. Instead of using username/passwords, data is encrypted with the user’s private key. The remote server uses the user’s public key to decrypt that data. And as these two keys are uniquely and mathematically tied together, it is used as authentication of the user. This mechanism does not require interactive input of a password, so scripts can use this mechanism to perform tasks on other servers.
Ansible extensively uses this mechanism to execute the different tasks on the nodes it manages.
Playbooks are text files in the YAML Ain’t Markup Language (YAML) format. These playbooks define the tasks with the specific configuration that needs to be applied to the managed nodes. YAML is a common format for configuration files and is human readable. Example 6-4 provides a code excerpt of an Ansible playbook to perform two commands on the managed devices.
Example 6-4 Code Excerpt for an Ansible Playbook
tasks:
- name: run commands on remote devices
 ios_command:
  commands:
      - show version
      - show ip int brief
The playbook file (or files) can be seen as a combination of configuration and scripted steps to be executed on the managed nodes.
Modules are used within Ansible to define which tasks or configurations can be executed on a managed node. The contents of playbook files are essentially defined by which modules are used for which device. From a network perspective, network modules are available for almost all Cisco operating systems, including Cisco AireOS (Classic Wireless LAN Controllers), Cisco IOS-XE (Catalyst 3650/3850 and Catalyst 9000 series), as well as Cisco Meraki. By using a modular approach Ansible is flexible and allows for a multitude of supported devices and environments. Already more than 750 modules are available. And because Ansible is open source, it is possible to write your own module if required.
Control Tower
Although Ansible is an automation tool, the tool itself does not execute playbooks (and thus configuration changes) automatically. A command needs to be executed by a user to define which playbook needs to be executed with a number of variables on a number of managed nodes. Only then is the automation started and executed. The success of Ansible is also based on the quality and contents of the playbooks. They essentially contain all the steps that need to be executed automatically. Learning YAML and defining these playbooks does require a steep learning curve, and editing text files from a command prompt is not exactly user friendly.
That is one of the reasons why in 2016 an Ansible Tower was introduced in the solution by RedHat. An Ansible Tower provides a graphical user interface for defining workflows, tasks, and the ability to schedule tasks on the control engine to be executed. The Ansible Tower also provides a RESTful API so that developers can leverage those APIs to request changes (playbooks) to be executed from within applications, which could be web-based frontend servers to customers. Ansible Tower itself is a commercial product, but the development is executed in the AWX project, which is an open source version of Ansible Tower.
In conclusion, the network operator uses the Ansible Tower to configure workflows and playbooks and schedules the different automation tasks. The Ansible Tower in turn pushes the configuration files and playbooks to the control engine. The control engine executes the playbooks onto the different managed nodes. As the playbooks can also be used to execute tests, it is possible to implement a complete CI/CD toolchain within Ansible. Figure 6-6 provides the flow for a network automated via Ansible. The complete Ansible solution is, of course, scalable and redundant, so it is possible to scale out to multiple towers and control engines for redundancy and scale.

Figure 6-6 Overview of Ansible Components
From a network automation perspective, there are a few disadvantages to Ansible. One of the foremost disadvantages is that the network devices need to have a minimum configuration for management access (for example, a reachable management IP address and user credentials) before Ansible can be used. So complete day-0 automation is not possible without using other tools, such as APIC-EM. Another disadvantage is that Ansible is in general trigger-based automation. In other words, a trigger is needed to set the Ansible control engine to execute playbooks. There is no periodic control or validation if the managed devices are still configured as they should. To enable that kind of continuous validation, it is required to develop custom playbooks and schedule these via an Ansible Tower or other mechanisms.
Build Your Own Tool
Not all organizations are the same, and thus not all campus networks are implemented in the same way. In some situations, commercially available software cannot be used for a number of reasons. One could be the size of the campus network in correlation to the available tools. (This could be because the campus network is too large or too small for the cost of the tool.) Other reasons could be related to rules and regulations that apply to a specific industry or a specific organization. For example, the management network is not allowed to connect to the Internet for security reasons, cloud-based applications are not allowed at all, or the network supporting the business processes is too complex for the existing tools.
In those cases, where the requirements cannot be met by the commercially available tools, the alternative is to build an automation tool dedicated for that specific organization.
This option, to build your own automation tool, has become a popular alternative over the past few years. This is not only due to the Cisco DNA design principle to use open standards and APIs within the network architecture, but over the past years the Cisco DevNet community (http://developer.cisco.com), the resource for developers who want to use the APIs available within Cisco, has become very successful. DevNet has evolved from a semirestricted community for third-party integrators to an open and active community.
The community has grown largely because of the tremendous amount of effort Cisco has put into DevNet by providing free video training, sample codes, and software development kits (SDK) to get you started on network programmability.
And for that start on network programmability, the Python programming language was selected for several code samples and libraries. Python is an open source programming language that runs both interpreted as well as compiled. Just as with the Java programming language, the compiled output of Python code is an optimized byte-coded binary file, and a special virtual machine is used to run that byte-code upon execution. The DevNet website from Cisco provides several free video trainings to learn Python.
Type of Programming Languages
Code to write software applications is written in programming languages. Each programming language has its own structure and grammar, just as English and Spanish are languages with their own specific spelling and grammar. In general, there are two types of programming languages: compiled and interpreted. With compiled programming languages, such as C, Obj-C, and C#, the source code is run through a compiler. The compiler translates and optimizes the source code into binary machine code, usually optimized for a specific hardware platform. This byte-code is commonly known as an application or executable. The binary code is not readable by humans anymore, but it runs efficiently on the target computer. Interpreted programming languages are not translated by a compiler. At runtime, an interpreter reads the source code line by line, interprets the code, and executes the statements of that code. JavaScript is such an interpreted code. The advantage of interpreted code is that the code remains readable. The disadvantage is that the code is not optimized and generally runs slower than compiled code.
As DevNet has grown over the years, the available code for network programmability in Python has grown as well. Besides a huge repository on DevNet (The DevNet Code Exchange) a number of open source libraries are available that can be used to create a custom-built automation tool. Open source libraries like Nornir (https://nornir.readthedocs.io/en/latest/) and eNMS (https://enms.readthedocs.io/en/latest/) can already provide a head-start in creating an IBN-enabled automation tool. Open configuration standards such as Netconf also support the ability to develop a common approach to deploying configurations onto the network devices without the difficulties of sending and interpreting specific CLI commands. Also, open standards like Zero Touch Provisioning (ZTP) and Plug and Play (PnP) enable the possibility to include day-0 operations.
In conclusion, a custom-built automation tool can be a valid alternative in situations where commercially available tools do not fit in with the enterprise’s specific requirements or limitations.
Use Case: Shared Service Group Datacenter Automation
SharedServices Group provides shared services to a large number of locations and end users. SharedServices Group (SSG) also provides services from its own datacenter. The enterprise has grown via mergers and acquisitions where the services inside the datacenter needed to be consolidated at a rapid pace. Because each merger or acquisition had its own datacenter, the merged datacenter consequently became a large but diverse mix of networks, applications, and services. Essentially SSG has become a service provider (multitenancy) from a service offering perspective but with a collection enterprise–based datacenter design.
Consequently, the datacenter network itself, including the routes—connectivity links between tenants—had become complex and possibly too large. Changes for one tenant on the datacenter network frequently caused failures for other tenants as changes were executed manually device by device. The datacenter network became too large and complex to manage. To reduce the number of failures, the datacenter network had to be standardized to reduce the risk of human error.
But because of the size, the complexity, and the large number of specials (special configurations for non-standard services), it was not possible to use standard automation tools. They were not fit either for the size or for the high number of diversities. Besides these restrictions, network consultants and architects who have the expertise required to implement tools at such a scale were difficult to find. And external tools would require a drastic change in the internal datacenter team and a gaining of trust.
So instead of using and heavily adopting off-the-shelf software for automation, SSG decided to build its own automation tool focused on the specific design and requirements for its datacenter and services.
SSG used open source tooling in conjunction with custom software to develop an automation pipeline that generated and deployed the configuration of a new tenant automatically within four hours instead of four months. And each network service was created in the same manner.
Section Summary
Of course, many more automation tools are available, and the description of tools in the previous paragraphs only provides a limited overview. For an IBN, an automation tool is essential. As such, the maturity and number of automation tools will increase over time. If an automation tool is not yet available, it is important to select the right automation tool. This should be based not only on the requirements set in Cisco DNA and IBN, but also on budget, platform, and features required for the specific organization. In case of a committed strategy toward Software Defined Access, DNA Center would be the most logical choice. However, if Prime Infrastructure is already in use, it is common sense to start the journey toward IBN based on Prime and APIC-EM.
Network Analytics
The other key aspect of Intent-Based Networking is that the intents being pushed onto the network are validated using the analytics function of Cisco DNA. For an Intent-Based Network, the analytics function receives (or obtains) data from the network infrastructure and validates if the Intent is configured correctly. However, the information received also contains other information, such as the operation of the network in general, connected clients, operation of network functions, and other contextual data such as applications running on the network. In general, the analytics component allows the network visibility to be increased. To accomplish that, the analytics component is essentially composed of a number of functions as described in the following sections.
Validation of Intent
For IBN, the most important function of the analytics component is the validation of Intent. Once a piece of configuration has been deployed to the network, the analytics component can use the retrieved data, such as running configuration, but also ARP entries and routing tables to validate whether the specified Intent is working as expected. If an Intent is not behaving as expected, the function can and will report that.
Network Function Analytics
A campus network consists of a number of technologies and network functions that combined form the network. The list of technologies is extensive and includes common technologies like Spanning Tree Protocol, VLANs, wired interfaces, wireless communications, interface statistics, IP interfaces, routing protocols, and so on.
Traditionally, these technologies are monitored individually, or in in other words, without context. If a specific element of a single technology fails, an alert is generated, and the operations team responds to that. But what if that technology is combined with other technology and the network is still functioning? The operations team would still need to respond of course, but perhaps with a lower urgency. The network function itself is still operating.
This type of intelligently combining data collected by the analytics component is used within IBN to analyze and monitor network functions.
An example for this intelligent combination would be that a distribution switch of an IP address is connected to a VLAN interface but no access switches have that VLAN configured. It might not be a direct failure of a network function, but this possible fault could not be detected by monitoring technologies individually. Context is created by combining the two technologies and can conclude that the combination is not as normally expected.
Network Services Availability
Besides network functions, other services are also required to enable a campus network. Services that are critical to network availability would be DHCP and DNS. These servers are usually managed by departments other than the team responsible for the campus network. However, the campus operations team will receive the call that a specific location on the network is not working. The network services availability function, within the analytics component, uses the collected data to analyze whether required network services are available and working as expected. If a DHCP server is responding with an error like the scope is full, or another error, this data can be collected and responded on.
Another example of network services would be a RADIUS check to the central policy server, to check that RADIUS (and thus IEEE 802.1x) is still working.
Trend Analysis
As data about intent, network functions, and services is already collected, enough data becomes available to perform trend analysis. This trend analysis can be used to determine whether, for example, uplinks need to be upgraded. Although this is already common in most managed networks, the function must also exist within IBN.
Application Behavior Analytics
Network devices, such as switches, routers, and wireless controllers, have become more intelligent over the years. With technologies, such as Network-Based Application Recognition (NBAR), Application Visibility and Control (AVC), and more recently Encrypted Threat Analytics (ETA), the network can recognize applications that run over the network. This information can, smartly, be combined with the other data that the network provides to analyze how applications behave on the network. This function is used within IBN to provide business-based feedback on how applications are performing. It is possible to deduce that Microsoft Outlook is slow because the response from the Microsoft Exchange Server took too long and Outlook has re-sent the request. This kind of analytics provides more insight into the ever-increasing number of applications that run on the network.
These functions are all using data obtained from the campus network infrastructure component within Cisco DNA–essentially the network infrastructure devices. It would be nearly impossible to obtain this kind of information with traditional data collection methods such as command line, SNMP, and Syslog. Although these protocols are used as well, they do have issues in terms of scalability, standardization, and obtaining the proper data. A new concept, called model-driven telemetry, is also used to get the required data from the network infrastructure. Model-Driven Telemetry (MDT) is explained in more detail in Appendix A, “Campus Network Technologies,” but in general, a collector subscribes to a number of information elements on the network devices. And the network devices send updates on a regular basis. And as MDT is part of Cisco DNA and IBN, the model itself, including the transport, is open and available.
The analytics component is probably for most enterprises currently an underestimated function as most first steps to Intent-Based Networking are focused on automation. However, data combined with machine intelligence does provide big promises in actively supporting network operation teams to manage the network.
Network Analytics Tools
A number of tools are available for analytics and network visibility; however, not all can be applied to Cisco DNA to enable IBN. The following sections provide an overview of network tools that can be used for IBN. Just like with automation, composing a complete list of visibility tools would result in an entire book. This overview is intended to explain the concepts and how certain tools can be used within analytics to enable IBN.
DNA Center Assurance
The most obvious tool available for network visibility is part of the Cisco DNA Center (DNAC) solution. Within DNAC there is an application available called Assurance. This big data analysis platform makes use of Tesseract and a number of big data lake technologies to analyze the data it collects from the managed devices.
DNAC Assurance leverages the data available within the DNAC solution (such as the network topology and type of devices) as well as the required data received from the network infrastructure. DNAC Assurance processes and analyzes the data and tries to determine the overall health of the network. DNAC presents the data using dashboards, with overall health, network health, and client health. All kinds of found issues, such as sticky wireless clients and sudden packet drops in the wired infrastructure, have a place in these dashboards and have an impact on the health.
For example, if the connection to a specific campus location is down or unreachable, the total health of the network will go down and the health of that site will go to 0%. DNAC leverages the information, such as network topology, to provide more context. If in the same example the wireless controller is down, or a number of APs, then the health score of the site will go down, but when the operator views the details, it immediately sees that the wireless health is low while wired is still working. Figure 6-7 shows a screenshot for the health of the connected clients within DNAC Assurance.

Figure 6-7 Overview of the Client Health Within DNAC
Cisco DNAC Assurance is written with the primary use cases of the network operator in mind. DNAC Assurance attempts to prioritize incidents or issues found within the network by showing the top issues first. Also, all information is drilled down, and features like client 360 and device 360 are available as well. A key feature within DNAC Assurance is the ability to go back in time. As the data DNAC Assurance collects is stored in a big data lake, it is possible to reconstruct the state of the network around the time that an issue occurred. This is powerful for troubleshooting incidents such as the wireless network was not working last Friday. Figure 6-8 displays an example of an AP whose health was dropped for a short period of time. By hovering over the moment, the reasons for the reduced health can be seen.

Figure 6-8 DNAC Assurance Health History of an AP
From an application or client perspective, DNAC has the capability to analyze a number of behaviors automatically. For example, in DNA Center 1.2, there are more than 77 issues defined related to wireless client behavior, such as sticky client behavior, client not authenticating, or the client onboarding time (how long it takes to connect to the network). Figure 6-9 shows a dashboard example on the client onboarding times.

Figure 6-9 DNAC Assurance Dashboard of Client Onboarding Times
In conclusion, DNAC Assurance is built for Intent-Based Networking and comes with all necessary functions for the analytics component. Over time, more features are added into DNAC Assurance, providing an even more complete view of the network.
Prime Infrastructure
The Cisco Prime Infrastructure is perhaps not designed and built for the purpose of network analytics in an Intent-Based Network as Cisco DNA Center. But it can provide some functionality required within IBN for network analytics. Prime Infrastructure is a network management and operations tool. It is built around existing protocols like NetFlow, Syslog, and SNMP to proactively monitor the network infrastructure. In that mind-set, it is possible, although perhaps a bit more restricted compared to DNA Center, to use Prime Infrastructure for the network analytics functions described previously.
Although SNMP and Syslog do not provide the same level of network function analysis as MDT, Prime Infrastructure can proactively monitor the network on some basic network functions like the availability of wireless networks, VLAN interfaces up and down, and whether there are errors with ARP.
The reporting in Prime is extensive and provides a number of reports that can be used for availability and trend analysis and thus provides the necessary features for the IBN network assurance functions, such as network service availability and trend analysis.
Prime Infrastructure uses NetFlow to analyze and collect data on application performance and usage of the network by applications. Several screens and reports can be used to view the application performance and therefore create a limited use of the Application Behavior Analytics function.
One of the key features of network analytics is to validate if the network is performing correctly according to the requested intents. Prime Infrastructure does not provide an off-the-shelf feature to check this continuously, but it is possible to create compliance templates and use those templates to validate the deployed intents against these compliance templates and provide a report. This does require quite a bit of manual work, however.
Prime Infrastructure does provide an extensive list of possibilities to proactively report on failures and alerts, including email, Syslog, alerts, and SNMP alerts. These possibilities can be used in combination with reporting and other functions to proactively support the network operations teams in case of a failure or when a device is not compliant to the deployed templates.
Also, from an API perspective, Prime Infrastructure already provides a rather extensive set of REST APIs to obtain data from Prime Infrastructure from other applications. These APIs can also be used to obtain data from Prime that is not available from a screen or report.
API Usage
One of my fellow Cisco Champions asked if there was a report within Prime Infrastructure to view which channel assignments were applied on the radios of each wireless access point. It is cumbersome to check each individual access point as opposed to having a single, easier-to-digest overview, specifically for large deployments where hundreds of access points are deployed. A report is available within Prime, but it would show the number of access points assigned to each channel and not which AP has which channel. An export to CSV of that same report would show the history of channel assignments but not the actual status.
Although there is no report to get the actual information, there is an API call that can be used to get actual information about access points, including radio channel assignments. Using that API (and authentication), a quick program has been written that connects to Prime Infrastructure, fetches the information, and exports it in a CSV format so that the data can be analyzed or processed in a different tool. This example showcases that the APIs within Prime Infrastructure are powerful and can be leveraged to obtain information otherwise not directly available within the Prime Infrastructure user interface.
Prime Infrastructure does not have the same feature velocity as Cisco DNA Center for network analytics. Over time DNA Center will likely replace Prime Infrastructure as a network management tool; however, Prime Infrastructure can certainly be used to start transforming existing networks to Intent-Based Networking as long as the restrictions such as machine intelligence and detailed network function analysis are known and accepted.
NetBrain
NetBrain is a tool that provides network visibility. One of its main powers is that it dynamically can create a map of the enterprise network using the running configuration and live status of the network. NetBrain also offers advanced features like documentation generation, Microsoft Visio document generation, comparison of configurations, and doing path-traces based on the network configuration and how the configuration is run in hardware.
NetBrain features QApps and Runbooks to automate and support troubleshooting. QApps are small apps that operators can write themselves within NetBrain to streamline a number of troubleshooting steps with a single click. In other words, the QApp defines the steps that need to be executed for a specific troubleshooting step (or test), and NetBrain executes the steps. The development of a QApp is via the GUI within NetBrain. Figure 6-10 displays the general workflow of a QApp within NetBrain.

Figure 6-10 Generic Workflow of a QApp
Runbooks are similar to playbooks in Ansible. They can be used within NetBrain to execute several actions, including checks and rollbacks. This can be used not only for change management but also to validate enabled intents on the network. Figure 6-11 shows a screenshot of a runbook creation.
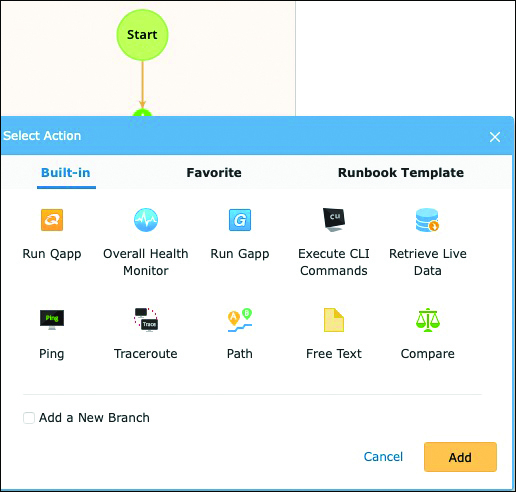
Figure 6-11 Screenshot of Runbook Creation Within NetBrain
NetBrain is capable of performing some of the functions related to the network analytics component with an Intent-Based Network, specifically the validation of enabled intents and validating network functions and services. As NetBrain’s primary purpose is to operate and maintain the network, functions such as application analysis and trend analysis are not its core strengths.
Ansible
As described earlier in this chapter, Ansible is in principle an automation engine and not directly related to network analytics functions. However, Ansible is used in CI/CD automation pipelines, and that should include automated tests as well. This testing functionality could be used to deploy some form of network analytics functions via Ansible. And although Ansible itself is trigger-based, the Ansible Tower can be used to set up a schedule to periodically execute a set of playbooks.
These playbooks would primarily focus on testing the validity of the network, for example, by checking BGP neighbor status, specific routes, or interface status. The code in Example 6-5 could be used to check if a VLAN is up on the distribution switch.
Example 6-5 Ansible Configuration to Check if a VLAN Is Up
tasks:
- name: test interface status
 net_interface:
  name: vlan100
  state: up
Although this example is straightforward, it does demonstrate that it is possible to check some elements of the campus network using Ansible playbooks. Ansible (in combination with an Ansible Tower) can be used to perform the following network analytics functions within an Intent-Based Network:
Validation of Intent
Network function analytics
Network service availability
By writing extra code in Python it would be possible to generate the required test playbooks based on the Intents that are deployed onto the network.
The other two functions, trend analysis and application behavior analytics, cannot be implemented via Ansible. These functions could be implemented via other software solutions focusing on data collection and analysis.
Ansible cannot perform all network analytics functions. However, if Ansible is used as an automation tool for an intent-based network, it can be used to continuously check for the requested intents. It would require some custom coding around Ansible, though, to generalize the playbooks and validate them toward the dynamic intents.
In conclusion, the functions and features for network analytics within Cisco DNA are still in development. Although Cisco DNA Center is built for an IBN and it does provide all functions, DNA Center itself is not yet applicable to all campus networks for a number of reasons. Also, competitors provide similar functions with other tools, and they also introduce new features and functions over time, as well as probably adopting the open MDT standard as well in conjunction with NetFlow, Syslog, and SNMP.
And as the transition to IBN will most probably take a considerable amount of time as well, it is important to know whether existing tools within the enterprise already provide a number of network analytics functions instead of introducing another new tool to the suite of network management tools.
Summary
An enterprise framework, a technology architecture, and IBN alone all provide descriptions and context on how network infrastructures are designed and operated and should work and operate with applications, end users, and other “external” sources. It is all abstract and not directly implemented. Tools and technologies are required to implement these abstract architectures and designs. Two key areas that make an Intent-Based Network unique are automation and network analytics. Tools should implement these two key areas.
Network Automation
Within an Intent-Based Network, the network automation function translates the network intent requests to pieces of configuration and deploys them onto the devices within the infrastructure. Network automation is a key component of Cisco DNA and must be implemented for a successful Intent-Based Network. Several automation tools described in this chapter are capable of implementing this automation role within Cisco DNA (and thus enable IBN). Table 6-1 provides a schematic overview of the different tools and how they are related to the automation function within Cisco DNA.
Table 6-1 Overview of Automation Tools and Their Capabilities
Tool |
Day-0 |
Day-1 |
Day-2 |
Day-n |
Cisco DNA Center |
√ |
√ |
√ |
√ |
Cisco Prime Infrastructure and APIC-EM |
√ |
√ |
√ |
√ |
Cisco Network Service Orchestrator |
|
√ |
√ |
√ |
Puppet Enterprise |
|
√ |
√ |
√ |
RedHat Ansible |
|
√ |
√ |
√ |
Build your own |
√ |
√ |
√ |
√ |
Almost all tools are capable of performing automation on the different tasks in network management. However, only Cisco DNA Center and the combination Prime Infrastructure with APIC-EM provide an off-the-shelf solution for the provisioning of network devices. It is, of course, possible to perform day-0 operations with a custom-built tool as well.
From an intent-based network perspective, Cisco DNA Center is the preferred tool with Prime Infrastructure and APIC-EM as second best. However, if there is familiarity with RedHat Ansible or Puppet Enterprise in the organization, they could be used as well.
Network Analytics
The other key area within IBN is network analytics. For an Intent-Based Network, the analytics function receives (or obtains) data from the network infrastructure and validates whether the intent is configured correctly. However, the information received also contains data on the operation of the network in general, operation of network functions, connected clients, and other contextual data. In general, the network analytics component allows the network visibility to be increased. This increase in visibility is effectively established by adding extra functions and features in the analytics component of Cisco DNA. These extra features are
Validation of intent
Network function analytics
Network services availability
Trend analysis
Application behavior analytics
Leveraging big data and analytics within networking is rather new. A limited set of tools are available on the market, where specific tools are focusing on a specific part of the network, such as Cisco Tetration for the datacenter. This chapter described a number of tools known for their analytics component. It is expected that over time more tools will become available for the analytics function within IBN. Table 6-2 provides an overview of the tools described in this chapter and the features they support.
Table 6-2 Overview of Tools That Can Perform the Analytics Features of Cisco DNA
Tool |
Intent Validation |
Network Function Analysis |
Network Service Availability |
Trend Analysis |
Application Behavior Analysis |
Cisco DNA Center |
√ |
√ |
√ |
√ |
√ |
Cisco Prime Infrastructure |
|
√ |
√ |
√ |
|
NetBrain |
|
√ |
√ |
√ |
√ |
RedHat Ansible |
√ |
√ |
√ |
|
|