4
![]()
The Aptitude-Achievement Connection
Using an Aptitude Test to Aid
in Allocating Educational Resources
In chapter 3 we learned that the PSAT, the shorter and easier version of the SAT, can be used effectively as one important part of selection decisions for scholarships. In this chapter we expand on this discussion to illustrate that the PSAT also provides evidence that can help us allocate scarce educational resources. We will look in a different, but allied arena: admission decisions for high school advanced placement courses.
One of the lasting success stories in American education is the College Board's Advanced Placement (AP) program. It originally allowed only a small elite to take advanced courses in high school and thus to obtain college credit. However, the program has taken on a life of its own and spread widely in American high schools. The number of participants has doubled every ten years. Today more than half of American high schools and a third of four-year college-bound seniors participate in this burgeoning program. Whereas overall assessments of American public schools range from highly critical1 to favorable, even optimistic,2 all sides give AP their approval. A major strength of AP and a possible reason for its success is its eschewing fads for a solid collaboration between high school teachers and college professors, with an emphasis on subject content.
A growing number of states support it in many ways, including paying student fees, requiring all high schools to offer AP courses, appropriating funds for AP, supporting teacher training for AP, compelling state colleges and universities to accept for credit AP grades of 3 or higher, and requiring AP students to take the national examination. Five civil rights organizations have sued the University of California on behalf of black, Hispanic, and Filipino-American students charging discriminatory admissions policies, based on the practice of giving credit to college applicants for AP courses, which are less available to minority students.3
The very popularity of the Advanced Placement program means we are faced with a problem. The rigor of the material within AP courses means that they may not be suitable for all students. Moreover, because of the special training required for AP teachers and the smallish class sizes, there is often limited availability. How is a school district to decide how many AP classes make sense for its student body? And who among their students would benefit most from such courses? The answers to these important and difficult questions ought to be based on evidence, and the evidence that can help us answer both questions is aptitude test scores. We should base our choice of specific aptitude test on both validity and convenience. An invalid test does no one good, nor does any measure that is too expensive of time or of treasure. I will show that the SAT and its derivative, the PSAT, are fine choices.
In the more than eighty years since the Scholastic Aptitude Test was first added to the College Board's Admission Testing Program its character has remained remarkably constant. In fact, Carl Brigham's decision in 1929 to meld its six subtests into two separate scores, measuring respectively verbal and mathematical aptitude, yielded a test that bears a striking similarity to that which is familiar to many of today's high school seniors. Although the original SAT, a direct lineal descendent of a massadministered standardized test of “general intelligence,” is very similar to its current namesake, the interpretation of its scores has changed. No longer are SAT scores viewed as an immutable result of innate ability, but rather as a complex mixture of inputs from both nature and nurture.
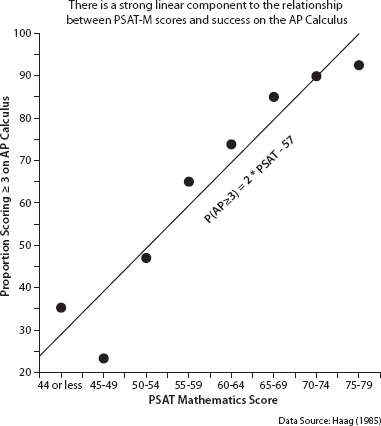
Figure 4.1. A rough estimate of the relationship between performance on the PSAT-Math test and the likelihood of a score of 3 or greater on the AP Calculus test. Based on a sample of about 1,000 students (Haag 1985). As we will see in Figure 4.3, this relationship is described better with the nonlinear connecting function that is only hinted at here.
Figure 4.1 is a plot, based on a relatively small data set, that shows a strong linear component in the relationship between performance on the PSAT-Mathematics test and the probability of obtaining a minimally passing score of 3 or greater4 on the AP Calculus AB exam over most of the range of the data. Once that relationship is nailed down with a more extensive data-gathering effort, it would be straightforward to exploit the empirical relationship between performance on aptitude and achievement tests to provide educational resources in a more efficacious manner. It can also help us to understand some schools' unexpected achievements.
The 1988 movie Stand and Deliver chronicled the remarkable success the students of Jaime Escalante, a math teacher in Garfield High School in Los Angeles, had on the AP Calculus test. In the next section I explicate Escalante's efforts, using the school's results on an aptitude test to provide context. Next I contrast two quite different school districts:
1. La Canada, an upscale Los Angeles suburb with a single high school in which sixty-four out of the sixty-six students who took the AP Calculus examination passed it.
2. The city of Detroit, with a much larger school population that is overwhelmingly African-American and low income, and with twenty-three high schools in which a total of eighty-nine students took the AP Calculus exam, of whom fifty-eight passed.5
All of these apparently discrepant results are predictable from advance information. I will illustrate how this information can guide school officials to make good use of limited resources.
CALCULUS, GARFIELD HIGH SCHOOL,
AND MIRACLES
Miracles abound in the Holy Bible. David Hume (1955) forcefully debunked such events as “a violation of the laws of nature…[p] resented to us by a barbarous and ignorant people.” Hume's contemporary, Immanuel Kant (1793), more tactfully answered the question of miracles by pointing out that they seemed to occur relatively often in ancient times, but had become much rarer recently. Indeed, ever since these philosophers showed the contradiction between miracles and the skeptical empiricism of science, the former have occurred less often—with one exception. Miracles appear to happen almost every day in American education. Let me relate the story of one such wonder, then examine it within the context of additional empirical evidence.
In 1988 the film Stand and deliver told the inspiring story of Jaime Escalante, a math teacher at Garfield High School. As depicted in the film, Garfield was an educationally marginal, inner-city school with a largely Latino student population. The film suggested that Garfield was a home for the kinds of low achievement and high dropout rates that satisfy the common stereotype. Into this miasma stepped Jaime Escalante, a hardworking and idealistic math teacher who through the force of his own will dragged a collection of Garfield students down a mathematical path that ended with their successfully completing a course in college-level calculus and passing the AP Calculus exam. This initial success inspired future generations of Garfield students to take AP Calculus, at one point making Garfield one of the leading performers on this test in the entire country. The truth, though less dramatic, is more instructive and equally inspiring.
In 1986, 129 Garfield students took the AP Calculus AB examination and 85 (66 percent) passed it, to put Garfield fourth in the country,6 a remarkable accomplishment. How did Escalante do it? There are two obvious answers. First he recruited the 129 students who took the exam, and second he taught them enough calculus to allow them to pass it. This partitioning of the task into two parts, recruitment and teaching, provides a guide to the analysis. Let us begin with recruitment.
In 1986, 270 Garfield seniors, 34 percent of the class, took the SAT and had an average math score of 410. To proceed with the analysis I make the simple assumptions that Garfield High School is the same as the rest of the country in three respects:
1. The relationship between PSAT and SAT scores
2. The conditional distribution of SAT scores around the mean
3. The relationship between PSAT and AP tests
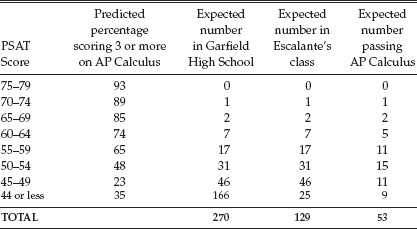
Table 4.1 The Predicted Performance of Students from Garfield High School on AP calculus
Last, I assume that the 129 students that Escalante recruited were the best from the senior class.
These assumptions yield the results in table 4.1, which summarizes the analysis. The first two columns merely represent what was shown graphically in figure 4.1.7 The third column is derived from the cumulative normal distribution with mean of 410 and standard deviation of 100 (assumption 2). Column 4 simply chooses the top scoring students at Garfield for Escalante's class; and the last column multiplies column 4 by column 2 (assumptions 1 and 3) and rounds. Thus the overall prediction is that approximately fifty-three students from Escalante's class would be expected to score 3 or more on AP Calculus.
But eighty-five passed. This is thirty–two more than what is expected from this normative analysis. This prediction is based on national averages. Courses that are better than average will do better. Courses that are worse than average will do worse. We can characterize the “excess” passing of thirty–two students as the Escalante effect.
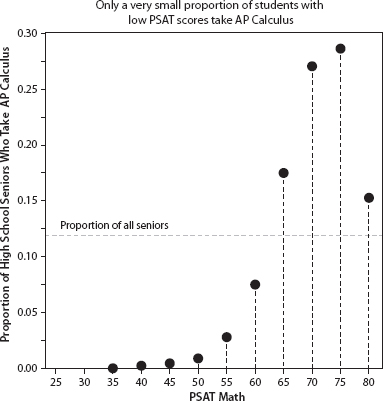
Figure 4.2. The selection function that shows the proportion of students who took the AP Calculus examination in 1997 as a function of their PSAT-Mathematics score
The Escalante effect encompasses both impressive teaching and recruiting. As is evident in Table 4.1, I assumed that he recruited from the top down in Garfield High School and got everyone. This is in sharp contrast with what is observed nationally. Figure 4.2 shows the proportion of students who take the AP Calculus exam nationally as a function of PSAT score. Aside from the anomalous downturn at the high end, we see a steady increase in the likelihood of taking this exam with performance on the PSAT. But only a small proportion of students with PSAT scores below 60 take the test; the proportion of students whose PSAT scores are below 50 who take it is minuscule. Escalante not only recruited students below this threshold, but also managed to get a substantial proportion of them to pass the exam. The results displayed in this figure will be important in understanding subsequent outcomes.
This analysis helps us to understand the size of the miracle at Garfield High School. Jaime Escalante did not turn straw into gold—he had a cadre of some good students. But he did somehow elicit from them very impressive efforts. We must also credit Escalante with extraordinary efforts at recruitment. Of course, our assumption of his having recruited the best students at Garfield High School may be somewhat wrong, in which case Escalante gets more credit as a teacher and less as a recruiter. But these results derive from the most likely scenario.
For further insight, let us consider Garfield High School in 1997, six years after Escalante resigned his position there. Instead of eighty-five, the number of passing grades in AP Calculus had shrunk to nineteen, less than 3 percent of the graduating class. Part of this shrinkage is due to the loss of a gifted recruiter and teacher, but a substantial part was due to the shifting character of the student body of Garfield High School. This aspect was predicted by Garfield's declining scores on mathematics aptitude tests.
In 1987 the school's standardized mathematics achievement scores were at the 53rd percentile. These dropped steadily to the 37th percentile in 1993 and at the 24th percentile in spring of 1998.8 Over the same period the SAT-Mathematics scores suffered a consistent and parallel decline of more than 50 points. Based upon this new distribution of student ability, we would predict that twenty-four students at Garfield could pass AP Calculus, close to the actual number (nineteen) that passed.
To place Escalante's accomplishment in a broader perspective, and to demonstrate another use for this prediction technology, let us consider the size of the potential audience for an AP Calculus class at a high-performing suburban high school. Not far from Garfield High School, in an upscale suburb of Los Angeles, is La Canada High School. La Canada is near the top of a common “citation index” for effective advanced placement teaching, with 2 AP tests taken per graduating senior. La Canada had 232 SAT test takers in 1998, with an average math score of 605.
Table 4.2
The Predicted Performance of students from
La Canada High School on AP Calculus
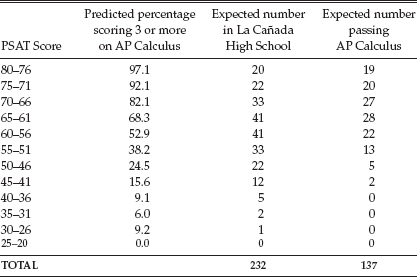
Making the same assumptions as we did with Garfield High School, we obtain the potential results shown in Table 4.2.
Table 4.2 is identical in formation to Table 4.1 except that the relationship between AP scores and PSAT scores has been updated. This update reflects much greater stochastic stability, since it is based on a sample of 94,000 students that the College Board's Wayne Camara9 published. Its precision is an order of magnitude greater than the function shown in Figure 4.1. It also reflects the recentering of PSAT scores that took place in 1995. Shown in Figure 4.3 is the updated analog to Figure 4.1. The solid points are the empirical results; the small dots are from the interpolating function fitted to those points. As is easily seen, the model fits like a glove. I used this revised functional relation to obtain the results shown in Table 4.2.
This suggests that La Canada has the student potential for 137 students to take and pass the AP Calculus (assuming a course no more nor less effective than the national average). In fact, sixty-four did pass this exam, 47 percent of the potential number. The difference between what could have happened and what did happen is surely the result of both recruitment and teaching. Recruitment for AP Calculus at La Canada faces a different challenge than at Garfield—the number of AP courses offered means a competition for the most able students. In addition, and of at least equal importance, La Canada sharply restricts enrollment in AP courses to students who are virtually certain to pass the exam (the typical pass rate in AP Calculus is 97 percent). The disparity between the number who pass the exam and the potential number who could have passed it suggests the enrollment in AP Calculus is overly restrictive; that with both appropriate resources and encouragement, La Canada's AP Calculus program could be substantially enlarged. Yet the strategy of limiting enrollment to students who are very likely to pass is one way to allocate resources effectively. As we shall see in the next example, the city of Detroit follows much the same strategy, but in a different way.
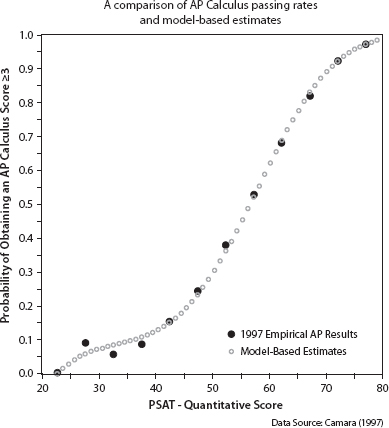
Figure 4.3 An estimate of the relationship between performance on the PSAT-Math test and the likelihood of a score of 3 or greater on the AP Calculus test. Based on a sample of about 94,000 students.
CALCULUS AND THE POTENTIAL OF DETROIT
The principal point of this chapter is that the evidence provided by the empirical relationship between aptitude and achievement test scores provides a context for understanding the test results. This increase in understanding can allow a more efficacious allocation of students to classes. The AP Calculus results for the city of Detroit are our third illustration of how this technique can be used. This example reflects an important variation from the two examples discussed in the previous section; few students in Detroit take either the SAT or the PSAT.
Detroit is a city with highly segregated schools that are 95 percent African-American. In 1997 approximately 5,000 students graduated from city schools. Of these students, only fifty-eight passed the AP calculus examination. Fifty-eight passing AP scores out of a student pool of 5,000 seems like a small number. But Detroit is not La Canada in either the average performance of its student body or in the resources available for their education. We need to know what is the size of the available pool of students suitable for AP classes, for it is against this base that we should evaluate the efficacy of Detroit's AP programs. Because few students in Detroit take the SAT, other information is needed to estimate the size of the pool of qualified AP test takers.
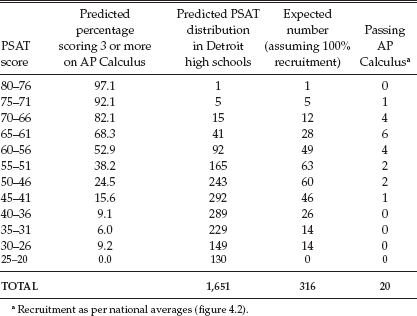
I used the mathematics portion of both the Michigan State High School Proficiency test and the Metropolitan 7 test scores to find where Detroit's students' stand. They are well below the national average, and a little lower than the position of African-American students nationwide on the SAT and PSAT. From the average of both state test scores we would estimate a mean math PSAT score of 42.10 Combining this result with the national estimate that 30 percent of African-American students take the PSAT yields the estimated PSAT distribution shown in the third column of table 4.3.
We can predict that, based upon the imputed PSAT score distribution of the approximately 1,650 Detroit students anticipated to take the PSAT, 316 (about 20 percent) would pass the AP Calculus test. That fifty-eight did pass the test suggests that there is a potential demand for an expanded AP Calculus program within Detroit.11
Table 4.3
The Predicted Performance of High School Students from Detroit on AP Calculus
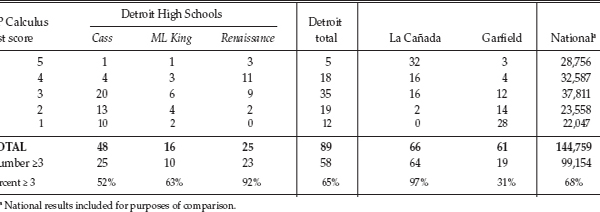
But what is likely to be the cost of servicing this demand? Table 4.4 enumerates the Detroit students who took the AP Calculus test in 1997, broken down by their high school and the grade they achieved on the AP Calculus test. We see that there is a reasonably high success rate among Detroit's students who take AP Calculus, but this is surely due to the very selective nature of the schools that offer the course.12 I include the 1997 performance of La Canada and Garfield High Schools, as well as the nation as a whole, for comparison.13 Does it make sense, in view of the number of Detroit students who might profitably take AP Calculus, for the schools to expand this course offering?
For this question Table 4.3 becomes an important tool indeed. School programs are always the result of a series of triage decisions. Limited resources mean that choices must be made. Consider the entries in Table 4.3 and note that as the PSAT-M score decreases, the “yield” of passing scores decreases as well. Students whose PSAT-M scores are below 55 have considerably less than a fifty-fifty chance of passing the exam. Is it sensible to provide a course that is so poorly aimed at the students in it? Would it be a better use of resources to provide a more suitable course for the students who do not show the necessary aptitude?
Table 4.4
The Performance of High School Students from the City of Detroit,
as well as La Canada and Garfield High Schools on AP Calculus.
This is clearly the approach taken by both Detroit, where AP Calculus is only given at a few, highly selective high schools, and at La Canada, in which students are not permitted to take AP Calculus unless they are almost certain to pass.
The approach taken here can even provide some information on the quality of instruction. For example, it appears that the three elite Detroit high schools admit students to AP Calculus who score above the 80th percentile based on national norms. This means that this distribution of ability in those schools can be well represented as a normal distribution, which (on the PSAT scale) is cut off below a score of 59. If we assume that the eighty-nine students who elected to take AP Calculus were the top eighty-nine students attending these schools, we would expect, from national results, that fifty-eight would score 3 or better, exactly what occurred. From this we infer that the instruction that they received was at a par with the average AP Calculus course given elsewhere in the country. The La Canada 97 percent pass rate implies that the instruction is considerably better than average. Note, however, that, based on the passing rate, the instruction in Detroit's Renaissance High School is roughly of the same quality.
EXTENSIONS, GENERALIZATIONS,
AND A CAVEAT
The race is not always to the swift, nor the battle to
the strong; but that's the way to lay your bets.
—Ring Lardner
The previous section ended with the educational equivalent of realpolitik. But it was not my intention to be harsh, only practical. Consider the augmented version of Table 4.3 shown as Table 4.5. The first four columns of this table show how many are at the score shown in the first column or above. The fifth column (number of classes needed) simply divides the number in column 3 by twenty (a plausible approximate size for an AP Calculus class). Thus, if the course is limited to only those whose PSAT-M score is 66 or above, only twenty-one would qualify and hence one class would suffice, whereas if open enrollment is chosen and all 1,651 students who anticipate going to college enroll, it would require eighty-three classes.14 The sixth column (number of successes per class) divides the predicted number passing at each level by the number of classes. Thus, once again, if a PSAT-M score of 66 or above is required for registration in the course, we would expect eighteen students (86 percent) in that one class to pass. But if all took it, the pass rate (the “yield”) drops to only four per class (19 percent). Last, if we assume that the annual per pupil expenditure is $6,000 and that each student takes six classes, the cost per class per student is $1,000. Using this ballpark figure allows us to estimate how much it costs for each passing score, depending on where the cut-score for taking AP Calculus is set. We see that with a cut-score at 66 the cost of each passing score is only $1,167, whereas with open enrollment it could be as high as $5,192. For purposes of generalization keep in mind that the ratio between these two figures remains the same regardless of the actual costs.
Limiting enrollment to a course based upon a student's likely success in it is hardly a radical idea, yet turning down an interested student is never a happy decision. The impact of an enrollment limitation on an affected student can be ameliorated if an attractive alternative can be provided. Once again, a reanalysis of Camara's results provides us with just such an option. Not all AP exams are equally difficult. Some are markedly easier to pass. As an example, consider the comparison between the ability-achievement functions for AP Calculus and AP Psychology shown in Figure 4.4. The best predictor for AP Psychology is PSAT-Verbal and a score of 41 on that test portends a 50 percent probability of passing the AP Psychology exam. This is almost two standard deviations lower than the score (on PSAT-Math) required for the same likelihood of success in AP Calculus.15 At present, psychology might not be a realistic choice for a school, because few faculty are prepared to teach such a course. In the long run, because psychology is so popular a major in college, one could foresee this subject entering the high school curriculum and faculty repertoire. At any rate, among the more than thirty different AP exams offered, there is likely to be something of suitable difficulty for a wide range of student and faculty abilities.16
Table 4.5
The Detroit Predictions from Table 4.3 Shown as Cumulants
and Augmented with Some Plausible Costs
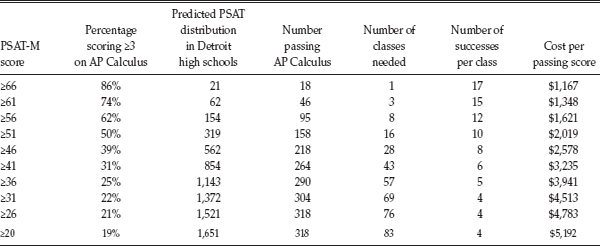

Figure 4.4. An estimate of the relationship between performance on PSAT tests and the likelihood of a score of 3 or greater on the AP calculus and the AP Psychology test. Based on a sample of about 94,000 students.
It would be straightforward to prepare a set of tables, each parallel to Table 4.5, that chronicle the expenses associated with each AP course.
Using such tables, one could balance admission rules for courses with budget limitations and student demand. This would allow school administrators to maximize student success within the existing practical constraints of available resources (e.g., money, space, teachers) and talent.
This brief financial analysis shows the cost of various kinds of policies associated with admission to AP courses. Crucial to this analysis is the ability to stratify the student population by PSAT scores. Obviously this is not the only measure that could be used for this purpose; it is merely a cheap, handy, and efficacious one.
The PSAT (or any other well-constructed ability test that can be equated to it) is a practical choice. Furthermore, it is a better predictor of AP performance than high school grades or performance in courses with the same subject matter.17 Nevertheless, other factors, such as student motivation, teacher evaluations, and grades certainly could play a role in determining who takes the AP courses. Finally, there may be intangible benefits for students who take the course and do not receive a grade of 3 or higher.18
Only hinted at here are many potential uses of the handy empirical relationship between student performance on aptitude and achievement tests. It is beyond my immediate goal to provide an encyclopedic presentation. Rather I wish to show how the evidence conveyed in this relationship can be exploited to help in understanding, and through rational management improving, educational performance.
National Projection
The film Stand and Deliver about Escalante's success became AP's “most effective promotional device. If barrio children could successfully conquer AP calculus, why couldn't everyone?”19 Of course, as Figure 4.3 shows, not everyone can conquer calculus; nevertheless, Escalante opened our eyes to possibilities that had previously been neglected. We ask the question, how far could America push the expansion of the AP program? National figures show that of the 114,318 students who took the Calculus AB or BC exams in 1997, 75,000 achieved a score of 3 or higher. However, there were 1,120,000 seniors who took the SAT, with an average math score of 511. From Figure 4.4, we would predict that 407,000 could score 3 or higher on the AP Calculus exam. American high school students have the capability of quintupling the current rate of passing the AP calculus examination.20 Thus Garfield Senior High School pointed the way, not only to higher achievement in a barrio school, but in the nation at large. That the actual number of passing scores in Garfield exceeded the predicted value is a testimony to Escalante's teaching.
Another Escalante Effect
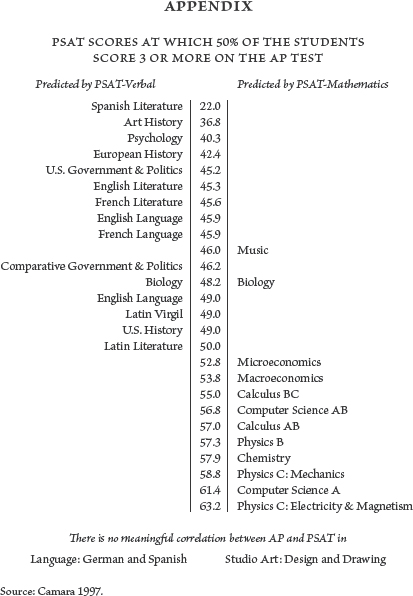
In 1997, a few nonselective high schools in Detroit offered AP calculus courses in which no student achieved a passing grade, presumably because the selective schools have skimmed off the top layer of students, so that the remaining students were unable to succeed in the AP math program. This is a less positive “Escalante effect,” which raised unrealistic expectations. It might be wiser for such schools to begin AP with a course that is more in line with the capabilities of their students and faculty. I have included a semigraphical display in the appendix to this chapter that connects PSAT level with AP course. Using such a guide might help school administrators to decide on course offerings.
A Caveat
Not all AP tests exhibit a strong relationship with the PSAT. Less related are foreign language exams; least related among these is AP Spanish. Shown in Figure 4.5 is the plot of PSAT-Verbal scores against AP Spanish Literature performance. It seems clear that those students who take the AP Spanish Literature test perform rather well, and that how well they perform has little to do with how well they perform on the PSAT-Verbal.21
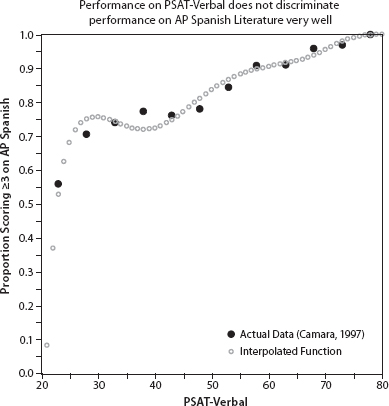
Figure 4.5. An estimate of the relationship between performance on PSAT-Verbal test and the likelihood of a score of 3 or greater on the AP spanish Language test in 1997. It shows only a very modest relationship between performance on the two tests.
Thus, happily, when this methodology does not work, it tells you. Had we used each student's Social Security number instead of the PSAT score to predict AP performance, we would have found a horizontalfunction. If one is interested in using the approach I am advocating to aid in the allocation of educational resources, we must look carefully at these connective functions. The PSAT is wonderfully useful most of the time—but not always.
Summing Up the Pieces Needed
for Measuring School Performance
To predict or understand the performance of a school as a whole on AP courses involves more than data like those in these tables in this chapter. One needs other components described in the ensuing paragraphs.
1. An explicit definition of the outcome of interest. This is obvious, but since there are at least two somewhat separate definitions in current use, I explicitly defined the success of a school or system by the proportion of students who pass the AP examinations (score at a level of 3 or higher) and not by its AP participation rate.
2. A characterization of student ability. Success on any AP examination depends heavily on the ability of the students taking it. This, in turn, depends on many factors beyond the school's control. Thus to be able to accurately characterize how well a school is doing, we must take into account the preparation of that school's students. In this chapter I have characterized that preparation by the SAT/PSAT score distribution.
3. A functional connection between success and qualifications. The fitting of a mathematical model to Wayne Camara's results allowed us to calculate the probability of success for the students in question, based on their PSAT scores.
4. A model for the selection of students into AP courses. As we illustrated, a “top down” system of student selection is the most likely model for almost all schools. Thus a school gauges its resources: the numbers of qualified teachers, of classes it can support (AP classes usually require smaller class size and extra energy and time on the part of all involved), and of able and motivated students. Then, given these numbers, the school selects its most qualified students to try to fulfill two not completely compatible goals: a high success rate and offering the course to the maximum number of students who wish it. I used a sharp truncation point here but a fuzzier decision rule could be used, although if it is, this methodology will allow us to calculate the cost of such a decision rule. Perhaps the Indian notion of “honor points” could be useful.
5. A measure of teaching and motivation. When all these factors are weighed as well as possible, there are still the intangibles of the quality of the teachers and of the students' motivation. These factors are not always apparent in the cold statistics available to us. But we can begin to gauge their effects through the use of this evidence-based methodology.
CONCLUSION
There are no miracles in education. As Hume pointed out, educational “miracles” are either the result of deception or can be understood through the framework of scientific inquiry. The high performance of Escalante's students reflected his exceptional drive and talent as a teacher, but they were not miraculous. The school climate for learning and its high level of aspiration, which has outlasted Escalante at Garfield High School, deserve credit as well.
The PSAT played a useful role in understanding and predicting performance on Advanced Placement examinations, which are also very much a function of school atmosphere, curriculum, teaching, and student guidance. If Escalante has one lesson to bequeath us, it is that tests can function as guides to future performance, and not just as barriers to exclude the less qualified. The performance of Escalante's students might have seemed miraculous based on stereotypes. But standardized tests are blind to such biases. Through the use of cheap but reliable aptitude tests like the PSAT, jewels can be discovered that might otherwise be missed. And once such promise is uncovered, some students previously thought to be unqualified can be given an opportunity and perform successfully.
In 2006 more than a million students took over two million AP exams. This represents substantial growth over the past two decades. Yet the strong PSAT-AP relationship teaches us that a major expansion of Advanced Placement achievement remains possible in this country in all types of schools: inner city, high-performing suburbs, and just garden variety schools.
On the other hand, realism forces us to accept the fact that courses that have higher test score thresholds, such as AP Calculus, Chemistry, Physics, and Computer Science, are not going to be accessible to the majority of students, especially those in minority groups. To broaden the reach of the AP program, we must seek courses that are open to a wider audience. AP Psychology, English, and History are of this genre, as are the foreign languages, whose inclusion in school curricula not only suits a larger range of student abilities but also melds well with the current “world languages” movement in education.
It is important to note that PSAT scores predict success in AP courses better than do high school grades or teacher recommendations.22 As an aid in student placement, the appendix to this chapter gives the PSAT score that yields a 50 percent probability of passing each AP exam.
Finally, the AP system is a positive influence upon which we can build improvements of our educational system. A reasonable, longrange goal for American schools is to bring up the preparatory curriculum, the teachers, and the students to the international level by increasing participation and, in the case of calculus, towards the BC examination. Rome wasn't built in a day.
As a young child John Stuart Mill complained to his father about a mathematics assignment that he had worked on unsuccessfully for an entire evening. He eventually realized that, given his mathematics knowledge at that point, there was no way he could have solved the problem. His father replied, “Unless we are asked to do the impossible we can never know the full extent of our abilities.” Errors of placement surely should be more in the direction of aiming too high than too low. But they are still errors. The judicious use of aptitude tests can help us to reduce those errors substantially.
APPENDIX
This chapter developed from W. Lichten and H. Wainer, “The Aptitude-Achievement Function: An Aid for Allocating Educational Resources, with an Advanced Placement Example,” Educational Psychology Review 12(2) (2000): 201-228.
1 National Committee on Excellence in Education 1983; Ravitch 1985; Finn 1991.
2 Carson, Huelskamp, and Woodall 1993; Bracey 1991; 1998.
3 Nieves 1999; Rosenfeld 1999; Jesus Rios et al vs. Regents of the University of California, Case C. 99-0525, U.S. District Court, Northern District of California.
4 A score of 3 on an AP exam is a criterion used by many colleges and universities to indicate performance that is good enough to justify being granted credit for that subject as a college course. In this chapter I use the Calculus AB (first semester) and Calculus BC (first and second semester) tests for a case study. Typically, of the approximately 2.6 million seniors graduating from high school in the United States, annually about 90,000 (3 percent) will pass one of these AP calculus examinations at a level of 3 or higher
5 Detroit is as segregated as any major city in the United States (Massey and Denton 1993). It has almost no immigrant school population. Its selective schools, the only ones with successful AP students, have the same racial composition as the city as a whole.
6 Mathews 1988.
7 Figure 4.1 is derived from a smallish sample of barely more than 1,000 AP examinees and exhibits some curious anomalies; nevertheless they are sufficient for the Garfield High School data. The remaining examples use the much more extensive data (n = 94,000) reported in 1997 by Wayne Camara of The College Board.
8 Estimates based on California Learning Assessment System scores.
9 Camara 1997.
10 I recognize that this bit of inference must be considered rough because of the selfselected nature of the SAT populations as contrasted with the almost total enumeration of the citywide testing. My estimate rests squarely on the assumption that for the most part the same selection process that operates nationally would op rate in Detroit in determining which 30 percent of the students in Detroit will take the PSAT. This assumption is untestable, but seems plausible enough for this application. It is important, however, not to take these estimates too literally.
11 Of course this sort of result is a chimera when one considers the selection function (figure 4.2). Based on this function, virtually no one with PSAT score lower than 50 would take the course, and so the hypothetical situation expressed here is wildly optimistic. A more plausible estimate of the number who would pass, based on current enrollment likelihoods, is closer to 30 than 300. Thus the accomplishment of Detroit's schools in producing 58 students who passed the AP Calculus test suggests either much better recruiting into AP classes than is represented by the national average, or much better instruction, or both.
12 There are twenty-three high schools in Detroit, which makes for an average of about fourteen students per school who could potentially pass the AP Calculus exam. This is hardly the critical mass for an effective AP program. Consequently, Detroit, like many city systems, relies on specialized college preparatory high schools, which admit students on application and by entrance examinations. Historically these are Cass Technical and Renaissance High Schools, with a recent upgrading of Martin Luther King High School to magnet school status. As seen in table 4.4, all three have successful AP math programs.
13 These figures are for both AP courses, Calculus AB (equivalent to a one semester college course) and Calculus BC (equivalent to a full year's course). All the students in Detroit took AB, as did most of the students at Garfield and two-thirds of the students at La Cañada. Nationally 80 percent of those taking AP Calculus elect AB.
14 Once again, this is hardly a likely outcome (in the entire United States only 1,680 students with PSAT scores below 40 took AP Calculus). My goal here is merely to show what would happen if everyone took AP Calculus.
15 This calculation assumes that the scales of the two portions of the PSAT are roughly comparable. This assumption is credible because the same people take both parts, and the same number of points on each scale relate to approximately the same number of people.
16 An interesting example of this sort of strategy is seen at Garfield High School since Escalante's retirement. Escalante opened the school's eyes to AP possibilities, and the school responded by broadening the number of AP courses offered. Consequently the decline in the number of students who passed AP Calculus is counterbalanced by the 109 (out of 112) who passed AP Spanish.
17 Camara and Millsap 1998
18 For a related discussion, see Heubert and Hauser 1999.
19 Mathews 1998.
20 Of course this again is a wildly optimistic and expensive estimate based on everyone taking AP Calculus. But it allows us to place a cost estimate on suggestions akin to those of University of Chicago scholar Benjamin Bloom about the possibilities that appear if the admission gates to courses of study are widened.
21 The famous psychologist George Miller once told me that the ability to learn a language has little to do with intelligence. To support this he pointed to Holland, where “everyone can speak English, even dumb people.” He then expanded with an evolutionary argument pointing out that in prehistory those people who couldn't understand “Look out for the tiger” rarely lived to reproduce.
22 Camara and Millsap 1998.