
5
![]()
Comparing the Incomparable
On the Importance of Big Assumptions
and Scant Evidence
In chapter 2, I alluded to the difficulty of obtaining comparable scores on two different achievement tests as part of the discussion of the recommendation to substitute achievement tests for aptitude tests in admissions decisions.1 The details of equating two such tests, while important for the conclusions drawn in chapter 2, would have gotten in the way of the narrative flow. While postponing such an elaboration is acceptable, omitting it entirely is not. Now is the time.
Making fair comparisons among groups of individuals who were administered different forms of a test is a task that ranges in difficulty from easy to impossible. The more overlap there is in content between the test forms the easier the task. When they overlap completely, comparisons are straightforward; when they are completely disjoint, comparisons may be impossible. In this chapter we will focus principally on this latter situation.
Let us begin this discussion with a common situation faced in mental testing when there are two different forms of a test being administered to two different groups of students. Such a situation might exist on two separate administrations of the SAT or the GRE; some people take it in December, some in January. Admissions officers will want scores to be comparable, but for obvious security reasons the same test items cannot be used. How can we solve this problem? We can best understand both the problem and various proposed solutions if we examine a sequence of schematic representations.
Figure 5.1 depicts the situation in which two groups are both given exactly the same test items (shading indicates that that item was given to that group). Comparisons between the groups are easy to make because the groups share a common test. If the mean score in Group I is 60 percent correct and the mean score in Group II is 30 percent, we can infer that Group I has demonstrated higher proficiency than Group II.
But let us suppose (see Figure 5.2) that both groups don't get exactly the same test. Suppose we add one additional item (item n +1) that we give to Group I but not to Group II. Simultaneously we remove item 1 from Group I's test. Both Groups still take an n-item test. Once again we can make comparisons between Groups I and II, but we cannot be quite so sure of our conclusions.
If item 1 is much easier than item n + 1, Group I is at a slight disadvantage. Can we tell if this is the case? What evidence can we examine that would shed light on this possibility? If we see that examinees in Group I do much better than those in Group II on items 2 through n (what we shall call the anchor items), yet they do worse on item n + 1 than Group II does on item 1, we might infer that item 1 is easier than

Figure 5.1. Graphical depiction of a test design in which two groups of examinees take the same form of a test
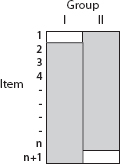
Figure 5.2. Graphical depiction of a test design in which two groups of examinees take the same form of a test except for two items
item n + 1. How much easier will depend on exactly how much the performance of the two groups differs on the anchor items and on the unique items. One way to estimate this is to build a model (from Group I) that predicts performance on item n + 1 from the anchor items, and then use that model to predict what proportion of Group II would get item n + 1 correct. Obviously we are assuming that a prediction model devised from one group is valid in the other. We can gather evidence supporting this assumption by building similar models within Group I that predict say, item 2 from items 3 through n, and then trying them on Group II. Since we have observed what Group II's performance on item 2 actually was, we can compare the prediction to the reality and measure the accuracy of the model. We can repeat this for all items in the anchor and summarize the accuracy thus obtained. We might also do the reverse (predict from Group II to Group I) and see how that goes. When we are all done we might choose an average prediction model from all of those developed. Such a model could be used to equate the two different forms of the test.
An equated test score is subjunctive; it is the score that you would have gotten had you taken a different form of the test. Whenever equating is done, there are untestable assumptions. In this instance the key assumption is that the equating model developed on the anchor test with one group will work with the other group. When the anchor test is very long with respect to that portion of the test that is unique for each group, such an assumption is weak since even a substantial violation does not yield a large effect on the estimate of the score—in the example discussed here the maximum error can only be one item.
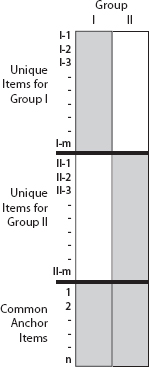
Figure 5.3. Graphical depiction of a test design in which two groups of examinees take different forms of a test with a common n-item anchor test
But having an anchor of n – 1 items on an n-item test is not the common situation.
Different test forms are typically employed when two groups of students are taking a test at different times and test security is an issue. In this situation there is usually a small fraction of the test that is identical for the two groups, and it is used as the equating anchor, but most of each form is unique. Such a situation is schematically depicted in Figure 5.3. If n is considerably smaller than m, it is clear that the size of the untestable assumption about the performance of Group II on items I-1 through I-m becomes greater. Of course there are a number of things that can be done during test construction that can make this assumption more credible. One is to choose all items for each form randomly. If this is done, there is no reason to believe that there is any consistent difference between the two forms. A second thing that can be done is to choose the examinees that make up the two groups randomly.2 If this is done we can be reasonably confident that the performance predicted within one group would also hold within the other.
How small can the equating anchor (n) be and still allow the different test forms to be adequately equated? On large operational tests, items are not chosen at random to build forms, but they are typically chosen to fulfill tightly constrained content and psychometric specifications. Thus it is common for n to be relatively small; for the SAT it is typically about 20 percent of the total test length (about 16-20 items on each of the two parts). It is important for the anchor section to be as small as possible commensurate with accurate equating, since it is the part of the test that will be repeated in subsequent administrations and hence at risk for security problems. But 20 percent (and at least 15-20 items) is generally considered as small as is acceptable. Because of its susceptibility to theft, the equating section is not used directly for computing an examinee's score. Also, because it is just used for equating (i.e., it is only used for aggregate purposes), its value is relatively unaffected by minor breaches in security.
But if the anchor section is shorter still, are there any methods that can yield acceptable equating? In some situations an equating section of zero length is used. Such a design is shown in Figure 5.4. Can we equate when there is no anchor at all? When there are no data, we are forced to use powerful but untestable assumptions. For example, a design like that shown in Figure 5.4 is used when a test is translated into another language. Group I might be examinees who take a test in English and Group II might be those who take it in Spanish. The items are, in some sense, the same for the two forms, except they have been translated; item I-1 is the English translation of II-1. Are items in translation likely to be of equal difficulty? How can we know? Obviously, knowing someone's score on one form tells us little about how the examinee would do on the other, so the term equating is surely a misnomer. What we hope to do is match the scales of the two forms so that the same score implies the same amount of mastery.
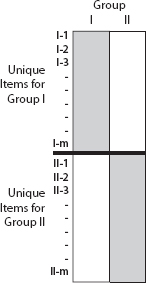
Figure 5.4. Graphical depiction of a test design in which two groups of examinees take different forms of a test with no common items
Moreover, the sort of procedure depicted in Figure 5.4, relying as it does on assumptions rather than data, is sufficiently far from statistical, data-based equating, that we ought to use another word to describe it. The term co-scaling, denoting the placement of two tests onto the same numerical scale, but making no promises about the validity of inferences that compare one group's performance with the other's, is probably not a bad choice.
If the test items are on the same scale, then a plot of the difficulties of each item, say English versus Spanish, ought to be a straight line. But this is a necessary condition, not a sufficient one. If each item gets a fixed amount more difficult when it is translated, the two sets of difficulties will still be a diagonal line, but there is a constant effect of translation. Such an effect is inseparable from what would be observed if one group was lower in overall proficiency. By analogy, if a set of hurdles at a track meet were 10, 15, 20, 25, 30, and 35 inches tall, we would expect that the ease with which they could be jumped would be in the same order. But if they were “translated” to another set that were 10, 15, 20, 25, 30, and 35 centimeters tall (for use in Europe, say) we would expect that performance on them would fall in the same order. But there would be a higher proportion of success at each of the metric heights. We could interpret this as meaning that the Europeans were better hurdlers (and be wrong), or that the “translation” made them easier. Unless we had some athletes who participated in both track meets, there is nothing in the response data that would inform us of which was the correct interpretation. Of course this is not strictly analogous to the language translation situation since in the latter we can never assume that anyone could compete equally well on both forms.
Is co-scaling test forms without data actually done? Yes, in many situations, although which untestable assumption is made depends upon what is the purpose of the test. For example, the Educational Testing Service has a Spanish version of the SAT called the Prueba de Aptitud Academica (PAA). These two tests are placed on the same scale by assuming that the items are of the same difficulty in either language, and hence that any consistent differences observed in performance are due to differences in the abilities of the two examinee groups. Thus in 1988 when ETS researchers Bill Angoff and Linda Cook used this assumption to co-scale the PAA to the SAT, they decided that the differences they observed in performance were not due to the effect of translation on the difficulty of the items but rather that the two examinee populations were about one and a half standard deviations apart.3
The Canadian military, when it faced a similar problem, opted for a different untestable assumption to resolve it. Specifically, the entrance/ placement test for those who want to enlist in the Canadian Military (the Canadian Forces Classification Battery; the CFCB) is offered in both English and French. Because there are comparisons that must be made among candidates who have taken different forms of this test, they must be placed on the same scale. But Canadian authorities have chosen to assume that the ability distributions of the two linguistic groups (Anglophones and Francophones) are the same.4 Thus any differences in performance that are observed are interpreted to be due to the effects of translation. What this assumption comes down to in practice is that there are separate qualifying scores used for each form.
The two strategies adopted by ETS with the co-scaling of SAT and the PAA, and the Canadian military with the two linguistic forms of the CFCB, represent the two poles of what is possible. There are valid arguments supporting each position, but probably the truth lies somewhere in between in both situations. But without the possibility of gathering ancillary evidence how are we to decide how best to do it? And what sorts of ancillary evidence might there be?
Making valid comparisons without formal linkages is not impossible, but usually only if the two entities being compared are far apart. For example, in 1998 Princeton High School's football team was undefeated (they got all of the items right), whereas the Philadelphia Eagles won only three of their sixteen games (they only got 19 percent “right”). The two teams had no common opponents to allow an empirical comparison, yet is there any doubt about the outcome if they were to play one another? Theory can sometimes be quite convincing.
Are there any intermediate paths that can be taken to untie this Gordian knot? Obviously we could administer some of the items from each form to the other group, but that would tell us nothing if the traits being tested have little to do with the other language—how much do we learn about your knowledge of biology if we ask you questions on mitosis in a language you don't speak? But suppose we could find some group of examinees who speak both languages. One such design is represented in Figure 5.5; Group III is the bilingual group. Such a design allows us to place all of the items on a single scale, but will it be the same scale as would have obtained for the other groups? That depends on how similar the performance of Group III is to the other two groups. Typically bilinguals are not like monolinguals in many important ways, but still it does provide some evidence.5
Another alternative might be to make up some nonlinguistic items that could be administered to everyone and hence serve as an anchor, but would the relationship between that anchor and the rest of the test be strong enough to allow the kinds of inferences needed? Such an approach can give some help, but usually not enough for serious purposes. Indeed, if a nonlinguistic test allows us to adequately connect two linguistic forms, why do we need the latter?
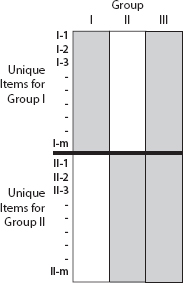
Figure 5.5. Graphical depiction of a test design in which two groups of examinees take different forms of a test with no common items, but a third group takes both forms.
The usual method for placing two tests onto a common scale involves the idea of random assignment of either items to tests or examinees to groups. We do this because with random assignment of items to test forms we have strong a priori evidence to believe that the tests thus formed are of equal difficulty (the SAT-PAA model). With random assignment of examinees to groups we have strong a priori evidence to believe that the two groups' abilities are the same (the Canadian military model). But the further away the assignment rule is from random the weaker is the evidence. In the current problem anything approaching random assignment is impossible. Are there any other alternatives that might be explored?
An intermediate path was explored by Israel's National Institute for Testing and Evaluation (NITE).6 NITE produces a test called the Psychometric Entrance Test (PET) that is an important component in admissions decisions to Israeli universities. The PET is offered in many languages including (but not limited to) Hebrew, Arabic, English, Russian, Spanish, and French. Scores are compared across these various translations. The NITE staff is convinced that the Canadian assumptionis untenable; the population of examinees who take the test in Russian is very different from those who take it in Arabic, for example. But NITE also believes that the ETS assumption (that there is no difference in scores due to translation) is also not correct. But they do have ancillary evidence that is directly related to the key latent dimensions of the test—the performance of some of the examinees in college. Thus the Israeli situation can be represented as in Figure 5.6. Of course this doesn't completely solve the problem since there are nonrandomly missing data; how would students who didn't attend college have done? Moreover, students take different courses in college and so their grades represent a nonuniform scoring system. Yet it is something, and it allows a check on what otherwise would be entirely untestable assumptions to place the various linguistic forms of the PET onto a common scale.
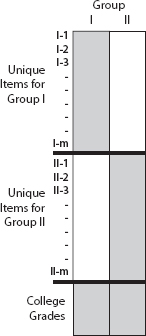
Figure 5.6. Graphical depiction of a test design in which two groups of examinees take different forms of a test with no common items with a common ancillary measure that may be used as an anchor test.
NITE uses the criterion data, college grades, to test assumptions about the effects of translation on item difficulty. Initially they used the ETS assumption that item I-1 has the same difficulty as item II-1, I-2 is the same as II-2, and so on. But when they found that one group's superior performance on their version of the PET did not yield analogous superior performance in college grades, they questioned the validity of that assumption. The result of that questioning was a further adjustment of the PET scores that used the college grades as an equating anchor.
When considering the technical details associated with this approach to equating, one arrives, almost by surprise, at an innovative method for test scoring. My colleague Charles Lewis has named it validity-based scoring (VBS). The key idea is to use the pattern of responses on the test to predict what the examinee's performance would be on the validity criterion of interest, and that predicted value becomes the examinee's score on the test. Each form of the test might have its own prediction equation, but all examinees would then have a score on the same scale. This has a number of remarkable benefits. Four of them are the following:
1. You cannot score a test without gathering validity data.
2. Examinees' scores vary depending on the prospective use of the tests.
3. If a test is being used for an invalid purpose all examinees will have the same score.
4. Different forms are automatically placed on the same scale (the scale of the criterion).
This brings me to the point of this chapter. Placing the scores of two tests that are given to two disparate groups onto a common scale requires an untestable assumption: perhaps an assumption about their relative mean abilities, perhaps about the relative difficulties of the items, perhaps a mixture of both. There are no statistical methods that can come to the rescue. In the case of test forms translated into different languages, we can try to make the untestable assumption as plausible as possible through care in translation and form preparation. In the SAT-PAA situation, half the items originated in Spanish and were translated into English; the other half were prepared in the reverse order. Care was taken to assure that the item difficulties were in the same order on both forms. Such care reduces the possibility of certain kinds of biases, but does not eliminate them. Remember my earlier example of hurdles in centimeters and inches. Following the same preparation rules would not affect the overall bias; indeed a plot of the item difficulties of one form against those of the other would show that the items lined up perfectly.
There are many statistical schemes that purport to allow us to co-scale two tests administered on different populations7 but hidden away in all of them is one of the two untestable assumptions we have described here; either characterizing the structure of the item difficulties across populations (usually equal) or the populations' abilities. Without additional data there is no alternative to such untestable assumptions.
Of course which assumption is made is determined by the inferences we wish to make from the test. For example if we wish to compare the abilities of two populations (e.g., Spanish vs. English in the SAT/PAA situation) we must assume that the items maintain their same difficulty. If instead, we assume that all differences in performance are due to the effects of translation, the point of our investigation is mooted. Thus we infer that the principal purpose of the Canadian military testing program is to make comparisons within language groups; for surely between-group comparisons are strongly affected by the identifying assumption of equality.
The Israeli college admissions program provides one example of a situation in which there is a need for between-group comparisons and there are ancillary data to aid in making them. I suspect that this is always likely to be the case—if there are no ancillary data, there probably is no need to place them on a common scale.
How plausible are these two different kinds of identifying assumptions? The idea that the difficulty of a carefully translated item does not change radically is a compelling one, especially compelling if you must make cross group comparisons. But how likely is it? For some subjects that are, in their essence, nonverbal (e.g., mathematics) such an assumption may not be far-fetched. But for items whose essence is verbal it would seem unlikely. Michal Beller and her colleagues at NITE8 provide an extended discussion of this issue. They give a compelling example of the problem within the testing of analytical reasoning:
In an attempt to preserve the precise structure of the original logic items in the translated version (for example, preserving negatives, double negatives, conjunctions such as “only,” “also” etc.), it is sometimes necessary to change the structure so that the syntax of the target language will be correct. For example, the syntax of the Hebrew structure “all p's are not q” is ambiguous in English. Thus, a statement in Hebrew such as: All birds of prey are not green (meaning that there is not even one bird of prey that is green) cannot be directly translated into English. In order to preserve the exact Hebrew meaning the structure of the English sentence has to be changed as follows: No birds of prey are green. A similar difficulty arises when this sentence has to be translated into French. In French, “all” cannot be followed by a negative. Therefore, the translation has to be: Aucun oiseau predat n'est vert.
The complexity of decoding the Hebrew version “All birds of prey are not green” surely seems greater than that required for the English version “No birds of prey are green.” What are the limits of accuracy of inferences made under the assumption that they are of equal difficulty?
There is no surefire solution to the problem of making comparisons among groups in which there are no common elements. All solutions must include at least one untestable assumption. However, we can make an advance if we formalize the estimation problem within the context of a mathematical model of appropriate form and complexity. Recent advances in estimation methods have made practical embedding complex models into a fully Bayesian framework. This approach has yielded fruit in many and varied situations.9 Such modeling cannot work miracles, but it can provide us with three important benefits:
1. By embedding the problem within the context of a formal statistical model we must be explicit about our assumptions.
2. Through the use of sensitivity studies we can assess the stability of our inferences to various levels of violation of the assumptions.
3. Through the appropriate inclusion of parameters for ancillary information in the model, we can optimally weight any such information that might become available. It will also allow us to determine the value of such information that might become available.10
Now that the foundation has been laid, we can return to the problem that motivated this discussion, substituting achievement tests or aptitude tests for college admission. The model shown in Figure 5.3 is the one currently used for co-scaling two different science achievement tests (say physics and chemistry). The common link is the SAT-Math. We have seen in chapter 4 how well math aptitude, as measured by the SAT or the PSAT, can predict achievement scores for the various sciences, and so placing such tests on a common scale with this kind of common link is credible. It still faces some logical issues, but this is a plausible solution to a very difficult problem. But if the SAT is no longer required, this link disappears.
Thus the irony is that using such achievement test scores for admission is only possible if the aptitude test is also required, but if it is not, the value of the achievement tests for this purpose disappears with it.
In the same way the SAT-Verbal test is used as an anchor for coscaling achievement tests in the humanities and the social sciences. It works passably for some areas (e.g., History and English) but not others (e.g., Spanish).
But there remains no credible way to make comparisons among applicants who present achievement test scores in different foreign languages. And, of course, we still cannot resolve the issues dealing with comparisons between a science score and one in the humanities. There is no common link that will help us answer the motivating question “Was Mozart a better composer than Einstein was a physicist?”
AN OBITER DICTUM
It is generally considered good practice that, when we are faced with a situation in which our inferences rely heavily on untestable assumptions, we proceed very cautiously indeed. Ancillary evidence takes on much greater importance in these situations than it does when assumptions can be tested directly. The sorts of ancillary evidence I refer to may be logical or empirical. One example of the latter are the college performance data that are used to fine-tune the calibration of Israel's PET. This is surely the case for groups that are separated by language and culture, but let us think a little more broadly.
Suppose we have a design like that shown in Figure 5.6 and have made the assumption that an item maintains the same difficulty when it is given to different groups. Few would disagree that we ought to question the assumption of homogeneous difficulty if we find consistent differences in performance on the criterion (college grades) that are not matched by differences in performance on the different forms of the entrance test. Now let us suppose that Group I consists of males and Group II consists of females. Tests are never equated by sex. Clearly there is no design that would allow such an equating except through a common criterion. Yet when we use college grades as a common criterion11 we find the same kinds of consistent differences that led the Israelis to adjust PET scores. Of course there are other possible explanations (e.g., college grades reflect abilities unmeasured by college entrance test scores), but it seems disingenuous to dismiss one of the possible explanations, where if the groups were defined differently (e.g., by language or ethnicity) it would be the first assumption questioned.
Note that the adoption of the Canadian military model, which resolves the lack of identifiability by assuming identical ability distributions, would yield different cut-scores by sex. Such an approach, as justifiable statistically as the current approach, would eliminate in a stroke all sex differences in the awarding of scholarships by test score. Using validity-based scoring would also help, although it may take some doing to gain agreement on suitable criteria. Current legal restrictions limit what can be done in this regard, but perhaps laws and regulations can be changed if sufficient evidence can be provided.
Of course one can sensibly argue that the physical and cultural differences that characterize men and women are not analogous to the differences that characterize different language groups. But the seriousness of the test's consequences as well as the reliability of the ancillary validity information suggests that we ought to consider explicitly the unstated assumptions about the equivalence of test forms under such circumstances. Indeed, one goal of this chapter is to instigate broader thinking about the inferences we draw from test data by making explicit some of the assumptions that often underlie those inferences.
This chapter developed from H. Wainer, “Comparing the Incomparable: An Essay on the Importance of Big Assumptions and Scant Evidence,” Educational Measurement: Issues and Practice 18 (1999): 10-16.
1 The work in this chapter was supported by the research allocation from the Educational Testing Service to the Research Statistics Group. I continue to be grateful for the opportunities that this support provides to just think. My thanks to Avi Allalouf and Stephen Sireci for encouraging comments on an earlier draft, and to Paul Holland for providing a context that helps clear thinking in this arena.
2 This is the situation that gives validity to such procedures as equipercentile equating.
3 ETS is not alone in adopting this strategy for making cross-cultural comparisons. The same assumption is made whenever the goal of an assessment is the comparison of two disparate groups (what is the alternative?). All international assessments do this (see, for example, Salganik et al. 1993).
4A personal communication from Commander F. T. Wilson of the Canadian Forces Personnel Applied Research Unit, March 9, 1990.
5 See Sireci 1997 for further discussion of this methodology.
6 Beller, Gafni, and Hanani 2005.
7 Angoff 1972; Angoff and Modu 1973; Angoff and Cook 1988; Hambleton 1993; Poortinga and van de Vijver 1991; Sireci, Bastari, and Allalouf 1998; van de Vijver and Poortinga 1997.
8 Beller, Gafni, and Hanani 2005.
9 See Gelman et al. 1995, for a thorough description of such methods and Bradlow, Wainer, and Wang 1999 for an example of how such models can be applied within the context of modern test theory.
10 The sorts of information I envisage here would be criterion data as in the Israeli example, or results obtained from bilinguals, of both kinds, who take both forms of the test.
This is the wrong forum for the development of such a model, for my goal in writing this chapter was to explicate the character of the problem. But a reasonable way to think about the model is to imagine that the variation in performance between two groups is a variance that can be decomposed into two components. One component is the difference between the means of the two ability distributions, and the other is the difference in the item difficulties due to the effects of translation. The untestable assumption provides weights for these two components. The ETS/PAA solution uses weights of 1 and 0; the Canadian solution uses weights of 0 and 1. It is more likely (depending on test and examinee groups) that less extreme values are correct. Ancillary information must be used to estimate such weights.
11 In math see Wainer and Steinberg 1992.