8
![]()
A Little Ignorance Is a Dangerous Thing
How Statistics Rescued a Damsel in Distress
A little ignorance is a dangerous thing.
—apologies to Alexander Pope
Since the passage of the No Child Left Behind Act the role of standardized test scores in contemporary education has grown. Students have been tested, and teachers, schools, districts, and states have been judged by the outcome. The pressure to get high scores has increased, and concern about cheating has increased apace. School officials desperately want high scores, but simultaneously do not want even the appearance of any malfeasance. Thus, after sixteen of the twenty-five students in Jenny Jones's third-grade class at the Squire Allworthy Elementary School obtained perfect scores on the state's math test, it was not entirely a surprise that a preliminary investigation took place. The concern of the principal arose because only about 2 percent of all third-graders in the state had perfect scores, and so this result, as welcome as it was, seemed so unlikely that it was bound to attract unwanted attention.
The investigation began with a discussion between the principal and Ms. Jones, in which Ms. Jones explained that she followed all of the rules specified by Ms. Blifil, a teacher designated by the principal as the administrator of the exam. One of the rules that Ms. Blifil sent to teachers giving the exam was “point and look”: The proctor of the exam was instructed to stroll around the class during the administration of the exam, and if she saw a student doing something incorrectly, she should point to that item and look at the student. Ms. Jones did not proctor the exam, for she was occupied with administering it individually to a student in special education, but she instructed an aide on how to serve as proctor.
“Point and look” seemed to be forbidden by the state's rules for test administration, for page 11 of the administrators' manual says,
Be sure students understand the directions and how to mark answers. Assist them with test-taking mechanics, but be careful not to inadvertently give hints or clues that indicate the answer or help eliminate answer choices.
That pretty much disqualifies “point and look.”
The school's investigation found what they believed to be the cause of the high scores earned by Ms. Jones's class. To cement this conclusion the school administration brought in an expert, a Dr. Thwackum, to confirm that indeed the obtained test results were too good to be true. Dr. Thwackum was a young PhD who had studied measurement in graduate school. He was asked if the results obtained on the math exam were sufficiently unlikely to justify concluding that students had been inappropriately aided by the exam proctor. Dr. Thwackum billed the district for ninety minutes of his time and concluded that indeed such a result was so unlikely that it was not plausible that the test had been administered fairly.
Ms. Jones was disciplined, suspended without pay for a month, and given an “unsatisfactory” rating. Her pay increment for the year was eliminated, and her service for the year did not count toward her seniority. Through her union she filed an appeal.
The union hired statisticians to look into the matter more carefully. This chapter is a description of what the statisticians found.
NO HARM, NO FOUL; OR, THE BURDEN
OF PROOF LIES UPON HIM WHO AFFIRMS,
NOT UPON HIM WHO DENIES1
“No harm, no foul” and the presumption of innocence help constitute the foundations upon which the great institutions of basketball and justice, respectively, rest. The adjudication of Ms. Jones's appeal relied heavily on both principles. Ms. Jones admitted to instructing the exam proctor about the “point and look” rule—her culpability on this point is not in dispute. However, she was not disciplined for incorrectly instructing the proctor; rather she was disciplined for the alleged effect of the proctor's behavior. This distinction places a much greater burden on the school because it must show that the “point and look” intervention not only took place but that it had an effect. That is, the school must demonstrate that Ms. Jones's rule violation (foul) unfairly improved her students' scores (harm). Failure to show such an effect exculpates her.
Further, here the burden of proof lies on the accuser, not the accused. That is, Ms. Jones is presumed innocent unless the school can prove otherwise. Moreover, the scarcity of high-y, student-level data made proving that the effect of “point and look” could not be zero much more challenging than proving that it could have been.
The subsequent investigation had two parts. The first was to show that it is believable that the cause (the “point and look” rule) had no effect, and the second and larger part was to estimate the size of the alleged effect (the improvement in performance attributable to this cause) or—as we shall discuss—show that the size of the effect could have been zero.
The Cause
Because the principle of “No harm, no foul” makes the effect—not the cause—of primary concern, our interest in the cause is limited to showing that it is plausible that the aide's behavior had no effect on children's scores. This is not difficult to imagine if it is recalled that Ms. Jones's third-grade class was populated with eight-year-olds. Getting them to sit still and concentrate on a lengthy exam is roughly akin to herding parakeets. In addition there were more than ten forms of the test that were handed out at random to the class so that the aide, in looking down on any specific exam at random was unlikely to be seeing the same question that she saw previously. So what was the kind of event that is likely to have led to her “pointing and looking”? She might have pointed to a question that had been inadvertently omitted, or perhaps suggested that a student should take the pencil out of his nose or stop hitting the student just in front of him.
The developers of the test surely had such activities in mind when they wrote the test manual, for on page 8 of the instructions they said,
Remind students who finish early to check their work in that section of the test for completeness and accuracy and to attempt to answer every question.
So indeed it is quite plausible that the aide's activities were benign and had little or no effect on test scores. Given this possibility, both the prosecution and the defendants sought to measure the alleged effect: Dr. Thwackum seeking to show that the effect could not have been zero, while the statisticians tried to show that the effect could have been zero. Of course, this was an observational study, not an experiment. We don't know the counterfactual result of how the children would have done had the aide behaved differently. And so the analysis must use external information, untestable assumptions, and the other tools of observational studies.
The Effect
First, we must try to understand how Dr. Thwackum so quickly arrived at his decisive conclusion. Had he been more naive, he might have computed the probability of sixteen out of twenty-five perfect scores based on the statewide result of 2 percent perfect scores. But he knew that that would have assumed that all students were equally likely to get a perfect score. He must have known that this was an incorrect assumption and that he needed to condition on some information that would allow him to distinguish among students. It is well established that all valid tests of mental ability are related to one another. For example, the verbal and mathematical portions of the SAT correlate 0.7 with each other; about the same as the correlation between the heights of parents and children.
Happily, Dr. Thwackum had, close at hand, the results of a reading test used by the state (with the unlikely name of DIBELS) for the students who were in Ms. Jones's class. He built a model using the DIBELS score to predict the math score from an independent sample and found, using this model with the DIBELS scores as the independent variable, that it predicted not a single perfect score on the math test for any of the students in Ms. Jones's class. As far as Dr. Thwackum was concerned that sealed the case against the unfortunate Ms. Jones.
But, it turned out that, aside from being immediately available, DIBELS has little going for it. It is a very short and narrowly focused test that uses one-minute reading passages scored in a rudimentary fashion. It can be reliably scored but it has little generality of inference. An influential study of its validity concluded that “DIBELS mis-predicts reading performance on other assessments much of the time, and at best is a measure of who reads quickly without regard to whether the reader comprehends what is read.”2 And, more to the point of this investigation, when Dr. Thwackum used DIBELS to predict math scores, the correlation between the two was approximately 0.4. Thus it wasn't surprising that the predicted math scores were shrunken toward the overall average score and no perfect scores were portended.
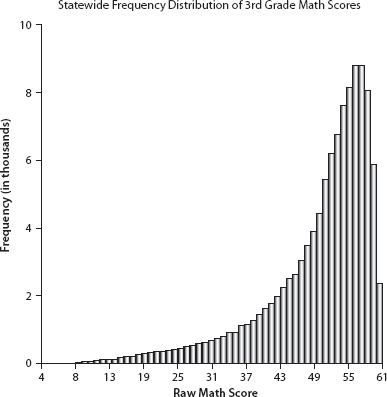
Is there a more informative way to study this? First we must reconcile ourselves to the reality that additional data are limited. What were available were the reading and math scaled scores for all the students in the school district containing Squire Allworthy School and some state- and countywide summary data. Failure to accommodate the limitations of these data may produce a desirable result but not one that bears scrutiny (as Dr. Thwackum discovered). We can begin by noting that the third-grade math test has no top; hence it discriminates badly at the high end. This is akin to measuring height with a ruler that only extends to six feet. It works perfectly well for a large portion of the population, but it groups together all individuals whose heights exceed its upper limit.
This result is obvious in the frequency distribution of raw scores in Figure 8.1. Had the test been constructed to discriminate among more proficient students, the right side of the distribution would resemble the left side, yielding the familiar symmetric bell-shaped curve.
Although only 2 percent of all third-graders statewide had perfect scores of 61 on the test, about 22 percent had scores 58 or greater. There is only a very small difference in performance between perfect and very good. In fact, more than half the children (54 percent) taking this test scored 53 or greater. Thus the test does not distinguish very well among the best students—few would conclude that a third-grader who gets 58 right out of 61 on a math test is demonstrably worse than one who got 61 right. And no one knowledgeable about the psychometric variability of tests would claim that such a score difference was reliable enough to replicate in repeated testing.
But figure 8.1 is for the entire state. What about this particular county? What about Squire Allworthy Elementary School? To answer this we can compare the county-level, school-level, and classroom-level results with the state using the summary data available to us. One such summary for reading—which is not in dispute—is shown in table 8.1.
From this we see that the county does much better than the state as a whole, the district does better than the county, Squire Allworthy does better still with fully 93 percent of its students being classified as Advanced or Proficient, and Ms. Jones's students perform best, with all examinees scoring at the Proficient or Advanced level in reading. Clearly, Ms. Jones's students are in elite company, performing at a very high level compared to other third-graders in the state. Let us add that within district, reading and math scores correlated positively and reasonably strongly
TABLE 8.1
Third-Grade Reading 2006: Performance Levels

If we build a model using reading to predict math, we find the regression effect makes it impossible to predict a perfect math score—even from a perfect reading score. In part, this is due to the ceiling effect we discussed previously (the prediction model fails to account for the artificially homogeneous scores at the upper end of the scale) and in part it's due to the modest relationship between reading and math scores. Thus, when Dr. Thwackum used this approach, with an even poorer predictor, DIBELS scores, it came as no surprise that Ms. Jones's students' performance seemed implausible.
Observations
Dr. Thwackum's strategy was not suitable for these data because it must, perforce underpredict high performers. An even simpler approach, which circumvents this problem, is to look only at examinees with perfect math scores. In addition to Ms. Jones's sixteen students with perfect scores, there were twenty-three non-Jones students with perfect math scores within the Squire Allworthy School's district. We can compare reading scores for Ms. Jones's students with those for non-Jones students. There are three possible outcomes here: (1) Ms. Jones's students do better than non-Jones students, (2) all students perform the same, or (3) Ms. Jones's students do worse than non-Jones students. We observed above that there was a modestly strong positive relationship between reading and math proficiency. For this subset of perfect math performers, there is no variability among scores, so no relationship between reading and math can be observed. Nevertheless, failure to observe any relationship can be plausibly attributed to the ceiling effect discussed above rather than a true absence of relationship between reading and math proficiency. So we could reasonably suggest that if Ms. Jones's perfect performers were unfairly aided, their reading scores should be lower on average than non-Jones perfect performers. That is, if option (3) (Ms. Jones's students do worse than non-Jones students) is shown to be true, it could be used as evidence in support of the school district's case against Ms. Jones. However, if Ms. Jones's students do as well or better than non-Jones students—options (1) and (2) above—or if we lack the power to identify any differences, we must conclude that the effect could have been zero, at least based on this analysis.
Typically, if we wanted to compare reading score means for Ms. Jones's sixteen students and the districts' twenty-three students with perfect math scores, we would make some distributional assumptions and perform a statistical test. However, even that is not necessary here because Ms. Jones's students' reading mean is higher than the districts' students' mean. The districts' twenty-three students with perfect math scores had a mean reading score of 1549, whereas the sixteen students in Ms. Jones's class with perfect math scores had a mean reading score of 1650.3
The box plots in Figure 8.2 compare the distribution of reading scores for two groups of students with perfect math scores. This plot follows common convention, with the box containing the middle 50 percent of the data and the cross line representing the median. The dotted vertical lines depict the upper and lower quarters of the data. The two small circles represent two unusual points.
We can see that Ms. Jones's students' reading scores are not below the reference group's (as would be expected had her intervention produced the alleged effect). On the contrary: her sixteen perfect math students did noticeably better on reading than non-Jones students who earned perfect math scores. This suggests that Ms. Jones's students' perfect math scores are not inconsistent with their reading scores. And, in fact, if the math test had a higher top, her students would be expected to do better still.
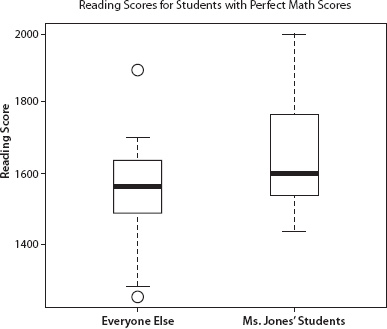
Figure 8.2. Reading scores for students with perfect math scores
Thus based on the data we have available we cannot reject the hypothesis that Ms. Jones's students came by their scores honestly, for there is no empirical evidence that Ms. Jones's intervention produced an effect of any kind: her students' scores appear no less legitimate than those of students from other classes in the district.
The Outcome
On December 5, 2008, there was an arbitration hearing to decide the outcome of Ms. Jones's appeal. Faced with these results the representatives of the district decided to settle a few minutes in advance of the hearing. Ms. Jones's pay and seniority were restored and her “unsatisfactory” rating was replaced with one better suited to an exemplary teacher whose students perform at the highest levels.
Ms. Blifil was relieved of further responsibility in the oversight of standardized exams and the practice of “point and look” was retired.
The statisticians who did these analyses were rewarded with Ms. Jones's gratitude, the knowledge that they helped rectify a grievous wrong, and a modest honorarium.
Hopefully, Dr. Thwackum learned that a little ignorance is a dangerous thing.
This chapter developed from P. Baldwin and H. Wainer, “A Little Ignorance: How Statistics Rescued a Damsel in Distress,” Chance, 22(3) (2009): 51-55.
1 Ei incumbit probatio qui dicit, non qui negat.
2 Pressley, Hilden, and Shankland 2002.
3 For those assiduous and technically skilled readers who wish to do their own statistical test, the standard errors were 30 and 41 for the district's students and Ms. Jones's students respectively.