1
![]()
On the Value of Entrance Exams
What Happens When the SAT Is Made Optional?
On my shelf is a well-used copy of James Thurber's (1939) Fables for Our Time. In it is the fable of “The Glass in the Field.” It seems that a builder had “left a huge square of plate glass standing upright in a field one day.” Flying at high speed, a goldfinch struck the glass and later told a seagull, a hawk, an eagle, and a swallow about his injuries caused by the crystallized air. The gull, the hawk, and the eagle laughed and bet the goldfinch a dozen worms that they could fly the same route without encountering crystallized air, but the swallow declined to bet and was alone in escaping injury. Thurber's moral: “He who hesitates is sometimes saved.” The point of this message is unhappily familiar to those who bought Edsels, Betamax video recorders, and, more recently, Hummers and Lehman Brothers stock.
Over the past two decades there has been extensive debate over the value that such admissions tests as the SAT and the ACT offer in improving the quality of college admissions decisions. This discussion has intensified with a recent announcement by William R. Fitzsimmons, the dean of admissions and financial aid at Harvard, as well as the chair of NACAC's Commission on Admissions.1 The key recommendation was summed up in the New York Times' headline, which blared, “College Panel Urges Shift Away From SATs.”
The commission's other conclusions were all related to the use and misuse of the well-known college admissions examinations, the SAT and ACT. It believed that colleges and universities ought to reconsider requiring these exams from their applicants. The commission concluded that for many schools such testing did more harm than good. It is at this moment that I join Thurber in pointing out that there is safety in caution. Before any decision of this magnitude is made, it is worthwhile to consider the consequences of such an action.
I feel about empirical evidence what Satchel Paige once said about money: It may not buy happiness, but it sure does steady the nerves. Fortunately for those who agree with my sentiments, there is evidence that can be examined about the consequences of eliminating the SAT. Let us begin such an examination with Bowdoin College.
Bowdoin College is a small, selective, liberal arts college located in Brunswick, Maine. Bowdoin eliminated the requirement of the SAT for its applicants in 1969, although if a student chooses to submit such scores, they are used in making the admissions decision. In the forty years since this policy was implemented, between 70 percent and 84 percent of Bowdoin's applicant pool each year has submitted SAT scores, and moreover, about the same proportion of those who submit SAT scores each year eventually attend Bowdoin. However, and of special importance to this inquiry, essentially all of those students who eventually attend Bowdoin actually take the SAT2.
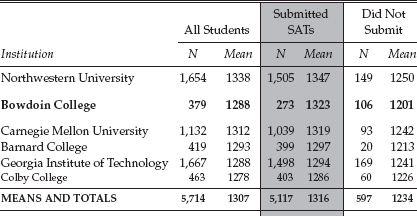
A naive look at the performance of Bowdoin's students on the SAT might begin with a comparison of the average scores obtained by those students in comparison with other schools of similar average performance. Such data are shown in Table 1.1. We see that Bowdoin places second, just behind Northwestern, but that the range of mean performance for these six institutions is sixty-one points. The difference between Bowdoin and Colby is mildly surprising, since they are very similar schools. We also note that Bowdoin has, by far, the largest proportion of attendees who did not submit SAT scores. This is not a surprise given that Bowdoin is alone in this group in not requiring the SAT for admission. The nonsubmitters at the other schools sent in ACT scores instead. I shall expand on this distinction later.
TABLE 1.1
Six Colleges and Universities with Similar Observed
Mean SAT scores for the Entering class of 1999

Why did the 106 Bowdoin students who did not submit SAT scores decide that this was a sensible strategy? We cannot know for sure, but two explanations seem plausible: (1) They knew that the SAT wasn't required and so decided “Why bother?” (2) They believed they would compare unfavorably with other applicants on the SAT and decided that submitting their scores would not help their cause.
Ordinarily the investigation would have to end here, because we cannot know which of these two plausible reasons is true. But we would have some supporting evidence if we knew how well those students who chose not to submit their SAT scores did on the SAT. It turns out that all 106 Bowdoin students who chose not to submit their SAT scores did, in fact, take the SAT. And through a special data-gathering effort at the Educational Testing Service supported by the College Board, those scores were retrieved. Without peeking ahead, it seems plausible that those students who scored very well would probably submit them. Thus we ought to suspect that those who did not submit their scores did worse, on average, than those who did.
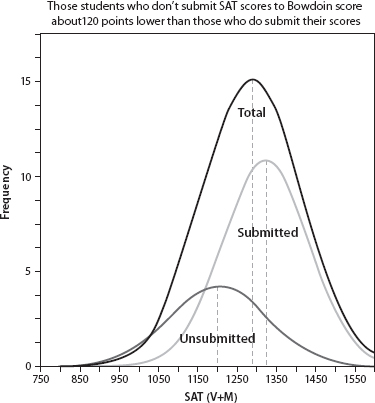
Figure 1.1. Normal approximation to the distributions of SAT scores among all members of the Bowdoin class of 1999
The curves drawn are not the actual distributions. What is shown in figure 1.1 is a normal approximation to Bowdoin students’ actual distribution of SAT performance. In the rest of this discussion I shall continue to use this sort of normal approximation, but to justify this simplification let me illustrate what the actual distributions look like for these two groups. These are shown in figure 1.2. Comparing the results in figure 1.1 and figure 1.2 we find that the normal approximation is not an unreasonable characterization of what is actually happening. There are two aspects of the distributions that are missed in the approximation. The first is the small lump at about a score of 1000 that probably represents students who were accepted because of some unusual circumstance—perhaps because of their skill at a sport or because they were children of alumni or were members of an underrepresented group. The second is the overabundance of very high scores in the approximation that do not appear in the actual distribution. Despite these two shortcomings, a normal approximation is accurate enough in its general structure to provide a useful summary.

Figure 1.2. The distributions of SAT scores among all members of the Bowdoin class of 1999
Thus it is no surprise that they did indeed do worse, a lot worse, at least on average. In Figure 1.1 we see the distribution of SAT scores for all students in the Bowdoin class of 1999, in which 72 percent (273) of the class submitted scores to the college, while the remaining 28 percent (106) withheld them. The mean score of those who submitted them was 1323, while the mean score of those who did not was 1201, 122 points lower.
The evidence provided by the SAT scores from those students who did not submit them suggests that these students were wise in their decision. But because of lack of data on those students that did not matriculate at Bowdoin, we do not know how the bulk of those students with scores in this range fared in their application process.
How Well Did These Students Do
in Their Studies at Bowdoin?
With these results in hand it makes sense to move on to the next logical question: How well did these students do in their studies at Bowdoin? Because the SAT is moderately predictive3 of future performance in college, we might first predict that those students who did not submit their SAT scores, because they scored lower on the SAT than those students who did submit their scores, would also perform less well in their first-year courses. But because Bowdoin admitted them, ostensibly on the basis of their outstanding high school records, perhaps some sort of compensation took place and they did as well as the other students in their first-year courses?
The answer to this question is shown graphically in the score distributions in Figure 1.3. We see that the students who did not submit their SAT scores not only did about 120 points worse on the SAT but also received grades 0.2 grade points (on a four-point scale) worse in their first-year courses.
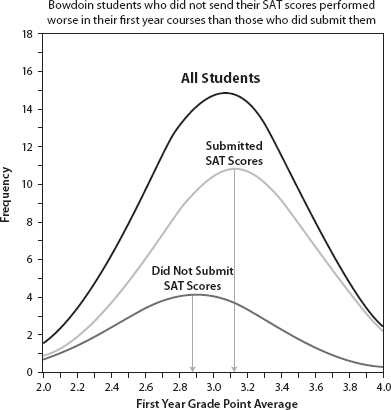
Figure 1.3. Normal approximation of the distributions of first-year grade point averages at Bowdoin shown as a function of whether or not applicants chose to submit their SAT scores
This brief examination of one year of one school's experience in not requiring the SAT teaches us two things:
1. Students who choose not to submit SAT scores behave, on average, sensibly, for, again on average, they perform worse on the SAT than the students who do opt to submit their scores.
2. That whatever other variables are taken into account in the admission of applicants without SAT scores, they do not, on average, compensate for the lower performance on the SAT, for students with lower SAT scores perform predictably worse in their first-year courses at Bowdoin.
Obviously, these conclusions are limited by the use of data from just one school and of just one year, but they are suggestive. Interpretation of these conclusions would be aided if we could put them into a broader context. To do this I looked at five other schools whose average SAT scores, of those members of the entering class of 1999 who chose to submit them, are close to Bowdoin's. These five schools all require an entrance exam, but will accept the ACT as a substitute for the SAT. And, indeed, a small percentage of their matriculating students submitted ACT scores instead of SAT scores (although virtually all of them took the SAT as well). The admissions committee typically converts the ACT score to an SAT scale and then treats all students in a coherent way4. These five schools, and some of their associated statistics, are shown in Table 1.2. In that table we see that all of the observed mean SAT5 scores at these institutions were within about thirty points of the overall mean of 1316; and that Bowdoin is second from the top of this elite group with a mean score of 1323. We also saw that except for Bowdoin about 90 percent of all students at these institutions submit SAT scores. The students who did not choose to submit SAT scores at these five other institutions submitted ACT scores instead. However they all took the SAT, and the scores they obtained are shown in Table 1.2. At Bowdoin, the “nonsubmitters” had the lowest mean score of any school. This is likely to be a selection effect, although it is uncertain whether it is because students who had lower scores chose to apply to Bowdoin because of its policy of not requiring admission test scores, or because Bowdoin had a greater likelihood of accepting such students than these other schools.
TABLE 1.2
summary of SAT Performance (Verbal + Math scores) from six
institutions of similar SAT Performance among Those
Matriculating students Who submitted SAT scores
Note further that Bowdoin's rank of 2 on the basis of the observed SAT scores of the enrolled students drops to a tie for fifth (with Georgia Tech) if the entire class is used for comparison. Of course in most situations the only data that are observed are what have been submitted (the shaded portion of table 1.2) and so the shift in the placement of Bowdoin from second to fifth is invisible. Note also that the relative ordering of the other institutions, all of which require admissions tests and have a much smaller proportion of students who do not submit SAT scores, remains the same for the entire student body as it does for the observed portion. It has not escaped my attention nor, I suspect, that of some college administrators, that making the SATs optional means the SAT scores of the students who submit them will be higher than the scores of the entire student body. This allows the school to game the US News and World Report rankings, which use mean SAT score as a component of the ranking system. I don't believe that this tactic was Bowdoin's motivation, since it adopted this policy long before colleges were ranked according to SAT scores. But suspicions fall more heavily on recent adopters of optional SAT policies.

Figure 1.4. The mean SAT coupled with the mean first-year GPA for the class of 1999 at six schools shown for those who submitted SAT scores for admission and those who did not
HOW IS BOWDOIN DIFFERENT
FROM ALL OTHER SCHOOLS?
For purposes of completeness it makes sense to examine the performance of Bowdoin's students on both the SAT and first-year grades in comparison to the other five schools. One might phrase such a question in Passover-like form:6 “How is Bowdoin different from all other schools?” A comparison between Bowdoin and the other schools, and hence the answer to this question, is shown in Figure 1.4. This figure provides a dramatic summary of both the validity of the SAT (as scores go up, so too do first-year grades) and the remarkable homogeneity of its effect at all schools studied (the constancy of slope of all of the lines). The length of the line corresponds to the difference in SAT scores between those students who submitted them and those who did not; since Bowdoin has the greatest difference, it has the longest line. The slope of the line corresponds to the relationship between performance on the SAT and performance in first-year courses. These slopes are all about equal. The message is clear: If the goal of admissions policy is to admit students who are likely to do better in their college courses, students with higher SAT scores should be chosen over students with lower scores. Following such a rule is impossible if you do not require they submit their scores. Making the SAT optional seems to guarantee that it will be the lower-scoring students who withhold scores. And these lower-scoring students will also perform more poorly, on average, in their first-year college courses, even though the admissions office has found other evidence on which to offer them a spot.
This neatly brings us back to the moral of Thurber's fable recounted at the beginning of this chapter. The data allowing us to examine the efficacy of Bowdoin's admission policy are very difficult to obtain. Ordinarily, only the SAT scores of those students who have submitted them are readily available. It is rare to have access to the scores of the other students. Hence special attention should be paid when we do have them. The message of this study is inescapable—students who do not submit SAT scores withhold them because they do not reflect well on the students' ability to perform well in college. The SAT's predictions are borne out by these students' subsequent performance. Thus, schools that are contemplating adopting Bowdoin's policy would be well advised to hesitate. There is safety in caution.
There is a well-known irony about selection: When a predictor variable is not used for selection, its predictive validity in the selected population increases. Thus we should expect the correlation between first-year grades and SAT scores to be higher among students who did not submit them than among those who did. To examine this pattern, I expanded the pool of schools studied, adding eighteen more to the ones so far examined. For these twenty-four schools I plotted the mean SAT score against mean first-year GPA for both those who submitted SAT scores and those who did not. The result is shown in Figure 1.5. There is a significant increase in the correlation between SAT and first-year GPA (.89 vs. .80) among the students whose SAT scores were not used in their admission decision. This strongly suggests that schools that do not insist on the SAT are making decisions with larger errors than would otherwise be the case.
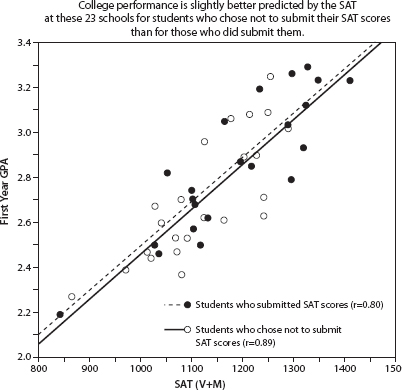
Figure 1.5. The first-year college grades for students who do not submit their SAT scores are predicted with greater accuracy from their SAT scores than they are for those students who submitted their SAT scores for admission.
This chapter developed from H. Wainer, “What Happens If You Don't Require the SAT? Bowdoin College as an Example,” The College Board, New York, February 1, 2006.
1 New York Times, September 22, 2008, A14.
2 The results I report here are based on data gathered by the Admitted Class Evaluation Service (ACES) and collected as part of the joint ETS and College Board New Capabilities Research project. I am grateful for their permission to use these data to help illuminate this issue. Of course, they should not be held responsible for the conclusions I have drawn. Also I would like to thank Karen Castellano for some of the analyses reported here. These results were originally made public in a lecture held at The College Board on February 1, 2006, and were posted on the web in February 5, 2009, at http://blog.criteriacorp.com/2009/02/05dont-ask-dont-tell-the-new-rules-of-the-sat-and-college-admissions/. My gratitude to the College Board, and more specifically, to the College Board's Vice President Wayne Camara, for permitting these results to be posted and thus made available to use.
3 In most schools the SAT predicts performance in first-year courses about as well as four years of high school grades (Willingham 1985; Willingham et al. 1990), although this varies with trends over the decades of the 1970s and 1980s showing a slight increase in validity of the SAT and a slight decline in validity of high school grades.
4 These data contain a mystery. Why do students who submit ACT scores at these schools do consistently worse on the SAT than those who submit SAT scores? There are three plausible explanations: (1) Students who submit ACT scores are consistently poorer students than those who submit SAT scores, (2) the conversion formula between ACT and SAT scores used by college admissions is inaccurate, or (3) those students who took both know the conversion formula and chose the score that puts them in the most favorable light, and hence capitalize on chance variations in score. The consistency across all schools of such students scoring lower on the SAT than the other students, and also performing worse in their first-year courses, provides compelling evidence that this is not some sort of statistical anomaly.
5 Whenever I use the abbreviation SAT score I mean the sum of the scores for the verbal and the mathematical portions of the test; this is often abbreviated “SAT (V+M).”
6 One of the Passover questions is “Why is this night different from all other nights?”