CHAPTER 49. Network Testing and Analysis Tools
SOME OF THE MAIN TOPICS IN THIS CHAPTER ARE
Network and Protocol Analyzers 932
Simple Network Management Protocol (SNMP) 940
A network administrator must wear many hats because the network is composed of many elements, implemented in both hardware and software. In a large network environment, many tasks are delegated to those who are particularly adept in a specific technology. However, the administrator who sits at the top of the management ladder needs to understand the principles under which the network functions and the tools that are used to keep it in good working order. This chapter discusses the basic tools used to troubleshoot the underlying structure of the network (such as the cabling), as well as those used to pick apart the semantics of the communication process (packets and protocols).
Basics: Testing Cables
A network consists of end-user workstations connected to servers by what might appear at first to be a tangled web of wires and cables. If the building or campus is wired correctly, however, this is not a jumble of cables joined together in a spaghetti fashion, but is an orderly collection of components much like a spider’s web, fanning out to connect everyone in a hierarchical manner. In addition, wireless networking components have added an entire new territory, and tools are currently being developed to address troubleshooting this new area of network technology.
For the most part, when you begin to build a network, the first thing you have to do is install the cables that will connect the servers and workstations. This can be done when a building is being constructed, as is the case in most office buildings today. Or it can involve placing cable ducts in ceilings and knocking out areas of the walls to install faceplates where the cables terminate. Either way, before you begin to connect end users to the network, you first have to test the installed cables to be sure they are performing as expected.
Devices that can be used to test cables (both copper wire and fiber-optic cables) range from very inexpensive handheld devices that a cable installer can use to check his work, to very expensive devices that require a skilled technician to perform the tests and understand the results. Things that are usually tested include the following:
![]() Cable length—The physical network topology restricts the length of certain segments in the network. If you make your own cables, a common error may result from trying to stretch the limits of the topology and create a cable that’s just a few meters too long. If a desktop is just a few meters farther from a switch than the standard allows, you may get complaints from that user!
Cable length—The physical network topology restricts the length of certain segments in the network. If you make your own cables, a common error may result from trying to stretch the limits of the topology and create a cable that’s just a few meters too long. If a desktop is just a few meters farther from a switch than the standard allows, you may get complaints from that user!
![]() Resistance—Electricity encounters resistance as it travels along a copper wire.
Resistance—Electricity encounters resistance as it travels along a copper wire.
![]() Noise—Interference can come from other cables that are bundled together or from outside sources, such as fluorescent lighting, nearby welding, strong sources of electromagnetic frequencies, and other high-voltage electrical sources located near the network cabling.
Noise—Interference can come from other cables that are bundled together or from outside sources, such as fluorescent lighting, nearby welding, strong sources of electromagnetic frequencies, and other high-voltage electrical sources located near the network cabling.
![]() Attenuation—As the cable encounters resistance traveling down the wire, and as part of the signal radiates out of the wire, the signal weakens. This is a normal side effect of using copper wiring instead of fiber optics. You can expect copper wiring to work best at the standardized lengths, and take your chances at extending that length.
Attenuation—As the cable encounters resistance traveling down the wire, and as part of the signal radiates out of the wire, the signal weakens. This is a normal side effect of using copper wiring instead of fiber optics. You can expect copper wiring to work best at the standardized lengths, and take your chances at extending that length.
![]() Near-end cross-talk (NEXT)—From the transmission end of a cable, it is necessary to remove the surrounding material that encloses the copper wires and attach each wire to a pin in the cable connector. Because the strength of signal is strongest at the end of the cable where the electrical signal is generated, there is a greater potential for interference between the wires at this end of the cable.
Near-end cross-talk (NEXT)—From the transmission end of a cable, it is necessary to remove the surrounding material that encloses the copper wires and attach each wire to a pin in the cable connector. Because the strength of signal is strongest at the end of the cable where the electrical signal is generated, there is a greater potential for interference between the wires at this end of the cable.
![]() To get a better understanding of the kinds of problems you might experience, see Chapter 6, “Wiring the Network—Cables, Connectors, Concentrators, and Other Network Components.”
To get a better understanding of the kinds of problems you might experience, see Chapter 6, “Wiring the Network—Cables, Connectors, Concentrators, and Other Network Components.”
Two basic instruments are used for testing cables. The first is the simple cable checker, which is used to determine that the cable actually provides an electrical path from here to there. The second is the cable tester, which determines whether the cable has been installed correctly to support the topology of your network, taking into consideration things such as cable length and cross-talk.
Handheld Cable Checkers
A cable-checker device is usually a small battery-operated unit that is used to check STP or UTP cables. This simple test is usually done when cables are first installed as a quick check to be sure that the process of pulling the cables through the ceiling or walls has not damaged them.
If the cable is already attached to a network device, you have to disconnect it and attach it to the unit. A cable checker operates by placing a voltage on a wire and determining whether it can be detected at the opposite end. This can be used to determine whether the cable has a break anywhere along its path and whether you are looking at the same cable on both ends when several cables are traversing a single path. Most cable checkers consist of two components, which you attach to opposite ends of the cable.
Cable Testers
A cable tester is a small step up from the basic checker. This device can be used to measure NEXT, attenuation, impedance, and noise on a line. Some cable testers even perform length measurements, of both the total cable and the distance to a fault on the cable, such as a kink in the wire that is causing reflections of the signal to radiate back to the transmitting side of the cable. Another function you might see is wire-mapping, which checks to be sure that the correct wire-pairs in a cable have been mapped to the correct pins on the connector attached to the end of the cable. In cables used for 10BASE-T networks, for example, the standard specifies specific pairs of wires in the cable that must be used for transmitting and receiving data. The actual decisions about which pins are chosen for a particular connector are not made arbitrarily. If the wires are not correctly mapped to the pin-out on the connector specified by the standard, the cable might generate errors due to noise or cross-talk.
Small handheld instruments like these usually have LED lights that indicate a pass or fail condition for the test you are performing. They do not require a keyboard or monitor to display data. Some have a small screen that displays limited text, sometimes showing the suspected type of error that has caused a fail condition. Most are battery powered and can use an AC adapter, which makes them useful portable instruments for installing or troubleshooting cabling.
When you begin to go up the price ladder for these types of instruments, you will find some that can perform more advanced monitoring functions, such as showing network use and Ethernet collisions. Another useful feature to look for if you can afford it is the capability to log data to a memory buffer for later review. Some cable testers are even capable of connecting to a PC or printer to produce a written report. This allows you to leave the device connected for a while to monitor a line.
Depending on the capabilities of the particular device, you can expect to pay from several hundred dollars up to a thousand or more for a good cable tester. When evaluating products, be sure to compare features. Price doesn’t always reflect the quality of a device. And you should carefully check the literature and documentation that is available for each device when making a purchasing choice. Although some features, such as the capability to produce a written report, might sound great, do you really need that capability? In a large network, probably so; in a small one, probably not.
Bit Error Rate Testers (BERT)
Data travels through the wire (or the fiber) as a series of signals that indicate a single bit, representing either zero or one. The statistic called bit error rate (BER) is calculated as a percentage of bits that have errors when compared to the total number of bits sampled:
number of bit errors during sampling interval
BER = ---------------------------------------------
total number of bits transmitted
Whereas LAN analyzers operate on data captured from the wire in units of frames (depending on the LAN protocol, such as Ethernet or Token-Ring), a bit error rate tester (BERT) performs a more basic function to determine whether the line is capable of carrying the network signaling at the bit level with a minimum of errors.
This kind of instrument is normally used when installing a connection to a network service provider, and it might be used to demonstrate the quality of service that the provider establishes for your link.
The instrument used to perform this kind of error detection usually does so by generating a specific bit pattern on the line and then checking it at another location to compare the generated signal with that which is received. A pseudorandom binary sequence (PRBS) of bits is produced by the instrument. It is pseudorandom because it simulates random data. However, because the pattern is also known by the receiving connection so that it can make the comparison, it’s not truly random, but instead is a predefined pattern. Other tests include sequences of specific bits, either zeros or ones, for extended periods, or specific user-defined bit patterns.
When you have a line that exhibits a high bit-error rate, using a slower transmission speed usually improves performance. This is because when you lower the number of errors that occur, higher-level protocols do not have to resend packets as often to compensate. Although one bit error in a frame usually is easily recovered by a network protocol using an error correction code (ECC) technique, multiple bit errors might be all that it takes to cause an entire frame of several hundred thousand bits to be re-sent.
Time Domain Reflectometers
A signal usually propagates down a wire at a constant speed, provided that the impedance of the cable is the same throughout its journey. When the signal runs into a fault in the wire (such as a kink or a splice) or reaches the end of the wire, part or all of the signal is reflected back to its origin. Similar to radar, instruments that use time domain reflectometry (TDR) to make cable measurements are based on precisely timing the signal pulse as it travels through the cable and back.
Of all the instruments you can use to test cables, TDR is one of the most accurate and fastest. It can help locate faults due to various causes, such as these:
![]() Wires that have been spliced together
Wires that have been spliced together
![]() Moisture trapped in the cable
Moisture trapped in the cable
![]() Cables that have been crushed or have kinks in them
Cables that have been crushed or have kinks in them
![]() Short circuits
Short circuits
![]() Problems in the sheath surrounding a cable
Problems in the sheath surrounding a cable
![]() Loose connectors
Loose connectors
You also can use TDR to measure the length of a cable that has no faults. This can be useful for inventory functions because you can even use it to measure the length of a cable while it is still on a reel to determine whether you have enough or need to order additional stock before beginning a major wiring project. TDR can be used to take measurements on twisted-pair cables, coaxial cables, and even fiber-optic cables. Because fiber-optic cabling is the most expensive (but largest bandwidth) media today, you should consider investing in a TDR that supports fiber-optic media if you are planning on a wide deployment of fiber-optic cabling. At the very least, you should expect a third-party installer of a large cable plant to provide such an instrument. You should also make it part of your project plan to record the statistics provided by the installer. Thus, if a future need dictates, you might have a particular cable segment re-evaluated. Be sure to stipulate such things as the performance of any cable segments in your agreement with an installer. If you are performing the installation yourself, be prepared to use a TDR to check a cable segment should performance degrade. For example, for electrical cabling, other devices (even cables) might be installed later that interfere with your original installation. In that case, moving cables to new locations should solve the problem.
The more expensive models of this instrument can be equipped with a CRT or LED display that shows the wave form of the signal and any reflected signals. The more common instrument displays the number of feet to the end of the cable or a fault, and might have an indicator that tells you the type of fault. By showing the number of feet to a perceived defect, you can trace your installed cabling (or unroll your on-the-roll cabling) so that you can get to the point where the defect occurs.
Using a TDR in this method can help you with installed network cabling (where a new problem has been introduced) and help you check out cabling spools before you accept them.
Impedance
When conductors made of metal are placed in close proximity to each other, as in a twisted-pair or coaxial cable, the effect they have on each other is known as impedance. When the wires are perfectly separated by a constant distance, the impedance remains the same throughout the cable. When something happens along the way, such as damage caused by a crushed cable, the impedance changes at that point. Changes in impedance cause parts of the signal to be reflected back to where it started.
Cables that are used in local area networks (LANs) need to be manufactured to strict specifications, ensuring that the dielectric material that separates the wires within the cable remains constant. If there are random variations due to poor manufacturing procedures, the cable will suffer from problems caused by signal reflections, which might render it unsuitable for your network. Thus, TDR can be used not only as a fault-finder when troubleshooting a wiring problem, but also to ensure that you’ve received what you paid for when you upgrade or expand your network.
Setting a Pulse Width
Most of the good TDR instruments allow you to select the pulse width, which is usually specified in nanoseconds. The larger the pulse width, the more energy that is transmitted from the device and thus the farther down the wire the signal will travel.
A good tip for setting this value is to start with the smallest that the instrument allows and make subsequent measurements, gradually increasing the pulse width. If the fault in the cable is only a short distance away from the measuring instrument, a small pulse width will be adequate to locate it. However, if the fault is minor, a small burst of energy might not be enough to travel to the fault and send back a reflection strong enough to be accurately measured. By varying the pulse width and making several measurements, you can more accurately determine the location of a fault in the cable.
Velocity
Light travels at a constant speed of 186,283 miles per second in a vacuum. When measuring the velocity at which an electrical signal travels through a wire, it is expressed as a percentage of the speed of light, which is considered to be slightly less than 100%, or a value of 1. For example, a twisted-pair cable that has a VOP (velocity of propagation) of .65 would conduct an electrical signal at 65% of the speed of light, or about the speed I drive on the interstate (miles per hour, of course).
Manufacturers usually supply this value to customers, and it will most likely be found on the specification sheet for the cable you are purchasing. Because TDR measures the time it takes for a signal to travel down a wire and make the return trip, you have to know the VOP of the cable being tested before you can make accurate measurements.
If you have cables that you are unsure about, you can test them first to determine the VOP. Do this by measuring a specific length of cable to get its length and then using the TDR instrument to test for the length of the cable, varying the VOP until the tester reads the correct length. Of course, this assumes that the segment of cable you use for this test is in good condition!
Network and Protocol Analyzers
The first level of network testing consists of making sure that the underlying physical cabling structure is performing as expected. The next level is to monitor and test the network traffic and messages generated by the network protocols to be sure that you have a healthy network. Network analyzer products operate by monitoring the network at the Data Link and Transport layers in the OSI reference model.
Note
The OSI reference model separates the components of a network protocol stack into modular layers, each of which performs a specific task for the layer above or below it in the model. Appendix A, “Overview of the OSI Seven-Layer Networking Reference Model,” covers this model, discussing each layer in detail. You’ll hear terms such as Network layer, Data Link layer, and Transport layer frequently when discussing networking, so it’s a good idea to have a basic understanding of what these terms mean and the networking functions they represent.
Again, you will find that the tools you can select for protocol analyzers range from the very inexpensive (free) to the very expensive (several thousand dollars). One difference between these kinds of tools and those used to check cables, however, is that you need to have a good understanding of the network structure and protocols used before you can make meaningful judgments about the data you collect. The LAN analyzer allows you to intercept network traffic as it passes through the wire in realtime and save the data for analysis. A good analyzer should be able to produce meaningful statistics about the traffic on the network, decode the protocols that are used, and provide a good filtering capability so that you don’t get bogged down in an overwhelming amount of data.
You should consider many factors when deciding on a network analyzer product. The most basic factor is whether you want a portable device that can be transported to different sites or one or more devices that can be placed at strategic locations in the network to perform continuous monitoring. Other features to consider include the following:
![]() Price—Of course, this is always a factor when purchasing equipment for a network.
Price—Of course, this is always a factor when purchasing equipment for a network.
![]() Software or hardware—Do you need a dedicated hardware instrument that can perform intense analysis and connect to multiple segments, or can you live with a software implementation that runs on an existing network workstation?
Software or hardware—Do you need a dedicated hardware instrument that can perform intense analysis and connect to multiple segments, or can you live with a software implementation that runs on an existing network workstation?
![]() Network interface—Do you need to connect to just a 100BASE-T (or even higher bandwidth devices) environment, or do you need a device that connects to other topologies such as FDDI or Token-Ring?
Network interface—Do you need to connect to just a 100BASE-T (or even higher bandwidth devices) environment, or do you need a device that connects to other topologies such as FDDI or Token-Ring?
![]() Protocol stack support—Is your network homogeneous, or does it support multiple network protocols?
Protocol stack support—Is your network homogeneous, or does it support multiple network protocols?
![]() Statistics—What kind of statistical data does the instrument support? The most basic is frames-per-second. Others include utilization and usage. Utilization is a measurement of the actual amount of bandwidth that your network media is supporting at any point in time. Usage statistics can tell you what is using that bandwidth—from protocol statistics to such things as the number of collisions on a shared Ethernet segment.
Statistics—What kind of statistical data does the instrument support? The most basic is frames-per-second. Others include utilization and usage. Utilization is a measurement of the actual amount of bandwidth that your network media is supporting at any point in time. Usage statistics can tell you what is using that bandwidth—from protocol statistics to such things as the number of collisions on a shared Ethernet segment.
![]() Memory and buffers—Does the instrument provide enough buffering capacity to capture frames on a high-speed network such as 100BASE-T? How about Gigabit Ethernet?
Memory and buffers—Does the instrument provide enough buffering capacity to capture frames on a high-speed network such as 100BASE-T? How about Gigabit Ethernet?
![]() Filters—Does the analyzer provide sufficient filtering capabilities to allow you to look through large volumes of data to get to the frames that really matter?
Filters—Does the analyzer provide sufficient filtering capabilities to allow you to look through large volumes of data to get to the frames that really matter?
![]() Import and export—Does the device allow you to save files to a disk or another medium so that you can transfer them to other workstations for further analysis?
Import and export—Does the device allow you to save files to a disk or another medium so that you can transfer them to other workstations for further analysis?
A good LAN analyzer allows you to monitor network traffic in real-time mode, using filters to narrow the scope of your view. You can set up capture filters, store part or all of the frames that match in a buffer, and perform further analysis.
Establishing a Baseline
Before you begin to perform monitoring or analysis of the network usage and utilization, you need to establish a set of baseline data. To interpret the statistical data that you can collect using LAN analyzers, you need to have something with which to compare future measurements. Baseline data is used to define the normal operating environment for a system and provides a reference for monitoring and troubleshooting efforts.
Baseline data is useful not only for troubleshooting, but also for planning capacity and measuring the effectiveness of an upgrade. Things you should consider recording in your baseline documentation in addition to values you monitor with a LAN analyzer include such things as these:
![]() Location of equipment in the network
Location of equipment in the network
![]() Type of equipment in use
Type of equipment in use
![]() The number and distribution of users
The number and distribution of users
![]() Protocols in use
Protocols in use
Knowing the type of equipment is important because different models of NICs, hubs, and other devices can vary widely in their performance. Knowing where each piece of equipment is located can enable you to create an audit trail for troubleshooting. For example, it is common in a business environment for users and workstations to be constantly on the move.
A simple weekend move, in which you take a few workstations or servers and move them to a different location, might have a dramatic, unexpected impact on the network. Suppose you have two servers that you want to move from a departmental location to a central computer room. When they were located on the same network segment as the users that use them the most, traffic was localized. Placing them on a different segment might cause capacity problems in a backbone link or in a device such as a switch or router that connects the network. If you keep track of hardware and statistical information about its performance and usage, you can usually prevent this sort of thing from happening. At least, you can look back and determine where a problem lies and be in a better position to find a solution.
This same principle applies to the location of users in the network. Different users can make widely differing demands on a single workstation or server. Keep a list of users, the applications they use, and, when appropriate, the time of day they work in situations in which shift-work is performed.
![]() In Chapter 48, “Strategies for Troubleshooting Network Problems,” you will find additional information regarding analyzing and segmenting groups of users according to their use of network resources.
In Chapter 48, “Strategies for Troubleshooting Network Problems,” you will find additional information regarding analyzing and segmenting groups of users according to their use of network resources.
Understanding the protocols that are used is also important. A simple problem that can be hard to figure out occurs when you move a device to a different network segment and are unaware that it is using a nonroutable protocol. Most routers can be configured to pass these nonroutable protocols (such as NetBEUI), but you need to be aware of this and configure the router accordingly before you make the move.
Finally, baseline data is never going to be something that is cast in stone and unchangeable. Modify your documentation as the network grows or changes so that the data remains useful.
Statistical Data
Although most analyzers provide a wide range of statistical data, the analyzer should be able to give you a few general values.
First, be sure that the analyzer can give you statistics that tell you the utilization of the network. In addition to a real-time graphical display, you should also look for the capability to monitor the network and tell you when peak utilization occurs. That is, what times during the day does the network reach its busiest points? Overall utilization calculated over the average workday might not be nearly as helpful as identifying the periods of time when users are working their hardest and getting frustrated with a bogged-down network. Using peak utilization statistics, you can work to resolve the traffic problems by reallocating resources, or perhaps rearranging work habits of the user base.
Another statistic that is found on most analyzers is Frames Per Second (FPS). By itself, FPS isn’t a revealing value, but when combined with data showing the size of packets traversing the network, it can produce meaningful data. The larger the packet size used by a protocol, the more efficient the protocol is likely to be. This is because each packet requires overhead necessary to implement the protocol, such as addressing and error-checking information. With a larger packet size, the ratio of overhead to payload is reduced.
Protocol Decoding
The capability to take the raw bits that travel on the network and present them on a frame-by-frame basis is a powerful feature of the analyzer. Looking at a stream of byte values isn’t very useful when troubleshooting a network problem. Looking at each frame, and understanding what kinds of frames are being generated by devices on the network, is a necessary component of a network analyzer.
Look for an analyzer that gives both a summary and a detailed view of the frame. The summary view usually shows just the addressing and header portion of the packet, whereas the detailed view displays every byte contained in the frame.
Filtering
Filtering is a necessary component for any network analyzer. Filtering allows you to set criteria that the analyzer uses when it captures frames, or to selectively search through a buffer of captured data to retrieve only those frames that are pertinent to your troubleshooting efforts. Filters can usually be set to select frames by protocol type, frame type, and protocol address or MAC addresses. Some allow you to search for specific data patterns throughout the entire packet.
Software-Based Analyzers
Software analyzers are the cheapest route for large, complex networks. Because processors have scaled to much greater speeds and network adapters can capture packets from the fastest LAN speeds, software analyzers are now catching up to hardware-based analyzers. And you can find some freeware analyzer products on the Web that perform some or all of the functions you might need in a small network.
Windows NT 4.0 through Windows 2003 servers come with a network monitor tool that enables the local workstation or server to monitor network traffic that is generated by or sent to the computer. The version that comes with the Systems Management Server (SMS) allows the network administrator to monitor all traffic on the LAN, using a feature referred to as promiscuous mode. The Windows 2000 Servers and Windows 2003 Servers network monitor can be found in the Administrative Tools folder.
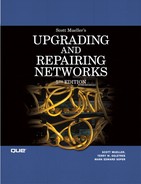
Both of these products allow you to capture data on the LAN, filter, and troubleshoot many kinds of problems. Because these products run on a workstation, you can use them to collect and store large amounts of information for immediate analysis and long-term reporting. In Figure 49.1, you can see the main window of the Network Monitor for Windows Server 2003 (called the Capture Window).
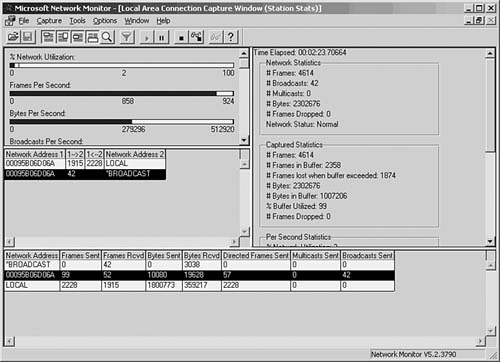
Figure 49.1. The Capture Window shows a summary of the frames that have been captured by Network Monitor.
Tip
If you don’t see the Network Monitor in the Administrative Tools folder, you need to install the component. Use Add/Remove Programs from the Control Panel. Select Add/Remove Windows Components, and then choose Management and Monitoring Tools; then, from the details button, select the network monitor.
To begin capturing frames on the network, choose Capture, Start. You can also use the Capture menu to pause or stop the capture process. As frames are captured by the monitor, you can get an idea of what is happening on the network by the continuously updated bar graphs in the Capture Window. To view the actual data being collected, you can stop the capture process by selecting Capture, Stop. Choose Capture, Display Captured Data to view the frames captured (see Figure 49.2).
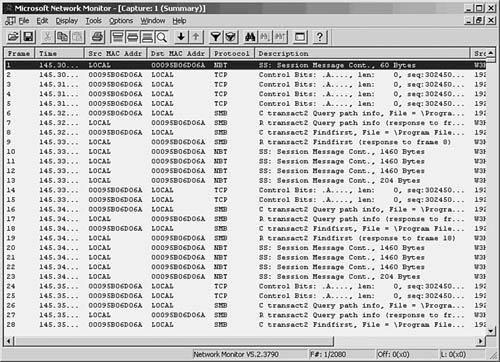
Figure 49.2. The summary view window allows you to examine the captured data.
As you can see, a summary line is provided for each frame that the monitor captured. You can scroll up or down to view all frames in the buffer. At this point, the frames are stored in a temporary buffer. If you only need to view the data for immediate analysis and then discard it, you can do so from this window. If you want to store the data for later analysis, select File, Save As. To view data in a stored file, choose File, Open to read the data in the file into the temporary buffer.
To examine any of the captured frames and view it in detail, double-click it in the summary window. The window opens a Detail pane that shows the kinds of data in the frame. Click the plus sign (+) to expand the list of data contained in the frame. Figure 49.3 is an example of an ICMP (Internet Control Message Protocol) frame generated during a PING operation. By highlighting the ICMP portion of the Detail pane (in the center of this figure), the monitor highlights the data pertaining to this in the data section at the bottom of the figure. By showing the bytes that make up different parts of the frame, the monitor makes your job easier.
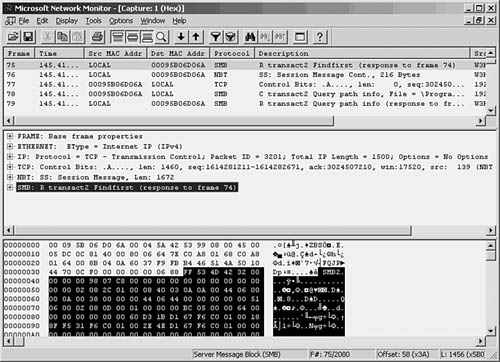
Figure 49.3. You can examine the actual contents of the frame from this view.
Capture and Display Filters
The amount of traffic that passes through even a small network can be overwhelming, but not when you’re using a network monitor to watch statistical information about current traffic. When you are troubleshooting, however, it’s helpful to be able to filter out the nonessential information so that you can examine only those frames that are pertinent to the problem at hand.
For this purpose, most analyzers allow you to set up a filter that screens out all but the frames you want to view. A capture filter is used to create selection criteria for the frames that will be kept and stored in the temporary buffer, whereas a display filter can be used to further select frames from those that are captured. Select Capture, Filter.
In Figure 49.4, you can see the dialog box used to start creating a capture filter for the Network Monitor.
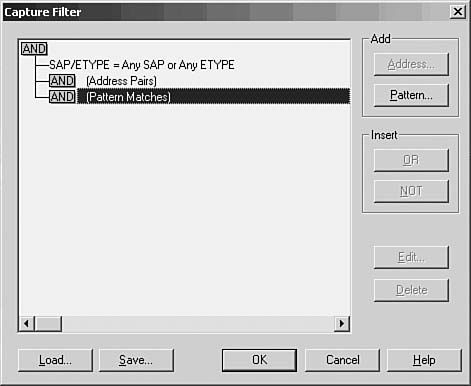
Figure 49.4. Create a capture filter to specify which frames are copied to the temporary buffer.
For a capture filter, you can specify specific protocols, address pairs, or patterns that occur in the frame itself. Figure 49.5 shows the dialog box used to select address pairs, and Figure 49.6 shows the dialog box used to specify a pattern.
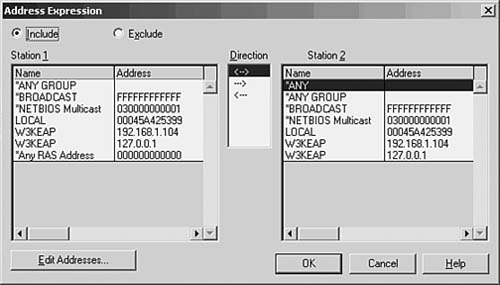
Figure 49.5. You can select the addresses that must appear in a frame in order for it to be selected for capture.
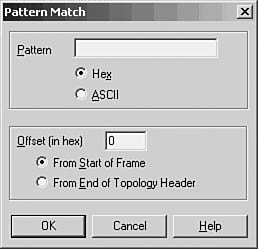
Figure 49.6. Specify a pattern and an offset value for capturing frames based on pattern matching.
When using pattern matching, you can specify a string that must be found in the frame before it is considered a candidate for capture. You can specify an offset value also, which indicates a starting point for the filter in the frame when it searches for the pattern.
Capture Triggers
After you create a capture filter, you can begin to capture data based on it by selecting Capture, Start. When using a narrow filter to look for a specific problem that doesn’t occur often, you can set up an event to notify you when a matching frame is finally detected instead of having to sit at the console and wait. To set a capture trigger, select Capture, Trigger.
The Network Monitor allows you to monitor overall traffic on the network by watching the graphs displayed in the Capture Window, and it allows you to look at specific frames to determine where problems exist. Similar to a hardware LAN analyzer, a good software LAN analyzer can be a valuable tool for determining network use or for troubleshooting specific protocol problems. Still, to view all network traffic, you’ll need another network monitor, such as that included with Microsoft’s SMS, or a third-party-product.
Other Software LAN Analyzer Products
The fast microprocessors used in today’s desktop and laptop computers allow for a wide range of software products to provide functionality that used to be primarily the domain of hardware-based analyzers. The preceding section looked at the built-in LAN monitoring tools available as part of the Windows operating system. However, a large market exists for software-based LAN analyzers, and they are usually much less expensive to deploy than their hardware counterparts.
Before investing in a software LAN analyzer, you should try before you buy. Following is a list of a few good products that allow you to either download a demonstration version or order a CD that you can use to evaluate the product before making a purchase. Don’t buy the first product you look at. Instead, determine whether the documentation is up to par, whether the company provides good technical support, and, most important, whether the product is intuitive and easy to use.
![]() Ethertest LAN Analyzer for Windows—This LAN analyzer from Frontline Test Equipment, Inc. (FTE), runs on systems ranging from Windows 95 to Windows XP. You can download a demo of this product at
Ethertest LAN Analyzer for Windows—This LAN analyzer from Frontline Test Equipment, Inc. (FTE), runs on systems ranging from Windows 95 to Windows XP. You can download a demo of this product at www.fte.com. If you’re in the process of deploying Bluetooth technology in your LAN, you might also want to download a demo of FTE’s SerialBlue Bluetooth.
![]() Observer, Expert Observer, and Observer Suite from Network Instruments—These products perform everything from simple network protocol analysis to SNMP (Simple Network Management Protocol), RMON (Remote Monitoring) console, and probe reporting. The software also runs on systems ranging from Windows 2000 to Windows Server 2003. Additionally, the Observer product line also includes support for IEEE 802.11a and 802.11b wireless networking. You can download a demo from
Observer, Expert Observer, and Observer Suite from Network Instruments—These products perform everything from simple network protocol analysis to SNMP (Simple Network Management Protocol), RMON (Remote Monitoring) console, and probe reporting. The software also runs on systems ranging from Windows 2000 to Windows Server 2003. Additionally, the Observer product line also includes support for IEEE 802.11a and 802.11b wireless networking. You can download a demo from www.netinst.com.
![]() Wildpackets—An assortment of network analysis tools can be downloaded, ranging from the highly rated EtherPeek LAN analysis tool to AiroPeek for wireless LAN analysis. You can download demos for these and other valuable tools by visiting
Wildpackets—An assortment of network analysis tools can be downloaded, ranging from the highly rated EtherPeek LAN analysis tool to AiroPeek for wireless LAN analysis. You can download demos for these and other valuable tools by visiting www.wildpackets.com.
This is only a short list of the large number of products available, and they are not rated as to which is best because it depends on your needs and how your network is laid out. However, you should download the demos listed here so that you can get an idea of what you can expect from a software based LAN analyzer. If you’re going to spend money on such a product, make sure it’s an informed purchase.
Hardware Analyzers
This type of instrument can cost as much as tens of thousands of dollars. Hardware analyzers, however, provide functionality in a critical situation that might not be obtainable from a software-based product. A hardware LAN analyzer can be taken to the location where a problem exists and be connected to the network to perform its functions. A hardware instrument will most likely be better able to cope with a high-speed environment, such as 100BASE-T and 1000BASE-T, than a software application that relies on a standard network adapter card to get traffic from the network medium. Hardware analyzers contain special circuitry that is used to perform many functions must faster than can be done via software, and are usually more reliable.
Another thing to consider when comparing hardware to software analyzers is that when you use a PC or a workstation to act as your LAN analyzer, it might be limited as to what the NIC can do. For example, some ordinary adapter cards have built into their firmware a function that automatically discards certain kinds of packets that contain errors. If you are trying to detect what errors are causing problems on your network while troubleshooting, a software product running on a workstation might not be able to help you.
Also, although it’s true that network adapter cards can literally see every packet on the network as it zips by, that doesn’t mean that the cards are capable of capturing the data and passing it up to higher-level protocols. When a card does capture all frames and pass them up the protocol stack, it is operating in promiscuous mode. Some cards are designed specifically not to do this, so be sure to check the documentation that comes with the one you might want to use on a workstation that will host LAN monitoring software.
Note
For most typical situations, even in a large network, the functions performed by most hardware-based analyzers can now be performed using software products, such as those discussed in the preceding section. However, for high-speed WAN links, or for situations in which the network topology is complex, involving multiple protocols and services, it might be worth the investment to purchase a hardware-based analyzer. First, try a software product before spending the money on a hardware device. Check out the capabilities of the network adapter(s) you install on a PC or another workstation that will host a network analyzer software product.
Hardware analyzers are expensive because they usually do a very good job and are designed specifically for what they do. Most have built-in disk drives to store captured data, including a floppy disk drive that can be used to exchange data with PC workstations. Be sure that the instrument has enough memory to buffer significant amounts of data. Another feature to look for is a good display so that you can monitor utilization graphically as well as display the contents of individual frames.
A hybrid analyzer that combines the best of the hardware and software products is also available. This type of device implements the capturing and filtering functions in a hardware component that attaches to a workstation, which then provides the display and storage functions. The hardware component has dedicated circuitry and processing power to capture data from the wire, and a software application on the PC is used to filter, calculate, and display the data. This type of device can be external to the PC, although some are implemented as cards that plug into the system’s bus.
Simple Network Management Protocol (SNMP)
Building a network today involves integrating products from various vendors. This chapter has discussed tools that can be used to locate faults in the physical elements that make up the network and tools that can be used to monitor the functioning of network protocols.
Yet, so far the tools that have been mentioned are all limited to performing a few specific tasks, and each tool must be used as a separate entity. SNMP was developed to provide a “simple” method of centralizing the management of TCP/IP-based networks. The goals of the original SNMP protocols include the following:
![]() Keep development costs low to ease the burden of implementing the protocol for developers.
Keep development costs low to ease the burden of implementing the protocol for developers.
![]() Provide for managing devices remotely.
Provide for managing devices remotely.
![]() Make the protocol extensible so that it can adapt to new technologies.
Make the protocol extensible so that it can adapt to new technologies.
![]() Make the protocol independent of the underlying architecture of the devices that are managed.
Make the protocol independent of the underlying architecture of the devices that are managed.
![]() Keep it simple.
Keep it simple.
The last goal is an important one. Because SNMP is meant to be incorporated into many types of network devices, it was designed so that it would not require a lot of overhead. This makes it easy to create simple devices—such as a bridge or a hub—that can be managed by SNMP, as well as a more complex device such as a router or a switch. Other key factors of the protocol that stick to this goal include the use of the User Datagram Protocol (UDP) for messaging and a manager-agent architecture. UDP is easier to implement and use than a more complex protocol such as TCP. Yet it provides enough functionality to allow a central manager to communicate with a remote agent that resides on a managed device.
The two main players in SNMP are the manager and the agent. The manager is usually a software program running on a workstation or larger computer that communicates with agent processes that run on each device being monitored. Agents can be found on bridges, routers, hubs, and even users’ workstations. The manager polls the agents making requests for information, and the agents respond when asked.
Applications designed to be the manager end of the SNMP software vary in both expense and functionality. Some are simple applications that perform queries and allow an administrator to view information from devices and produce reports. Some of the other functions that a management console application might perform include the following:
![]() Mapping the topology of the network
Mapping the topology of the network
![]() Monitoring network traffic
Monitoring network traffic
![]() Trapping selected events and producing alarms
Trapping selected events and producing alarms
![]() Reporting variables
Reporting variables
Some management consoles, also referred to as network management stations (NMS), can produce trend-analysis reports to help capacity planning set long-range goals. With more advanced reporting capabilities, the administrator can produce meaningful reports that can be used to tackle a specific problem.
SNMP Primitives
Management software and device agents communicate using a limited set of operations referred to as primitives. These primitives are used to make requests and send information between the two. The primitives are initiated by the management software and include the following:
![]()
get—The manager uses this primitive to get a single piece of information from an agent.
![]()
get-next—When the data the manager needs to get from the agent consists of more than one item, this primitive is used to sequentially retrieve data; for example, a table of values.
![]()
set—The manager can use this primitive to request that the agent running on the remote device set a particular variable to a certain value.
The following primitives are used by the agent on a managed device:
![]()
get-response—This primitive is used to respond to a get or a get-next request from the manager.
![]()
trap—Although SNMP exchanges are usually initiated by the manager software, this primitive is used when the agent needs to inform the manager of some important event.
Network Objects: The Management Information Base (MIB)
The primitives just described are the operations that can be performed by the manager or agent processes when they exchange data. The types of data they can exchange are defined by a database called the management information base (MIB). The first compilation of the objects stored in this database was defined by RFC 1066, “Management Information Base for Network Management of TCP/IP-based Internets.” A year later, this was amended by RFC 1213, “Management Information Base for Network Management of TCP/IP-based Internets: MIB-II.” MIB-II clarified some of the objects that were defined in the original document and added a few new ones. Two other RFCs, 2011 and 2012, added further information for the MIB-II database.
The MIB is a tree of information (a virtual information store). This hierarchical database resides on the agent, and information collected by the agent is stored in the MIB. The MIB is precisely defined; the current Internet standard MIB contains more than a thousand objects. Each object in the MIB represents some specific entity on the managed device. For example, on a hub, useful objects might collect information showing the number of packets entering the hub for a specific port while another object might track network addresses.
When deciding which types of objects to include in the standard, the following things were taken into consideration:
![]() The object had to be useful for either fault or configuration management.
The object had to be useful for either fault or configuration management.
![]() The object had to be “weak,” which means that it had to be capable of performing only a small amount of damage should it be tampered with. Remember, in addition to reading values stored in the MIB, the management software can request that an object be set to a value.
The object had to be “weak,” which means that it had to be capable of performing only a small amount of damage should it be tampered with. Remember, in addition to reading values stored in the MIB, the management software can request that an object be set to a value.
![]() No object was allowed if it could be easily derived from objects that already exist.
No object was allowed if it could be easily derived from objects that already exist.
The first definition of the standard MIB hoped to keep the number of objects to 100 or fewer so that it would be easier to implement. This, of course, is not a factor now.
Because the SNMP management scheme is intended to be extensible, vendors often create their own objects that can be added to the management console software so that you can use them.
An object has a specific syntax, name, and method of encoding associated with it. The name consists of an object identifier, which specifies the type of object to which a specific instance of that kind of object is added. The object identifier is a numeric string of decimal digits separated by periods—for example, “.3.6.1.2.1.1.1”. The “instance” of an object is the same, with an additional decimal number following the original object identifier. To make things easier for humans, an object descriptor is used in a text-readable format.
An object can be read-only, read-write, or write-only. In addition, an object can be non-accessible. Syntax types for objects include the following:
![]() Integer
Integer
![]() Octet String or Display String
Octet String or Display String
![]() Object Identifier
Object Identifier
![]() Null
Null
![]() Network Address
Network Address
![]() Counter
Counter
![]() Gauge
Gauge
![]() TimeTicks
TimeTicks
![]() Opaque
Opaque
In the first MIB RFC, objects are divided into only a few high-level groups:
![]() System—This group includes objects that identify a type of system (hardware or software).
System—This group includes objects that identify a type of system (hardware or software).
![]() Interfaces—An object in this group might represent an interface number or an interface type. Other information about network interfaces, such as the largest IP datagram that can be sent or received, is included as objects in this group.
Interfaces—An object in this group might represent an interface number or an interface type. Other information about network interfaces, such as the largest IP datagram that can be sent or received, is included as objects in this group.
![]() Address Translation—Objects in this group are used for address translation information, such as the ARP (Address Resolution Protocol) cache.
Address Translation—Objects in this group are used for address translation information, such as the ARP (Address Resolution Protocol) cache.
![]() IP—Objects in this group supply information about the IP protocol, including time-to-live values, number of datagrams received from interfaces, errors, and so on.
IP—Objects in this group supply information about the IP protocol, including time-to-live values, number of datagrams received from interfaces, errors, and so on.
![]() ICMP—This group includes Internet Control Message Protocol (ICMP) input and output statistics.
ICMP—This group includes Internet Control Message Protocol (ICMP) input and output statistics.
![]() TCP—Objects in this group are used to hold information about TCP connections. Instances of these objects exist only while the connection exists. Data contained in these objects includes the number of segments sent or received, for example, or the state of a particular TCP connection (closed, listen, and so on).
TCP—Objects in this group are used to hold information about TCP connections. Instances of these objects exist only while the connection exists. Data contained in these objects includes the number of segments sent or received, for example, or the state of a particular TCP connection (closed, listen, and so on).
![]() UDP—Objects in this group represent statistics about UDP, such as the number of UDP datagrams delivered, or the number of UDP datagrams received for which there is no corresponding application at the destination port.
UDP—Objects in this group represent statistics about UDP, such as the number of UDP datagrams delivered, or the number of UDP datagrams received for which there is no corresponding application at the destination port.
![]() EGP—These objects are used for the Exterior Gateway Protocol (EGP), and they contain information such as components of each EGP neighbor, and the state of the local system with respect to a neighbor.
EGP—These objects are used for the Exterior Gateway Protocol (EGP), and they contain information such as components of each EGP neighbor, and the state of the local system with respect to a neighbor.
In MIB-II, the address translation group was declared to be “deprecated.” That is, it should still be supported but might not be in the next version, which is a means for gradually preparing for changes in the protocol. MIB-II, however, adds new objects and functionality that can be used to perform the same functions as those performed by this group, just in a different way.
MIB-II also added new objects to the existing groups. For example, what seems obvious now as necessary information for the system group—a contact person, a system location, and system services—can now be stored in objects in this group.
New groups added by MIB-II include these:
![]() Transmission—Related to the Interface group, this group is used for objects that relate to specific transmission media.
Transmission—Related to the Interface group, this group is used for objects that relate to specific transmission media.
![]() SNMP—A group added for objects needed by the application-oriented working group to collect useful statistical information.
SNMP—A group added for objects needed by the application-oriented working group to collect useful statistical information.
Proxy Agents
Not all devices are equipped with SNMP capabilities. For these devices, another device might be able to handle those functions and acts as a proxy agent so that it can still be managed from the SNMP management console. For example, a network card might not be SNMP-enabled, but the host computer can run a process that can monitor the network card and act as a proxy agent, relaying information to the management station. Proxy agents also can be developed to translate between proprietary management software and SNMP. In this case the proxy agent understands the proprietary management capabilities of the device, and communicates with the SNMP management station when necessary.
The Complex Road to SNMPv2 and SNMPv3
The original implementation of SNMP was kept simple and has been widely used throughout the industry. However, it suffers from several limitations. The get/response messaging mechanism allows for the transfer of only one piece of information at a time. The UDP packet is sufficiently large enough to accommodate more data, but the protocol was not built to allow for this. Security is also an issue with SNMP (version 1) because it has no provisions for encryption or authentication.
A committee of the IETF began work on what was to become SNMPv2 in 1994. Work on this second version of the SNMP standard was delayed for years because many could not agree on some of the security and other issues involved. Because of this, several versions of SNMPv2 were created, specifically SNMPv2u and SNMPv2c, each taking a different approach to security issues. In spite of the haziness of the actual SNMPv2 specifications, however, you’ll now find that many vendors support some of the functionality that has been described in the many RFCs that relate to SNMPv2. RFC 1901, “Introduction to Community-Based SNMPv2,” is the current Experimental Standard that is implemented by some vendors as if it were an approved standard. See also RFCs 1905 and 1906.
One of the good things to come out of the SNMPv2 debate were two new operations:
![]()
Get-bulk—This operation allows for the retrieval of a larger amount of information from a single request. This new operation can be used in place of repetitive calls to get-next when transferring large amounts of related information.
![]()
Inform—This operation allows for one network management station (NMS) to send traps to another NMS.
For the most part, however, a newer version called SNMPv3 is a more likely candidate for adoption by a wider range of vendors. Although SNMPv1 and SNMPv2 implementations are not compatible with each other, SNMPv3 incorporates the best from both, adding security and other features to the protocol. Actually, SNMPv3 is still being developed, and only some RFCs are considered standards.
RFC 2571, “An Architecture for Describing SNMP Management Frameworks,” uses the previous SNMP RFCs heavily, with the following items being the main goals of the RFC:
![]() Provide an architecture that allows for the standards process for SNMP developments to proceed even when consensus has not been reached for all the specifics of proposed additions.
Provide an architecture that allows for the standards process for SNMP developments to proceed even when consensus has not been reached for all the specifics of proposed additions.
![]() Provide for additional security measures.
Provide for additional security measures.
![]() Modularize each SNMP entity so that each “SNMP engine” can implement the necessary functions to send and receive messages, perform authentication, and perform encryption of messages. Thus, any number of entities can be combined to create an agent, or a management station.
Modularize each SNMP entity so that each “SNMP engine” can implement the necessary functions to send and receive messages, perform authentication, and perform encryption of messages. Thus, any number of entities can be combined to create an agent, or a management station.
By allowing for a modular approach to SNMP construction, this RFC makes it possible to create new SNMP functionality without having to redefine the entire SNMP standard each time a new feature is added. After all, the “S” in SNMP stands for “simple.”
You might want to read these other relevant RFCs when you are evaluating a product and determining how it measures up to the latest in SNMPv3 standards. The following are now IETF standard RFCs, and they apply to different aspects of the SNMP protocol, from version 2 to 3. These are recommended reading for anyone who is involved with purchasing, using, or operating a management console or devices that incorporate SNMP functionality:
![]() RFC 1157, “Simple Network Management Protocol (SNMP),” which is considered a “historic” standard, in that it was involved in the process of defining the SNMP protocol.
RFC 1157, “Simple Network Management Protocol (SNMP),” which is considered a “historic” standard, in that it was involved in the process of defining the SNMP protocol.
![]() RFC 1643, “Definition of Managed Objects for the Ethernet-Like Interface Types.”
RFC 1643, “Definition of Managed Objects for the Ethernet-Like Interface Types.”
![]() RFC 3418, “Management Information Base (MIB) for the Simple Network Management Protocol (SNMP).”
RFC 3418, “Management Information Base (MIB) for the Simple Network Management Protocol (SNMP).”
![]() RFC 3417, “Transport Mappings for the Simple Network Management Protocol (SNMP).”
RFC 3417, “Transport Mappings for the Simple Network Management Protocol (SNMP).”
![]() RFC 3416, “Version 2 of the Protocol Operations for the Simple Network Management Protocol (SNMP).”
RFC 3416, “Version 2 of the Protocol Operations for the Simple Network Management Protocol (SNMP).”
![]() RFC 3415, “View-Based Access Control Model (vacm) for the Simple Network Management Protocol (SNMP).”
RFC 3415, “View-Based Access Control Model (vacm) for the Simple Network Management Protocol (SNMP).”
![]() RFC 3414, “User-Based Security Model (USM) for Version 3 of the Simple Network Management Protocol (SNMPv3).”
RFC 3414, “User-Based Security Model (USM) for Version 3 of the Simple Network Management Protocol (SNMPv3).”
![]() RFC 3413, “Simple Management Protocol (SNMP) Applications.”
RFC 3413, “Simple Management Protocol (SNMP) Applications.”
![]() RFC 3411, “An Architecture for Describing Simple Network Management Protocol (SNMP) Management Frameworks.”
RFC 3411, “An Architecture for Describing Simple Network Management Protocol (SNMP) Management Frameworks.”
Note that these RFC standards are rather recent, although those just listed are now considered standards. However, as complex as the “Simple” Network Management Protocol has become, it is hard to give a general definition of exactly what SNMPv3 is, or will be at this time. The preceding list of RFCs can point you in the right direction when it comes to evaluating manufacturers’ hardware/software definitions.
RMON
RMON (which stands for Remote Monitoring) is a data-gathering and analysis tool that was developed to help alleviate some of the shortcomings of SNMP. RMON works in a similar manner, and its objects are defined in an MIB. RMON can also be thought of as a specialized SNMP MIB for use with remote monitoring devices. It was designed to work much like the LAN analyzer discussed earlier in this chapter. RFCs 1757, “Remote Network Monitoring Management Information Base,” and 1513, “Token-Ring Extensions to the Remote Network Monitoring MIB,” provide the standard MIB definitions for RMON for Ethernet and Token-Ring networks, respectively.
In SNMP, the roles of the manager and agent are those of a client and server, with the agents being the client of the management console software. In RMON, the agents (often called probes) are the active parties and become the server while one or more management consoles can be their clients.
Instead of the management console performing a periodic polling process to gather data and perform analysis from agents out in the field, the agents in RMON perform intelligent analysis and send SNMP traps to management consoles when significant events occur.
Using RMON, the administrator can get an end-to-end view of the network. The types of data collected and the alerts and actions that are associated with RMON are different than those of the standard SNMP type. The objects for RMON fall into the following MIB groups:
![]() Statistics—This group records data collected about network interfaces. A table called EtherStatsTable contains one entry for each interface to hold this data and also contains control parameters for this group. Statistics include traffic volume, packet sizes, and errors.
Statistics—This group records data collected about network interfaces. A table called EtherStatsTable contains one entry for each interface to hold this data and also contains control parameters for this group. Statistics include traffic volume, packet sizes, and errors.
![]() History—The control function of this group manages the statistical sampling of data. This function controls the frequency at which data is sampled on the network. The historyControlTable is associated with this group. The history function of this group of objects records the statistical data and places the data in a table called the etherHistoryTable.
History—The control function of this group manages the statistical sampling of data. This function controls the frequency at which data is sampled on the network. The historyControlTable is associated with this group. The history function of this group of objects records the statistical data and places the data in a table called the etherHistoryTable.
![]() Hosts—This group tracks hosts on the network by MAC addresses. Information in the hostControlTable specifies parameters for the monitoring operations, and a table called the hostTimeTable records the time a host was discovered on the network.
Hosts—This group tracks hosts on the network by MAC addresses. Information in the hostControlTable specifies parameters for the monitoring operations, and a table called the hostTimeTable records the time a host was discovered on the network.
![]() HostTopN—This group is used to rank hosts by a statistical value, such as the number of errors generated or “top talkers.” The TopNControlTable contains the control parameters for this group, and the hostTopNTable keeps track of the data.
HostTopN—This group is used to rank hosts by a statistical value, such as the number of errors generated or “top talkers.” The TopNControlTable contains the control parameters for this group, and the hostTopNTable keeps track of the data.
![]() Matrix—Data recorded by this group involves the exchange of frames between hosts on the network. Statistics are kept here for data traveling in both directions between hosts.
Matrix—Data recorded by this group involves the exchange of frames between hosts on the network. Statistics are kept here for data traveling in both directions between hosts.
![]() Filter—This group specifies the types of packets that the RMON probe will capture, such as frame size.
Filter—This group specifies the types of packets that the RMON probe will capture, such as frame size.
![]() Capture—Although the Filter group specifies the parameters that are evaluated for capturing packets, this group is responsible for capturing packets based on those parameters.
Capture—Although the Filter group specifies the parameters that are evaluated for capturing packets, this group is responsible for capturing packets based on those parameters.
![]() Alarm—This group is used to set up alarms for events that are described in the next group, the Event group. Here you can set the sampling intervals and thresholds that will trigger an alarm. This group reads statistics that have been gathered, and when they exceed the threshold, an event is generated.
Alarm—This group is used to set up alarms for events that are described in the next group, the Event group. Here you can set the sampling intervals and thresholds that will trigger an alarm. This group reads statistics that have been gathered, and when they exceed the threshold, an event is generated.
![]() Event—When a variable exceeds a threshold defined by an alarm, an event is generated. This group can generate an SNMP trap to notify a network management station or record the information in a log. The Event Table is used to define the notification action that will be taken for an event, and the Log Table is used to record information.
Event—When a variable exceeds a threshold defined by an alarm, an event is generated. This group can generate an SNMP trap to notify a network management station or record the information in a log. The Event Table is used to define the notification action that will be taken for an event, and the Log Table is used to record information.
As this list shows, RMON provides a greater deal of functionality compared to SNMP. It allows for the collection of statistical data from all levels of the OSI reference model, including applications at the top in RMON2.
Because Ethernet and Token-Ring networks operate in a fundamentally different way, additional groups are defined in RFC 1513 that are specific to Token-Ring networks:
![]() Token-Ring Statistics—A group to store information about the behavior of the ring, from traffic volume to the number of beacons occurring, ring purges, and other information specific to Token-Ring.
Token-Ring Statistics—A group to store information about the behavior of the ring, from traffic volume to the number of beacons occurring, ring purges, and other information specific to Token-Ring.
![]() Token-Ring History—Similar to the History group used for Ethernet, this group keeps track of events on a historical basis.
Token-Ring History—Similar to the History group used for Ethernet, this group keeps track of events on a historical basis.
![]() Token-Ring Station—Detailed information about each station on the ring can be found here.
Token-Ring Station—Detailed information about each station on the ring can be found here.
![]() Station Order—The physical order of stations in the ring can be determined by information stored in this group.
Station Order—The physical order of stations in the ring can be determined by information stored in this group.
![]() Station Config—Configuration information for stations is stored here.
Station Config—Configuration information for stations is stored here.
![]() Source Routing—Monitors information about Token-Ring source routing for inter-ring traffic.
Source Routing—Monitors information about Token-Ring source routing for inter-ring traffic.
Alarms and Events
RMON agents can be programmed to take actions when specific things happen on the network. The Alarms and Events groups provide an important intelligence function.
Configuring an alarm consists of specifying a variable to be watched, the sampling interval, and the event that will be performed when a threshold is crossed. The threshold can be a rising or a falling threshold, or both. For example, an alarm can be set to notify you when something begins to go awry, and to tell you when the situation gets better.
An event that is generated by an alarm can be configured to send an SNMP trap message to one or more management consoles, and store the event in the Log Table. The management station can then take the actions it deems necessary, including retrieving information from the Log Table.
Establishing a Baseline
When making decisions on how to set up alarms and the events they generate, you should consider how the network functions normally. First monitor the network using RMON agents over a long period, noting when variations in traffic or errors occur. Make note of any fluctuations that regularly occur for specific dates or for a particular time of day.
Different network segments might require different sampling intervals and thresholds. For example, a local LAN segment might be subject to wide variations depending on only a small number of users, whereas a major backbone might fluctuate much less as traffic from many segments is blended together. When deciding on a sampling period, it’s best to use a shorter interval for a segment that experiences frequent fluctuations and a longer interval for a segment that behaves in a more stable manner.
Response to alarms can be in the form of immediate corrective action, as in the case of a defective device, or a long-term solution such as additional capacity or equipment. Regularly review the baseline values you set, and change them as network usage or topology changes. If alarms and events are not configured to reflect activity that is of a genuine concern, network operators might begin to ignore them, much like what happened to the boy who “cried wolf.”