
6 MEASURING USABILITY
Civilization advances by extending the number of important operations which we can perform without thinking about them.
Alfred North Whitehead (1911)
INTRODUCTION
This chapter describes how to build a design around objectively measurable concepts so that it can be progressively evaluated and improved using an iterative process. We examine the definition of usability and its subsidiary components of effectiveness, accuracy, completeness, efficiency and satisfaction. We see how these, together with the definition of the context of use, can form the basis for a series of experiments that will guide development. We introduce the Build–Measure–Learn loop and the idea of validated learning. To conclude, we show how split testing, A/B testing and multivariate testing can help to generate evidence-based decisions – when used in the right context.
LEARNING OBJECTIVES
After reading this chapter you will be able to:
|
Remember |
|
|
Understand |
|
|
Apply |
|
WHAT IS USABILITY?
When specifying requirements for a system, it is still quite common for people to write things like, ‘the system shall have a user-friendly [or intuitive] interface’, or ‘all information shall be accessible within two mouse clicks’. These are not useful statements of requirements. The first example is impossibly vague and could mean anything. The second at least attempts to be specific, but unfortunately is based on inappropriate preconceptions about what makes a system usable.
We can only be sure of designing a usable system if we have a way of measuring usability precisely. To use a scientific term, we need to operationalise the concept of usability. Operationalising a concept means taking something that seems intangible and impossible to measure, and specifying how to measure it. This often involves defining subsidiary elements that split the concept up into parts. The overall effect is to bring the concept into sharper focus.
Besides defining the context of use, the other great contribution of ISO 9241-11 is that it does exactly what we need here: it operationalises the concept of usability by identifying its components and subcomponents to the extent that they can be tested. Hence there is no need for us to flounder around with useless requirements like those quoted above.

Definition: usability
The extent to which a system, product or service can be used by specified users to achieve specified goals with effectiveness, efficiency and satisfaction in a specified context of use (ISO 9241-11, 2018)
The definition contains three items that we have already talked about at some length:
- Users
- Goals
- Context of use (which of course actually includes users and goals)
It introduces three further concepts:
- Effectiveness
- Efficiency
- Satisfaction
Fortunately, these are also carefully defined.
Effectiveness
Definition: effectiveness
The accuracy and completeness with which users achieve specified goals (ISO 9241-11, 2018)
Accuracy and completeness are most appropriately considered from the user’s point of view, rather than the system. We should not be asking whether the system gave accurate or complete output, or whether the user interacted with the system in the correct way, but rather whether the user was able to achieve exactly what they intended, with the help of the system. Accuracy and completeness also each have a definition.
Definition: accuracy
The extent to which an actual outcome matches an intended outcome (ISO 9241-11, 2018)
Definition: completeness
The extent to which users are able to achieve all intended outcomes (ISO 9241-11, 2018)
When the user succeeds in achieving the outcome they intended, it is quite hard to tell the difference between accuracy and completeness. It is easier to see when something goes wrong. For example, if I book two railway tickets for next Tuesday and then find on checking the confirmation email that one of them is for the wrong destination, that is a problem of accuracy. If one of them is missing altogether, that is a failure of completeness.
We can evaluate whether users can achieve their goals accurately and completely by creating a scenario that requires them to achieve a typical goal, asking several typical users to enact the scenario, and then taking measurements, such as:
- What percentage of users achieved the goal completely?
- What percentage of users achieved the goal accurately?
- What percentage of users achieved the goal both completely and accurately? This is sometimes referred to as ‘success rate’.
- If any users did not achieve the goal completely, to what extent did they complete it?
- If any users did not achieve the goal accurately, how serious were the inaccuracies?
Effectiveness measures are most often reported as percentages.
Efficiency
Definition: efficiency
The resources used in relation to the results achieved (ISO 9241-11, 2018)
As the old saying goes, ‘Good, cheap, fast – pick two!’ In other words, effectiveness may come at a cost in terms of either money, time or some other scarce resource.
When assessing usability, the resource most often considered is time. As an even older saying goes, ‘time is money’. We can evaluate the time taken by users to complete tasks easily enough. Hence, efficiency is most often reported as a length of time measured in seconds.
Other resources that might be considered relevant are cognitive load, goodwill and patience. We can measure cognitive load by testing the participant’s ability to carry out some other basic task simultaneously with the task being assessed. Goodwill and patience are usually covered by measuring satisfaction.
Satisfaction
Definition: satisfaction
The extent to which the user’s physical, cognitive and emotional responses that result from the use of a system, product or service meet the user’s needs and expectations. This includes the extent to which the user experience that results from actual use meets the user’s needs and expectations. Anticipated use can influence satisfaction with actual use (ISO 9241-11, 2018)
The definition of satisfaction acknowledges the close link between satisfaction and user experience. Remember that user experience itself is defined as ‘a user’s perceptions and responses resulting from the use and/or anticipated use of a system, product or service’. What we are testing here, then, is the quality of the user experience resulting from actual use of the product. This includes emotional reactions.
Satisfaction can be measured using the System Usability Scale (SUS) (Brooke, 1996). This is a very well-established questionnaire that asks to what extent the user agrees with the following propositions:
- I think that I would like to use this system frequently.
- I found the system unnecessarily complex.
- I thought the system was easy to use.
- I think that I would need the support of a technical person to be able to use this system.
- I found the various functions in this system were well integrated.
- I thought there was too much inconsistency in this system.
- I would imagine that most people would learn to use this system very quickly.
- I found the system very cumbersome to use.
- I felt very confident using the system.
- I needed to learn a lot of things before I could get going with this system.
A five-point scale from ‘Strongly disagree’ to ‘Strongly agree’ is used for responses, which are then converted into a numeric SUS score.
Method for measuring usability
We can now see that the ISO 9241-11 definitions give much-needed clarity on how to evaluate and design for usability. We need to:
- Define the context of use, as described in the previous two chapters.
- Create an evaluation environment that enables us to mirror the context of use.
- Define acceptable levels of accuracy, completeness, efficiency and satisfaction.
- Have users, or people who are qualified to represent users in accordance with step 1, attempt to carry out tasks to achieve their goals in that environment, using the designs we have created.
- Assess whether the target levels were achieved.

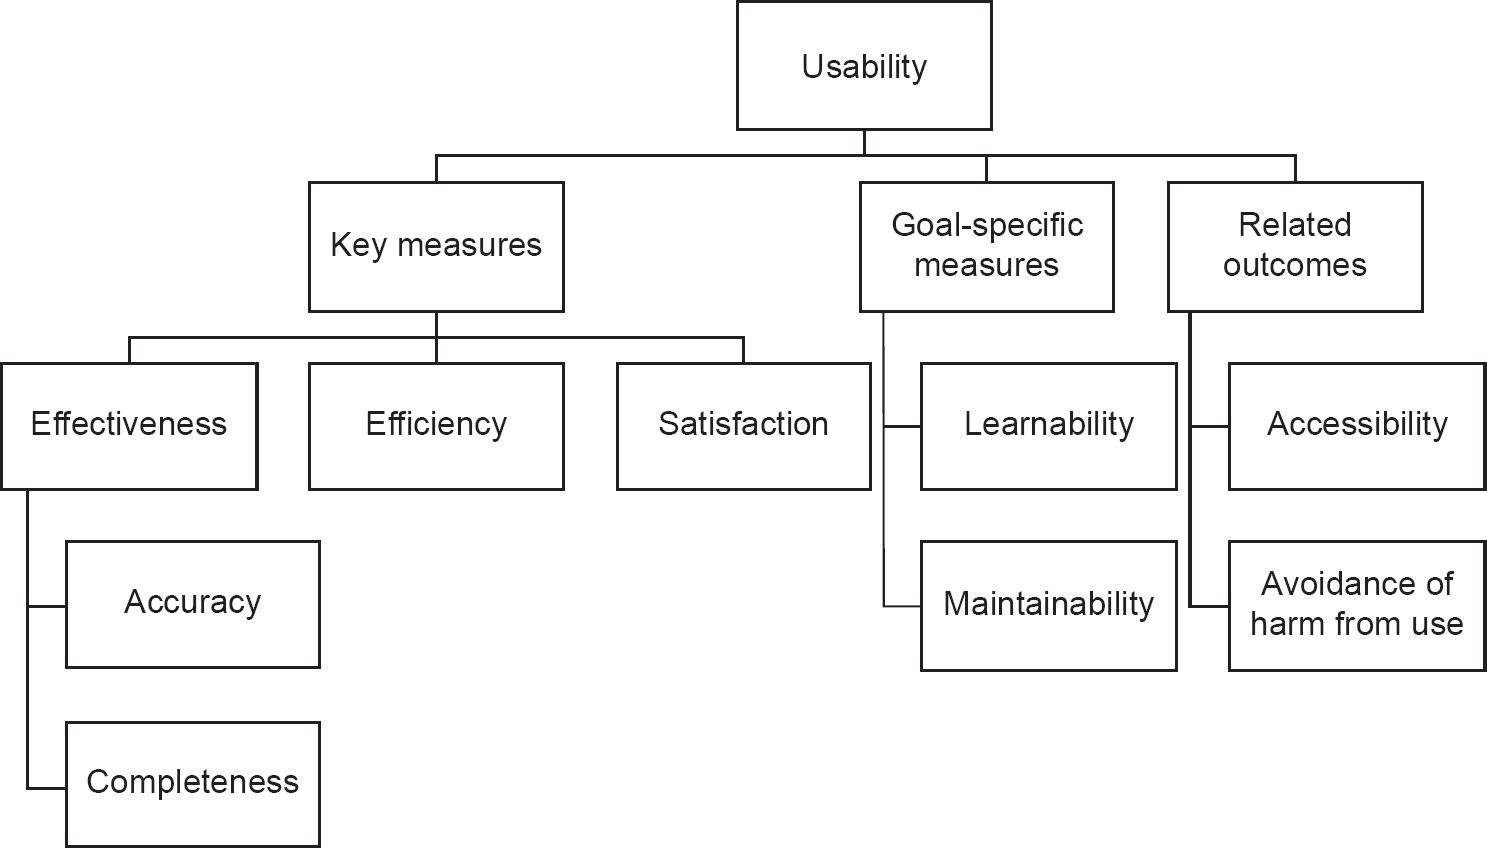
Other dimensions of usability
Some other aspects of a system’s usability are identified by ISO 9241-11. These include two measures related to commonly encountered goals of direct and indirect users respectively:
- Learnability: how well does the system support the goal of learning to use it? Arguably this includes memorability – how well does the system support the goal of remembering how to use it between episodes of use?
- Maintainability: how well does the system support the goals of maintaining it?
The standard also identifies some other outcomes of system use that are not considered part of usability, but are highly relevant:
- Accessibility: how usable is the system by people with a wide range of needs? This is discussed further in Chapter 11.
- Avoidance of harm from use: what negative consequences might arise from using the system?
These are shown as further measures in Figure 6.1.
Figure 6.1 Measures of usability
ITERATIVE DESIGN IN A USER-CENTRED PROCESS
The method for testing usability described above will allow us to evaluate one particular design. However, being able to evaluate one design falls a long way short of guaranteeing a good final product. Many products and systems are inherently complex. A system’s fitness for purpose is the result of even more complex interactions among its intrinsic properties, the users’ characteristics, behaviours and motivations, their goals, and all the other elements of the social, physical and technical environment. We can only hope to achieve a good end product by proceeding with comparatively small steps and testing as we go. This is why user-centred design is iterative, as described in Chapter 3.
Validated learning
In The Lean Startup (2011), Eric Ries describes an approach to dealing with uncertainty in business based on the experimental method. Recognising the importance of assumptions in any enterprise that is based on creating something new, Ries proposes using validated learning as the driving principle in developing innovative solutions.
In a nutshell, validated learning means identifying assumptions that you are making, and immediately designing experiments to find out whether they are justified or not, making the ‘feedback loop’ as short as possible. Ries structures his approach as a cycle with three phases: Build–Measure–Learn. This fits perfectly with the iterative nature of user-centred design. The shorter the feedback loop, the more learning cycles we are able to go through, and ultimately the more we can learn, providing we make a systematic effort to prioritise learning.
To test an assumption, we need to reframe it as a hypothesis: in a defined set of circumstances, if a certain thing happens, then a certain thing will be the result. We can identify two key types of hypothesis that are relevant. The first is the problem hypothesis. This represents our idea that certain users have a particular problem when it comes to achieving their goals in certain environments. We can carry out user research to find out whether this is true or not. This is targeted research designed as an experiment, to give maximum clarity and certainty about whether the assumption is correct. The details of the experiment will depend very much on the type of the problem, but will involve gathering quantitative data on user behaviour, rather than opinions or preferences. We may well iterate through several different design hypotheses before settling on one. Proto-personas, as described in Chapter 5, are part of this.
A solution hypothesis is defined in terms of how a particular design concept might help the users to achieve their goals, by simplifying their tasks or reframing the problem. This can also be tested by user research, preferably based on carrying out usability testing (see Chapter 11) using a prototype (see Chapter 10). Again, we will hope to cycle through many solution hypotheses during a project.
A design hypothesis is a proposition that can be supported or proven to be false by a design experiment. In principle (real experiments will often be less formal than this) it will be structured like this:
- if we provide tool <T> with functionality <f>
- user <u> will be able to achieve goal <g> in environment <e>
- in time <t> or with satisfaction <s> and so on
The key questions to ask at the beginning of each cycle are:
- Identifying the next hypothesis: ‘What is the most important thing we need to learn at this stage? Which assumption is the riskiest? Which assumption will cause the entire idea to fail if it is mistaken?’
- Designing the experiment: ‘What is the smallest amount of work we can possibly do to learn the most important thing? How can we get an answer as fast as possible?’
Split testing
Another way of testing design ideas is to carry out multivariate testing or A/B testing. These are two flavours of a general technique known as split testing. In split testing, two or more different designs are given to different visitors as part of their experience with a live website. Special-purpose software is able to direct a given proportion of web server requests to each variation on the design – this may be as simple as two versions of the same web page with one very localised difference, or it may be a sequence of entirely different pages. ‘A/B testing’ is sometimes used to describe an experiment where versions of an entire web page are contrasted with each other, whereas ‘multivariate testing’ can specifically refer to more fine-grained testing where many permutations of variants on detailed elements are compared. Some visitors see one version, and some see another, without even knowing about it, and the results are then analysed to see which was more successful in helping the users to achieve their goals.
Split testing is an example of a purely evidence-based, data-driven design approach. In principle, techniques like this allow us to make good design decisions without wasting time in pointless arguments on the basis of unsubstantiated opinions. Once the necessary technical environment is set up for running split-testing experiments, it is possible to run very many experiments at scale.
Split testing is only useful in the context of a live web-based service that has a very large number of users. If only a few users are involved, the results will lack statistical significance. Another feature of split testing is that it gives no insight into the reason why one design is more effective than another, only the extent to which the outcome varies. It is useful when fine-tuning the details of the design in the later stages of a project. As a technique that generates decisions rather than new possibilities, it is an example of convergent as opposed to divergent thinking (see Chapter 12).
SUMMARY
Usability is defined as ‘the extent to which a system, product or service can be used by specified users to achieve specified goals with effectiveness, efficiency and satisfaction in a specified context of use’ (ISO 9241-11, 2018). Usability can be measured objectively by measuring the components of this definition in a controlled way.
A user’s experience with a system will inevitably generate an emotional reaction. Satisfaction, which measures this, is the most subjective component of usability. However, it can be evaluated using a standard survey.
The team’s progression towards the delivery of a valuable end product needs to be conceived of as a learning journey. With each cycle of the user-centred process, they must undertake validated learning: identify the most important areas of uncertainty, then create hypotheses and design experiments to gain the understanding they need.
Split testing, including A/B testing and multivariate testing, automates the assessment of alternative designs’ relative strengths, and allows decisions to be taken on the basis of facts rather than opinions, but it does not give any insight into the reasons why one design performs better than another.
REFERENCES
Brooke, J. (1996) SUS: a quick and dirty usability scale. In Jordan, P.W., Thomas, B., Weerdmeester, B.A. and McClelland, I.L. (eds), Usability Evaluation in Industry. Taylor & Francis, London.
ISO 9241-11:2018 (2018) Ergonomics of Human-System Interaction – Part 11: Usability: Definitions and Concepts. International Organization for Standardization (ISO), Geneva.
Ries, E. (2011) The Lean Startup: How Today’s Entrepreneurs Use Continuous Innovation to Create Radically Successful Businesses. Penguin, London.
Whitehead, A.N. (1911) An Introduction to Mathematics. Cambridge University Press, Cambridge.
Albert, W. and Tullis, T. (2013) Measuring the User Experience: Collecting, Analyzing, and Presenting Usability Metrics. Newnes, Oxford.
Gothelf, J. and Seiden, J. (2013) Lean UX: Applying Lean Principles to Improve User Experience. O’Reilly Media, Sebastopol, CA.
Travis, D. (2002) E-Commerce Usability: Tools and Techniques to Perfect the On-Line Experience. Taylor & Francis, London.
EXAMPLE EXAMINATION QUESTIONS
1. Which of the following aspects of usability are MOST important for each scenario? Match the choices.
1. An online multiplayer game used by teenagers
2. A fingerprint identification system used by trained police officers
3. A kiosk in a museum that helps visitors find an exhibit
4. A call logging system used by trained call centre operatives
W. Task completion rate
X. Time to complete the task
Y. A rating scale to measure satisfaction with the task
Z. A count of the number of incorrect decisions
a. 1Y, 2Z, 3W, 4X
b. 1Z, 2Y, 3X, 4W
c. 1X, 2W, 3Y, 4Z
d. 1Y, 2X, 3Z, 4W
2. What role do design experiments play when creating products?
a. Design experiments help the design team validate their learning about customers
b. Design experiments encourage the design team to get face to face with users
c. Design experiments guarantee that design decisions are statistically significant
d. Design experiments ensure that the development team is working within an Agile framework
1. The correct answer is (a).
It’s true that task completion rate is an important measure for all systems, but (2) and (4) are systems used by expert users and these people will have the experience or training to complete the tasks. Efficiency is most important in a call centre task, which is why (X) is the best choice. With games, part of the enjoyment is becoming immersed in the task, so task completion, time to complete and incorrect decisions are poor metrics: satisfaction (Y) is the best choice. For the fingerprint system, all of these measures are important but (Z) is the best choice because incorrect decisions could lead to identifying the wrong suspect. Option (a) is therefore the preferred answer.
2. The correct answer is (a).
Option (d) is not correct since teams can practise Agile without carrying out design experiments (and vice versa). Option (c) is incorrect because the results from design experiments do not need to be statistically significant to be useful (often teams are just looking to see which way the wind blows). Although (b) is partly true, a team can carry out a design experiment without directly engaging with a user (e.g. A/B testing). This leaves (a) as the correct answer.