
13. Viewing Blog Statistics
Objective: To use third-party tools to keep track of traffic to your blog.
If you’re hosting a blog, eventually you’re going to get curious about how many people are reading it. Unfortunately, Blogger doesn’t offer any built-in visitor counters or other usage tracking.
You can, however, utilize a variety of third-party tools to track your blog’s traffic. These tools will tell you how many visitors you’re getting, where they’re coming from, what they’re doing while visiting your blog, and so forth.
If you want to view usage statistics, you need to add one of these tools to your blog. Read on to learn how.
Using Third-Party Statistics Tools
I’ll start by presenting some of the third-party tools available to track your site’s traffic and usage. Most of these third-party tools work in much the same fashion.
First, you sign up for the service and generate a piece of HTML code. You then insert this code into an HTML/JavaScript gadget you add to the bottom of your blog page. The inserted HTML code then tracks visitors to your blog and reports that information back to the service’s main site. You access the site to generate reports about your blog’s usage.
What tracking tools are available for your Blogger blog? Let’s look at the most popular ones.
Tell Me More: Media 13.1—Why Tracking Is Important

Why should you track your blog’s visitors? Learn why in the audio clip titled “Why Tracking Is Important” on the companion Using website, my.safaribooksonline.com/9780132119603/media.
Bravenet Hit Counter
The Bravenet Hit Counter (www.bravenet.com/webtools/counter/) is a free hit counter and statistics generator. The hit counter appears at the bottom of your blog, showing how many visitors your page has received. It then sends data back to the Bravenet mothership, which generates a raft of statistics about your site you can view in a series of reports.
The Bravenet statistics page includes the following sections:
• Overview—Tracks returning visitors, first-time visitors, unique visitors, and page views for the past week
• Today’s Traffic Summary—Displays unique visitors, page views, first-time visitors, returning visitors, and unique visitors/page views for the current day
• Top Statistics—Displays the busiest time of day and busiest day of the week for your blog, as well as the screen resolution, operating system, color depth, and web browser used by your blog’s visitors
• Cumulative Statistics—Presents life-to-date totals for page views, unique visitors, and unique visitors/page views
eXTReMe Tracking
The eXTReMe Tracking service (www.extremetracking.com) is a free visitor tracking tool that doesn’t place a counter on your blog. All the tracking is done in the background, after you copy the tracking code into your blog’s HTML.
The eXTReMe Tracker tracks the following data:
• Geo tracking—Tracks visitors by country and continent
• Referrer tracking—Tracks where your blog’s visitors came from
• System tracking—Tracks the web browser, operating system, screen resolution, and screen color used by your blog’s visitors
• Unique visitors—Tracks the number of unique visitors by day, week, month, hours of the day, and days of the week
FreeStats
FreeStats (www.freestats.com) is another free visitor counter/tracking service. Insert the code in an HTML/JavaScript gadget, and FreeStats displays a visitor counter and starts generating the following reports:
• Traffic report—Reports hourly/daily/monthly/yearly traffic, most popular pages, and current visitors
• Path report—Reports top paths, entry pages, and exit pages, plus a page analysis
• Marketing report—Reports top referrers, search engines, and keywords, plus time spent on the site and return frequency
• Visitor profile report—Reports last 100 visitors, latest visitor detail, window size, browser, monitor resolution, colors, operating system, languages, countries, JavaScript, cookies, and time zone
Pax Hit Counters
Pax (www.pax.com/free-counters.html) offers free hit counters in a variety of styles for your blog. Once installed, the counter tracks your blog’s page hits and unique visitors—not necessarily the most detailed statistics reporting, but the selection of different counter styles is a nice touch.
Sitemeter
Sitemeter (www.sitemeter.com) is another free statistics generation service, offering a nice variety of data tracking. This service tracks the following data:
• Visits—Tracks total, average per day, average visit length, last hour, today, and this week
• Page views—Tracks total, average per day, average per visit, last hour, today, and this week
• Who’s on?—Tracks current visitors to your blog
• Traffic prediction—Predicts how many visitors you’re expected to host over the next hour, day, week, and month
• Recent visitors—Reports by details, referrals, world map, location, out clicks, entry pages, and exit pages
• Page ranking—Reports your top entry and exit pages
You can opt to have Sitemeter display a simple logo at the bottom of your blog, or display various types of visitor counters.
StatCounter
StatCounter (www.statcounter.com/blogger) is a free service that can display either a visible or invisible visitor counter on your blog. It then generates a variety of tracking reports, including the following:
• Configurable Summary Stats—Tracks page loads, unique visitors, first-time visitors, and returning visitors by any time period you select
• Magnify User—Enables you to “zoom in” on individual users and generate a report on where they live, their system settings, and what site they came from
• Drill Down—Enables detailed drill-down analysis of virtually any statistic
• Popular Pages—Lists the most popular pages on your blog
• Entry Pages—Lists the most popular entry or landing pages on your blog
• Exit Pages—Lists those pages where the most visitors exit your blog
• Came From—Displays the top referring pages to your blog
• Keyword Analysis—Displays the top keywords used to search for your blog
• Recent Keyword Activity—Tracks the most recent keywords used to search for your blog
• Search Engine Wars—Tracks which of the major search engines generated the most traffic to your blog
• Visitor Paths—Tracks the most recent visitors to your blog and displays the navigation path they took
• Visit Length—Tracks how long visitors spent on your blog
• Returning Visits—Tracks what percent of visitors previously visited your blog
• Recent Pageload Activity—Tracks the most recent pageviews on your blog
• Recent Visitor Activity—Displays a list of the most recent visitors to your blog
• Country/State/City Stats—Tracks the geographical location of blog visitors
• Recent Visitor Google Map—Plots the most recent visitors to your blog on a Google Map
• ISP Stats—Tracks the most popular ISPs used by your blog visitors
• Browser Stats—Tracks which web browsers your visitors are using
• Operating System Stats—Tracks which operating systems your visitors are using
• Resolution Stats—Tracks the monitor resolution used by your blog’s visitors
• JavaScript Stats—Tracks what percent of your blog’s visitors have JavaScript enabled on their computers
StatCounter offers perhaps the largest range of reports—outside what Google itself offers with Google Analytics, discussed next.
Using Google Analytics
All those third-party tools are nice, but there’s another site tracking tool that is just as easy to use and offers a wider range of reporting options. Google Analytics, as you can probably tell from the name, is Google’s site analysis tool, and it’s free, easy to use, and extremely comprehensive in what it tracks.
You access Google Analytics at www.google.com/analytics. It integrates seam-lessly with your blog and generates more statistics than you could possibly imagine.
Configuring Google Analytics for Your Blog
To use Google Analytics, you first have to sign up and place the tracking code in an HTML/JavaScript gadget on your blog. It’s easy to do.
 LET ME TRY IT
Setting Up Google Analytics
To start using Google Analytics, follow these steps:
- Go to the main Google Analytics page (www.google.com/analytics) and click the Access Analytics button.
- On the next page, enter your Google account email address and password, then click the Sign In button.
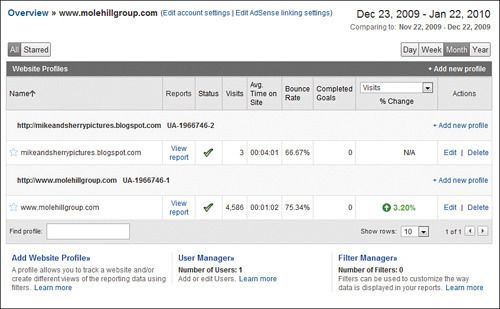
- You now see the Google Analytics Overview page, shown in Figure 13.1; any sites or blogs you’re currently tracking are listed here. Click the Add Website Profile link.
Figure 13.1. The Google Analytics Overview page—your gateway to Google Analytics.
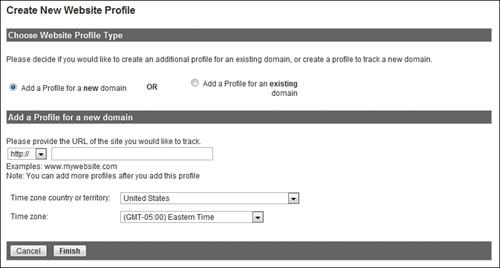
- When the Create New Website Profile page appears, as shown in Figure 13.2, select the Add a Profile for a New Domain option.
Figure 13.2. Adding your blog to Google Analytics.
- Enter the URL for your blog into the URL box.
- Select the appropriate country and time zone from the lists.
- Click the Finish button.
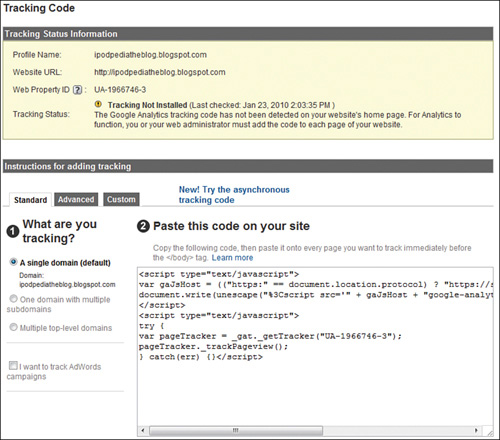
- Google now displays the Tracking Code page, shown in Figure 13.3. Select and copy the code from the Paste This Code on Your Site box.
Figure 13.3. Copy this tracking code to your blog.
- Go to the Blogger Dashboard and click the Layout link for the blog you want to track.
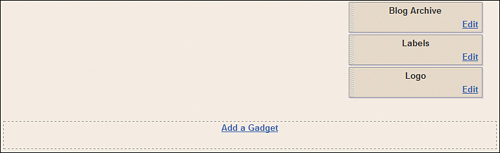
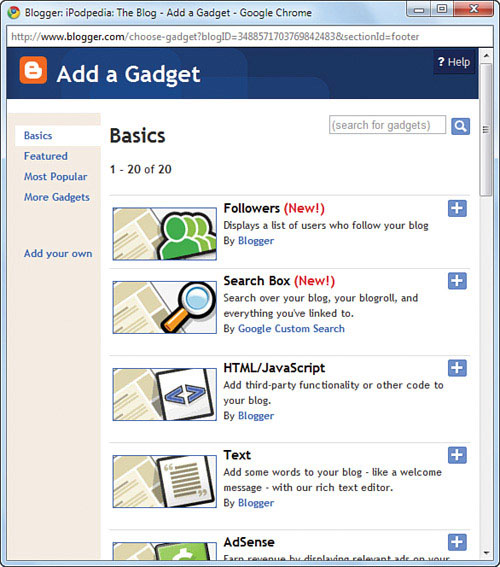
- When the Page Elements tab appears, scroll down to the bottom of the page and click the Add a Gadget link beneath the blog postings, as shown in Figure 13.4.
Figure 13.4. Add a new gadget to the bottom of your blog.
- When the Add a Gadget window appears, as shown in Figure 13.5, click the + button for the HTML/JavaScript item.
Figure 13.5. Add an HTML/JavaScript gadget.
- When the Configure HTML/JavaScript window appears, as shown in Figure 13.6, make sure the Title box is left blank then paste the copied tracking code into the Content box.
Figure 13.6. Paste the Google Analytics tracking code into this window.
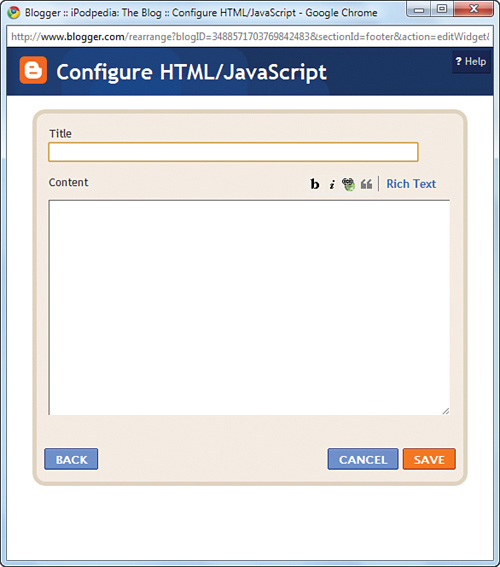
- Click the Save button.
That’s it. The tracking code is now active and invisible on your blog. There is no visitor counter or logo displayed; all the tracking happens in the background.
Tracking Your Blog’s Statistics
Once you’ve installed the tracking code, Google Analytics begins to track all the visitor activity on your blog. It feeds the data into a big database and then displays a variety of usage reports, all accessible from the Google Analytics Dashboard.
Show Me: Media 13.2—How to Set Up Google Analytics

To learn how to configure your blog to use Google Analytics, see the video titled “How to Set Up Google Analytics” on the companion Using website, my.safaribooksonline.com/9780132119603/media
LET ME TRY IT
Displaying Google Analytics Reports
To view Google Analytics reports of your blog traffic, follow these steps:
- Log in to your Google Analytics account.
- From the Google Analytics Overview page, click the View Report link next to your blog listing.
- You now see the Dashboard for your blog, as shown in Figure 13.7. Click any link in a graph or table to view more detailed information.
Figure 13.7. The Google Analytics Dashboard.
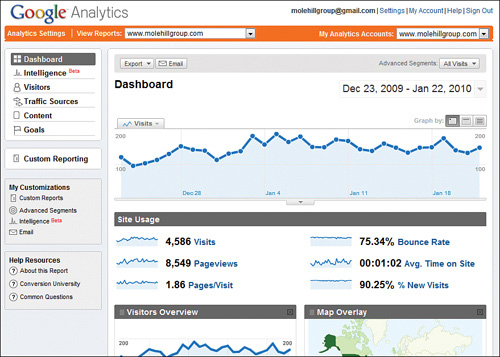
- To view additional statistics, click one of the links in the reports panel on the top left side of the page—Intelligence, Visitors, Traffic Sources, Content, or Goals.
LET ME TRY IT
Creating Custom Reports
If the stock reporting isn’t to your liking, Google Analytics also lets you create all manner of custom reports. Follow these steps to create a custom report:
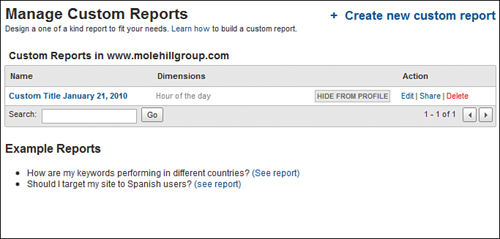
- From your blog’s Google Analytics Dashboard, click the Custom Reporting link in the left pane, then click Manage Custom Reports.
- When the Manage Custom Reports page appears, as shown in Figure 13.8, click Create New Custom Report.
Figure 13.8. Accessing Google Analytics’ custom reports.
- To add a metric to the graph, click the data type in the Metrics box in the left pane, then drag the individual metric onto one of the Metric boxes underneath the graph.
- To select what data to track, click the data type in the Dimensions box, then drag a specific item to the Dimension box underneath the graph.
- To drill down to another level of data, click the data type in the Dimensions box, then drag a specific item to the Sub Dimension box underneath the graph.
- Click the Preview Report button to see a preview of the report, or click the Create Report button to view the finished report. (Figure 13.9 shows a sample custom report.)
Figure 13.9. A custom Google Analytics report.
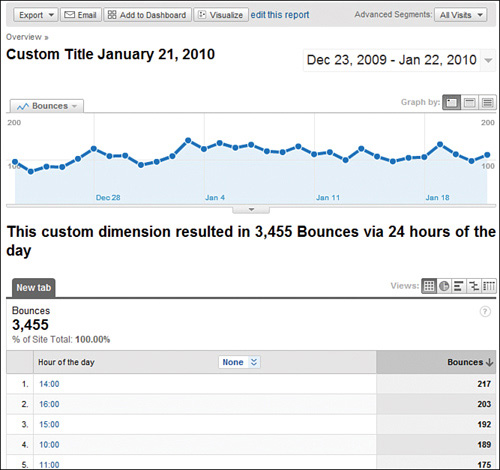
Google now generates the report you created, and adds the report to the Custom Reporting section of the Dashboard, as well as to the Manage Custom Reports page.
Understanding Dashboard Data
The Google Analytics Dashboard displays the most valuable usage data for your blog. This data includes the following:
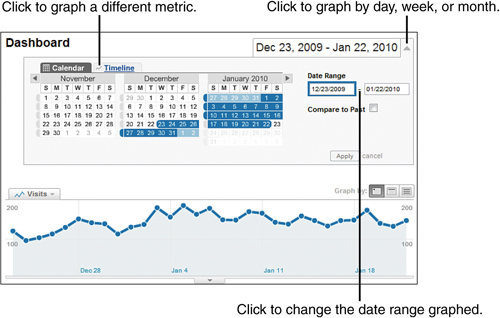
• Overview graph—By default, this graph at the top of the Dashboard page displays the number of site visits to your blog over the past month. You can display other data (page views, pages/visit, average time on site, bounce rate, and percent of new visits) by clicking the button on the top left of the graph, shown in Figure 13.10. To display data by week or month instead of day, click the Graph By button on the top right of the graph. To graph a different time frame, click the down arrow next to the date range and select different start and end days from the displayed calendar.
Figure 13.10. Customizing the Dashboard graph.
• Visits—The total number of unique times your site was visited during the selected period.
• Pageviews—The total number of times this page was visited during the selected period. For a single-page blog, Visits and Pageviews should be the same number. That said, if a visitor refreshes the page, that counts as a new page view (but not a new visit), as does going to another page on your site and then returning to this page.
• Pages/Visit—The average number of pages viewed per visit.
• Bounce Rate—The percent of visitors who don’t stick around—that is, those who quickly leave your blog after first visiting it. Obviously, a high bounce rate means that people don’t like and aren’t reading what they find.
• Avg. Time on Site—The average length of time (in minutes and seconds) that visitors spend on your blog.
• % New Visits—The percent of visitors who are new to your blog.
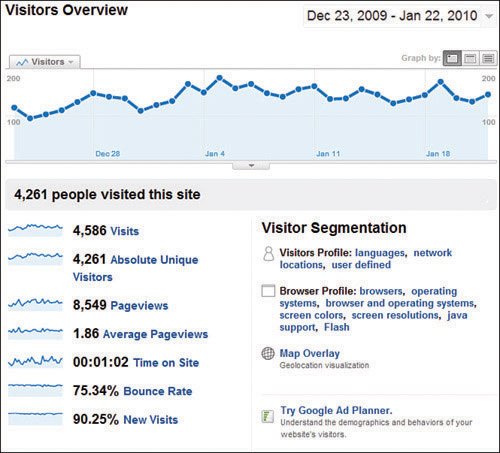
• Visitors Overview—A graph (shown in Figure 13.11) of the total number of visitors per day. Click the View Report link to view more detailed visitor information, shown in Figure 13.12, including total Visits, Absolute Unique Visitors, Pageviews, Average Pageviews, Time on Site, Bounce Rate, and New Visits—as well as technical information about the browsers used and the visitors’ connection speeds.
Figure 13.11. The Visitors Overview graph.
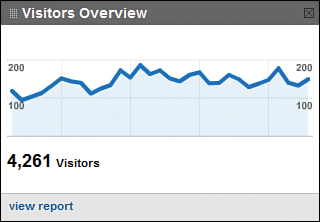
Figure 13.12. Viewing detailed visitor information.
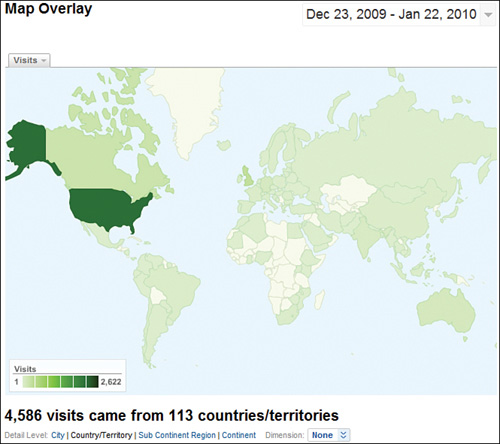
• Map Overlay—A graph of the world, with the countries from which you got the most visitors highlighted in a darker shade. Click the View Report link to view more detailed information by country, as shown in Figure 13.13.
Figure 13.13. Viewing visitors by country.
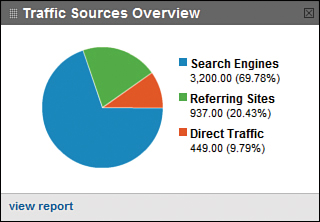
• Traffic Sources Overview—A pie chart (shown in Figure 13.14) that tracks where your blog’s visitors came from. Click the View Report link to view this data in more detail, including the specific search engines that drove traffic, as well as the keywords searched that brought up your blog in their results.
Figure 13.14. The Traffic Sources Overview graph.
• Content Overview—A list of the most-viewed pages on your blog. Click the View Report link to view more detailed data about your site’s content—including a navigation analysis and a display of visitor click patterns for your page.
Show Me: Media 13.3—How to Use Google Analytics
To learn more about using Google Analytics, see the video titled “How to Use Google Analytics” on the companion Using website, my.safaribooksonline.com/9780132119603/media.
Viewing Other Reports
As useful as the Dashboard is, Google Analytics offers a lot more detail than what you find there. To really drill down into the data, Analytics offers five other types of reporting, all accessed from the top-left panel on the Dashboard.
The other reporting types including the following:
• Intelligence—This is a new type of reporting, where Google displays various automatic and custom alerts. Automatic alerts are generated when your site’s actual performance differs significantly from expected performance; custom alerts are those you create to be notified when a certain performance aspect is achieved.
• Visitors—These reports track various metrics related to your blog’s visitors. Available reports include Overview, Benchmarking, Map Overlay, New vs. Returning, Languages, Visitor Trending, Visitor Loyalty, Browser Capabilities, Network Properties, Mobile, User Defined, and Custom Variables.
• Traffic Sources—These reports track the various sources of traffic to your blog. Available reports include Overview, Direct Traffic, Referring Sites, Search Engines, All Traffic Sources, AdWords (if you’re an advertiser), Keywords, Campaigns, and Ad Versions.
• Content—These reports track the pages and content on your site. Available reports include Overview, Top Content, Content by Title, Content Drill-down, Top Landing Pages, Top Exit Pages, and Site Overlay. There are also additional reports for Site Search, AdSense, and Event Tracking.
• Goals—Do you have a defined goal for your blog, in terms of visitors or sales or whatever? If so, you can set up those goals within Google Analytics and then track them with these reports: Overview, Total Conversions, Conversion Rate, Goal Abandoned Funnels, Goal Value, and Funnel Visualization.
All of these stock reports can be further customized by clicking the various elements within the report, selecting different date ranges, sorting by various columns, and the like. As you can see, Google Analytics offers virtually limitless reporting; use as much or as little as you like.